

 PDF
PDF Citation
 Print
Print


INTRODUCTION
Due to the increased use of prostate-specific antigen (PSA) testing and prostate cancer (PC) screening programs, the diagnosis rate of early-stage PC has increased.12 Men diagnosed with localized PC have several treatment options, including radical prostatectomy (RP), radiation therapy, and active surveillance.34 Minimally invasive treatments such as focal cryotherapy have emerged and show encouraging outcomes.5
Among the several treatment options, optimum treatment of clinically localized PC remains controversial, and determining the best treatment strategy is difficult for both doctors and patients. Recently, most patients have preferred to play an active role in the treatment decision-making process, and almost all patients reported satisfaction with their decision.6 This decision-making process may take a fairly long time; and several factors may affect the time interval between biopsy and surgery.
Post-biopsy changes on magnetic resonance imaging (MRI) for staging workup can last up to 21 days and in some cases up to 4.5 months after prostate biopsy.789 Although multiparametric MRI can help distinguish between PC and hemorrhage due to biopsy,10 delaying MRI for several weeks after biopsy to allow for hemorrhage absorption may improve the accuracy of staging work-up. When planning surgery, the currently widely accepted practice is to wait at least 6 weeks after a prostate biopsy before undergoing RP for PC1112 because waiting a short time before RP could produce periprostatic inflammatory adhesions or hematomas resulting from biopsy. Other factors such as clinician or institution schedules may cause an additional delay to surgery.
As the decision-making process and the time interval to surgery become longer, there is a concern that postoperative outcome may be poor due to the longer time interval, although PC shows slow progression. Actually, pathologic Gleason score (GS) upgrading has been found in 30% to 50% of RP specimens, indicating that tumor grade increases between biopsy and surgery.1314
Many reports have been published on whether a longer time interval from biopsy to surgery for clinically localized PC has adverse effects on postoperative outcome; however, the results are controversial, and studies on Korean men have not been reported.1516171819202122
In this retrospective study, we investigated whether a longer time interval between prostate biopsy and RP is associated with poor postoperative outcome in Korean men with localized PC. We compared adverse pathologic outcomes based on multiple variables and biochemical recurrence (BCR) based on time interval from biopsy to RP.
METHODS
Patient population and inclusion criteria
Data of 603 men who underwent open RP for clinically localized PC between January 2005 and June 2016 were retrospectively analyzed in this institutional review board (IRB)-approved study. Surgery was performed by five urologists using the retropubic approach. Patients who had previously undergone prostate surgery such as transurethral resection of prostate and photovaporization of prostate (n = 4) or preoperative adjuvant radiation or hormonal therapy (n = 16) were excluded. Patients with incomplete preoperative data (n = 20) or lack of follow-up within 12 months (n = 24) were also excluded. Among these patients, data of very low-, low-, and intermediate-risk patients according to the National Comprehensive Cancer Network (NCCN) guidelines, which are considered for localized PC, were extracted; finally, 427 patients were included in the analysis. No included patient had signs of lymph node or distant metastasis on preoperative imaging or final surgical pathology.
PC risk classification according to the 2018 NCCN guidelines is as follows: low-risk is defined as biopsy GS sum ≤ 6, PSA < 10 ng/mL, and clinical stage ≤ T2a; intermediate-risk is defined as biopsy GS sum 7, PSA 10–20 ng/mL, and clinical stage T2b–T2c. Very-low risk (clinical stage T1c, GS sum ≤ 6, PSA < 10 ng/mL, fewer than 3 positive prostate biopsy fragments/cores, ≤ 50% cancer in each fragment/core, and PSA density < 0.15 ng/mL/g) patients were included in the low-risk group due to the small number of patients (n = 9) and for simplicity of group distribution.
Postoperative follow-up included measurement of the serum PSA level and physical examinations at 2- to 3-month intervals for the first year after surgery, 6-month intervals for the second year, and annually thereafter. BCR was defined as two consecutive PSA results > 0.2 ng/mL, and the first elevated time point was defined as the BCR point.
Because the median time interval was 100 days, the patients were stratified into two groups based on the time interval from biopsy to RP, < 100 days and ≥ 100 days. Prostate volume was calculated by multiplying height, width, and length measured on transrectal ultrasonography or MRI of prostate and π/6.
Statistical analysis
Univariable analysis of preoperative and pathologic characteristics was performed based on the time interval from biopsy to RP using Pearson's χ2 test for categorical variables and Student's t-test for continuous variables.
Adverse pathologic events such as positive surgical margin (PSM), pathologic upgrading, and upstaging were analyzed based on the time interval from biopsy to RP. Only very low-, low-, and intermediate-risk patients were analyzed; all patients had GS sum ≤ 7 and clinical stage ≤ T2. Pathologic upgrading was defined as a GS sum of RP specimen ≥ 7 when biopsy GS sum was ≤ 6 or GS sum of RP specimen greater than the biopsy GS sum when biopsy GS sum was 7. Pathologic upstaging was defined as a pathologic RP specimen stage ≥ T3.
The associations between time interval from biopsy to RP and adverse pathologic events in the RP specimen were evaluated with univariable analysis using χ2 tests and multivariable logistic regression analysis for each adverse event.
BCR-free survival rates in each group were analyzed using the Kaplan-Meier method and compared with the log-rank test. A Cox proportional hazards model was used after adjusting for preoperative features to estimate the hazard ratio (HR) and 95% confidence interval (CI) of BCR associated with the time interval from biopsy to RP. All statistical analyses were performed using IBM SPSS 18.0 (IBM Co., Armonk, NY, USA), and a P value < 0.05 was considered statistically significant.
RESULTS
Preoperative parameters and pathologic outcomes
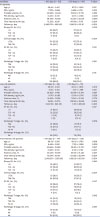
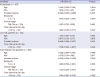
The preoperative and pathologic characteristics of patients are shown in Table 1. Because the median time from biopsy to RP was 100 days, the patients were classified into two groups based on this cutoff. Among the 427 men, 213 (50%) were treated < 100 days after biopsy (shorter time interval group) and 214 patients (50%) were treated > 100 days after biopsy (longer time interval group). Subgroup classification according to NCCN guidelines revealed 142 (33.3%) low-risk patients and 285 (66.7%) intermediate-risk patients. Men in the longer time interval group showed statistically significantly lower PSA level, lower PSA density, shorter follow-up duration, lower clinical stage, and lower pathologic T stage. Based on subgroup analysis, follow-up duration was significantly shorter in the longer time interval group for both low- and intermediate-risk groups. PSA level, PSA density, and clinical stage were significantly lower in the longer time interval group.
Table 1
Preoperative and pathologic characteristics of all patients, low-risk patients, and intermediate-risk patients
![]()
Univariable analysis results of adverse pathologic events are presented in Table 2. Statistical difference in adverse pathologic events was not observed based on time interval. However, pathologic upgrading was higher in the longer time interval group though the difference was not significant (38.8% vs. 30.0%; P = 0.057). In the subgroup analysis, a longer time interval from biopsy to RP was significantly associated with pathologic upgrading only in the low-risk group (P = 0.022).
Table 2
Adverse pathologic events in all patients, low-risk patients, and intermediate-risk patients

![]()
Based on multivariable logistic regression analysis, a longer time interval was significantly associated with pathologic upgrading (odds ratio [OR], 2.211; 95% CI, 1.342–3.645; P = 0.002) but not with PSM or pathologic upstaging (Table 3). PSA (OR, 1.110; 95% CI, 1.042–1.183; P = 0.001) and prostate volume (OR, 0.971; 95% CI, 0.955–0.988; P = 0.001) were associated with PSM. PSA (OR, 1.180; 95% CI, 1.096–1.270; P < 0.001), prostate volume (OR, 0.953; 95% CI, 0.931–0.976; P < 0.001), and preoperative biopsy GS (OR, 2.520; 95% CI, 1.515–4.190; P < 0.001) were associated with pathologic upstaging.
Table 3
Multivariable analysis of adverse pathologic events in all patients, low-risk patients, and intermediate-risk patients
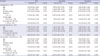
PSM = positive surgical margin, OR = odds ratio, CI = confidence interval, PSA = prostate-specific antigen, GS = Gleason score, RP = radical prostatectomy.
![]()
Based on multivariable subgroup analysis, significant association was observed between the time interval from biopsy to RP and pathologic upgrading in the low-risk group (OR, 2.420; 95% CI, 1.188–4.931; P = 0.015), and a longer time interval tended to increase the risk of pathologic upgrading in the intermediate-risk group (OR, 2.006; 95% CI, 0.982–4.096; P = 0.056).
Long-term BCR-free survival
Fig. 1 shows the Kaplan-Meier curves for BCR-free survival in all patients, and Fig. 2 shows the results for each PC risk group. Significant differences were not observed in BCR-free survival based on the time interval from biopsy to RP.
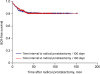 | Fig. 1Kaplan-Meier BCR-free survival of all patients (log-rank test, P = 0.988).BCR = biochemical recurrence.
|
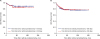 | Fig. 2Kaplan-Meier BCR-free survival by subgroup according to risk classification. (A) Kaplan-Meier BCR-free survival of low-risk patients (log-rank test, P = 0.549). (B) Kaplan-Meier BCR-free survival of intermediate-risk patients (log-rank test, P = 0.859).BCR = biochemical recurrence.
|
Based on multivariable Cox proportional hazard analysis, PSA level (HR, 1.073; 95% CI, 1.013–1.137; P = 0.017) and prostate volume (HR, 0.960; 95% CI, 0.939–0.982; P < 0.001) were significantly associated with BCR; however, a longer time interval was not associated with BCR (HR, 1.285; 95% CI, 0.795–2.077; P = 0.305) (Table 4). When subgroup analysis was performed, increased risk of BCR was not observed with a longer time interval in either group.
Table 4
Multivariable analysis of BCR for all patients, low-risk patients, and intermediate-risk patients
BCR = biochemical recurrence, HR = hazard ratio, CI = confidence interval, PSA = prostate-specific antigen, GS = Gleason score, RP = radical prostatectomy.
![]()
DISCUSSION
Generally, clinically localized PC is considered relatively slow in progression, and a certain time interval to treatment may not have a negative effect on long-term survival. Although many reports have been published on whether the delay of definite treatment is safe, the results are inconclusive.
Khan et al.15 analyzed data of 926 men who underwent RP performed by a single urologist. The authors reported that delays of up to several months did not influence long-term BCR rates. Joseph et al.17 analyzed 393 men with localized PC who were treated with radiation therapy or surgery. The authors reported that a delay in treatment ≥ 3 months did not appear to adversely affect BCR-free survival in patients who underwent definite therapy for clinically localized PC with low-risk features. In a recent study in the United States, although nearly 50% of men with low-risk PC experienced at least one adverse pathologic outcome at RP, delay of RP for up to 12 months did not change the risk of adverse pathology.18 Similar research in Sweden showed no difference between primary and deferred RP performed a median of 2.6 years after diagnosis in frequency of GS ≥ 6, extraprostatic extension, PSM, tumor volume on RP specimens, or BCR rats after a mean follow-up of 5.7 years.20
Conversely, negative results due to surgical delay in RP were reported in several studies. Nam et al.21 demonstrated that patients who underwent RP within 3 months of diagnosis experienced significantly higher 10-year BCR-free survival than those who underwent surgery ≥ 3 months after diagnosis (74.6% vs. 61.3%; P = 0.05). In addition, O'Brien et al.22 reported that a delay of RP > 6 months was associated with pathologic upgrading and BCR in D'Amico low-risk patients. In a recent study in Turkey, Eroglu et al.23 suggested that time interval from biopsy to RP is an important factor of pathologic upgrading in clinically T1c PC patients. The authors reported that the mean time to surgery was longer in the pathologic upgrading group (pathologic upgrading group, 52.2 ± 22.6 days; no pathologic upgrading group, 45.3 ± 15.5 days; P = 0.004).
The above-mentioned studies were conducted on Western men; studies on Asian men have not been performed. Reportedly, in several epidemiologic studies, PC aggressiveness was associated with racial and ethnic differences, and advanced-stage and high-grade PC presented more frequently in Asian than in Caucasian men.242526 Although, with the introduction of PSA screening in Korea, a GS 6 has become the most dominant histologic grade at diagnosis,27 the incidence of high-grade or advanced stage PC was higher in Korean men who had undergone RP than in Western men in several studies.2829
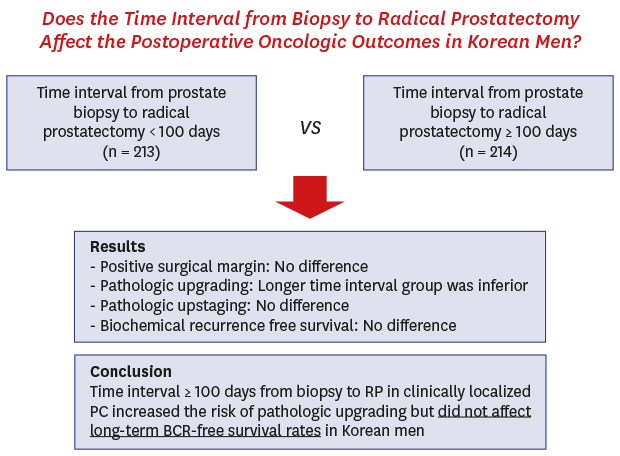
In the present study, the data of patients who underwent RP at our institution were retrospectively analyzed based on time interval from biopsy to RP and PC risk. Whether the time interval from biopsy to RP influences the pathologic outcomes and long-term BCR was investigated. To the best of our knowledge, whether the time interval from prostate biopsy to RP influences postoperative outcomes in Asian men was investigated for the first time in this study. Results showed that time interval from biopsy to RP > 100 days was associated with pathologic upgrading but did not affect BCR-free survival.
Pathologic GS upgrading has been found in 30% to 50% of RP specimens,1314 indicating either incorrect biopsy GS or worsened tumor grade between biopsy and surgery. In the present study, the pathologic upgrading rate was 34.4%, which was similar to the results in previous studies.
Based on multivariable analysis of time interval from biopsy to surgery, > 100 days significantly increased the risk of pathologic upgrading but not long-term BCR rates. We hypothesized that longer time interval from biopsy to surgery resulted in worsening of tumor grade and higher risk of pathologic upgrading. However, because time interval from biopsy to surgery did not affect other pathologic outcomes such as pathologic upstaging or PSM rate, pathologic upgrading alone did not appear to adversely affect long-term BCR rates.
The present study had several limitations. This was a retrospective study and was thus inherently limited. Because patients were treated by five different urologists, the surgical techniques and follow-up schedule may have differed slightly. However, all of the surgeons were expert urologists, and the follow-up schedule did not differ significantly. Next, the study cohort was not sufficiently large to fully ascertain the risk of delay in each risk group. Next, the follow-up period was significantly different between the two groups classified based on time interval from biopsy to RP, potentially because surgical delay was more common in recent years. However, several investigators demonstrated that the majority of BCR after RP occurs in the first few years; therefore, the impact of the time interval from biopsy to RP on BCR was likely not affected by differences in the follow-up period.30 Finally, patient stress when experiencing a relatively long interval time to surgery would not be low. The impacts of stress and anxiety were not investigated in this study, but this is a matter that medical staff should consider and that warrants future research.
In conclusion, an interval of ≥ 100 days from biopsy to surgery was associated with pathologic upgrading but did not affect long-term BCR-free survival rates in Korean men. Although this is a retrospective study, these findings may be used to allay patient anxiety when either patient or institutional factors result in a reasonably long time interval from biopsy to RP in localized PC. However, the precise relationship between interval from biopsy to RP and patient outcomes remains unclear, and shorter interval from biopsy to RP may prevent worsening in pathologic grade. If prospective randomized studies are performed including cancer-specific and overall mortality rates, the effect of longer interval from biopsy to RP will be more apparent.
 XML Download