

 PDF
PDF Citation
 Print
Print


INTRODUCTION
Ever since the low-pathogenic avian influenza (LPAI) virus was first reported in Korea in 1996, isolation of several subtypes of LPAI viruses originating from live-bird markets and backyard bird stalls has been reported [1]. The isolation of LPAI virus from migratory wild birds is also consistently reported [123]. The highly pathogenic avian influenza (HPAI) virus was first reported in 2003 at a layer farm in Korea [4]. Before 2018, HPAI outbreaks have occurred seven times, causing great economic losses in the poultry industry [156]. In 2006, HPAI virus was first detected in the feces of wild birds, and many studies were subsequently conducted to reveal the nature of the correlation between wild birds and HPAI virus outbreaks [567]. Indeed, wild birds may play a critical role in the introduction of the Avian influenza (AI) virus from foreign virus reservoirs through migration [8]. The Korea peninsula is situated within the East Asia-Australian flyway of migratory wild birds during the fall to winter seasons [91011]. Hence, Korea is likely exposed to an inflow of AI virus via wild birds.
In response to the economic damage inflicted by the HPAI virus, the Korean government implemented an annual nationwide surveillance program to monitor AI virus entering the country from early September to late February each year [13]. Accurate and early detection of the AI virus is critical for the implementation of rapid biosecurity and control measures in the event of an AI virus outbreak. Several different approaches for the detection of AI viruses are used in the surveillance program. Diagnostic techniques, including virus isolation (VI) by egg inoculation, conventional (c) reverse transcription polymerase chain reaction (RT-PCR), and real-time (r) RT-PCR, among others, have been used [12].
VI by egg inoculation is considered the gold standard method for the diagnosis of AI viruses. VI is essential for confirming the presence of viruses in a sample and can be used to further identify and characterize the properties of the virus. However, this technique is limited by the long time required to confirm the presence of the AI virus, the need for readily prepared eggs, and the highly labor-intensive nature of the method [1213]. Real-time RT-PCR is ideal for rapid, highly-sensitive, and relatively inexpensive screening of many specimens acquired during routine surveillance or outbreaks [14]. However, the utility of rRT-PCR is limited by the risk of cross-contamination and the relatively high investment cost. Conventional RT-PCR is the most commonly used method in diagnostic laboratories globally and is also considered as a gold standard for identifying influenza viruses. The results are obtained rapidly, following a simple process [12]. However, cRT-PCR involves agarose gel electrophoresis for PCR product detection and can yield false-positive results [1215]. Next generation sequencing (NGS) is being developed as a method that can overcome the limitations of some of the conventional detection methods. The NGS detection is a rapidly developing approach for an accurate identification of the influenza virus genome for the diagnosis and determination of virulence. Since NGS is used to directly analyze nucleic acids extracted from a sample, it offers great improvements in terms of sequencing speed and high-throughput [121617]. Despite of these advantages, the most common challenge is the complexity of NGS bioinformatics analysis and the amount of sequencing data generated [18].
In the current study, we aimed to compare different methods for the detection, isolation, and analysis of AI viruses acquired as part of the wild bird surveillance program in Korea. We surveyed wild bird habitats in Korea for the presence of AI virus in fecal samples from early September 2017 to late February 2018. AI viruses were detected using several methods generally used in surveillance programs, and further analyses of the isolated virus specimens were conducted. The current study would contribute to controlling of AI epidemics through accurate and rapid monitoring.
MATERIALS AND METHODS
Sample collection
From September 2017 to February 2018, a professional sampling team collected fresh fecal specimens from wild bird habitats that had been identified as wintering sites for migratory wild birds throughout Korea. Fecal samples were collected using sterilized conical tubes and chopsticks. The collected specimens were directly transported in refrigerated containers to the Avian Disease Laboratory, College of Veterinary Medicine, Chungbuk National University (Korea) within 24 h.
Conventional methods of viral diagnosis
Real-time RT-PCR
Each fecal specimen was diluted 10-fold in phosphate-buffered saline (1X) and the suspended fecal sample centrifuged at 2,063 × g for 15 min. Viral RNA was directly extracted from each supernatant using QIAamp viral RNA mini kit (Qiagen, USA), and rRT-PCR was performed using one-step rRT-PCR kit (Enzynomics, Korea), primers and probes listed in Table 1, as described previously [14]. Briefly, cDNA was synthesized at 50°C for 30 min. This was followed by a pre-denaturation step at 95°C for 15 min, 40 cycles of denaturation at 94°C for 10 sec and annealing at 55°C for 30 sec, and a final extension step at 72°C for 10 sec. The CT value was analyzed by CFX96 (Bio-Rad Laboratories, USA) and under 40 was considered to indicate a positive reaction (i.e., viral presence) [19].
Table 1
Primer sets used for AI virus identification and analysis
| Application | Target gene | Primer | Sequences* (5′–3′) | Reference |
|---|---|---|---|---|
| rRT-PCR | MA | M+25 | AGATGAGTCTTCTAACCGAGGTCG | [14] |
| M-124 | TGCAAAAACATCTTCAAGTCTCTG | |||
| M+64 | FAM-TCAGGCCCCCTCAAAGCCGA-TAMRA | |||
| AI identification | NP | NP1200 | CAG(A/G)TACTGGGC(A/T/C)ATAAG(A/G)AC | [21] |
| NP1529 | GCATTGTCTCCGAAGAAATAAG | |||
| MA | M52C | CTTCTAACCGAGGTCGAAACG | [22] | |
| M253R | AGGGCATTTTGGACAAAKCGTCTA | |||
| NGS preparation | cDNA | MBTuni-12 | ACGCGTGATCAGCAAAAGCAGG | [24] |
| MBTuni-13 | ACGCGTGATCAGTAGAAACAAGG | |||
| Subtyping | NA | N1-F | AGRCCTTGYTTCTGGGTTGA | [21] |
| N1-R | ACCGTCTGGCCAAGACCA | |||
| N2-F | GCATGGTCCAGYTCAAGYTG | |||
| N2-R | CCYTTCCAGTTGTCTCTGCA | |||
| N3-F | AGATCRGGCTTTGAARTCATCAAAGT | |||
| N3-R | CATTGTCTARTCCACAGAAAGTAACTATAC | |||
| N4-F | TGGATAAGATTCAACAGTGA | |||
| N4-R | GGTATCAGAATTAACACCACA | |||
| N5-F | GTTATTGGGTAATGACRGAYGGTC | |||
| N5-R | GGTCTATTCATTCCATTCCAA | |||
| N6-F | GCIACAGGAATGACACTATC | |||
| N6-R | GRATGTGCCATGARTTTA C | |||
| N7-F | GTYGACAAYAACAATTGGTCAGG | |||
| N7-R | CCCAACTGRGAITGGGCT | |||
| N8-F | GGTCAGGATAYAGYGGTTCYTTCAC | |||
| N8-R | CCACACATCACAATGGAGCT | |||
| N9-F | AACACIGACTGGAGTGGYTAC | |||
| N9-R | GGAATTCTGTRCTGGAACAC | |||
| HA | H1-550F | AACAAYAARGRGAAAGAAGT | [23] | |
| H1-1016R | GGGACDTTYCTTARTCCTGT | |||
| H2-422F | GAGAAARTWAAGATTCTGCC | |||
| H2-1083R | CCAAACAAYCCYCTTGAYTC | |||
| H3-175F | CARATTGARGTGACHAATGC | |||
| H3-896R | GGTGCATCTGAYCTCATTA | |||
| H4-8F | GCAGGGGAAACAATGCTATC | |||
| H4-777R | CCWGGYTCTACAATWGTCC | |||
| H5-155F | ACACATGCYCARGACATACT | |||
| H5-699R | CTYTGRTTYAGTGTTGATGT | |||
| H6-661F | AGCATGAATTTTGCCAAGAG | |||
| H6-962R | GGRCATTCTCCTATCCACAG | |||
| H7-12F | GGGATACAAAATGAAYACTC | |||
| H7-645R | CCATABARYYTRGTCTGYTC | |||
| H8-166F | GTGGAAACAGAGAAACAT | |||
| H8-597R | CCATAAGAARATGATGTCT | |||
| H9-151F | CTYCACACAGARCACAATGG | |||
| H9-638R | GTCACACTTGTTGTTGTRTC | |||
| H10-521F | GGACAAAAYTTCCCTCAGAC | |||
| H10-932R | GRAAAGGGAGCTTTGTATTT | |||
| H11-240F | TGYTCMTTTGCTGGRTGGAT | |||
| H11-689R | CTCTGAACCCACTGCTACAT | |||
| H12-11F | AGGGGTCACAATGGAAAAA | |||
| H12-431R | GGTGAAATCAAACATCTTCA | |||
| H13-203F | CCACACAGGAACATAYTGTTC | |||
| H13-433R | CTACTGAAWGAYCTGATTCC | |||
| H14-444F | TCATCGCCGAACAATTCACC | |||
| H14-986R | GCAGTTTCCTATAGCAATCC | |||
| H15-455F | GTGCGTGTAAGAGAACAGTG | |||
| H15-837R | ATTAGAGCGGAGAAAGGTGG | |||
| H12-11F | AGGGGTCACAATGGAAAAA | |||
| H12-431R | GGTGAAATCAAACATCTTCA | |||
| H13-203F | CCACACAGGAACATAYTGTTC | |||
| H13-433R | CTACTGAAWGAYCTGATTCC | |||
| H14-444F | TCATCGCCGAACAATTCACC | |||
| H14-986R | GCAGTTTCCTATAGCAATCC | |||
| H15-455F | GTGCGTGTAAGAGAACAGTG | |||
| H15-837R | ATTAGAGCGGAGAAAGGTGG |
VI and virus identification
The supernatant from each fecal sample was used to inoculate 9- to 11-day-old embryonated chicken eggs (BioPOA, Korea). The allantoic fluid was harvested after a 5-day incubation and clarified by spin down. If AI virus was not isolated after the first egg passage, the allantoic fluid was passaged one more time in 9- to 11-day-old embryonated chicken eggs [20]. Virus presence in the allantoic fluid was determined by a hemagglutination assay and cRT-PCR. The hemagglutination assay was performed as described previously [20]. Viral RNA was extracted from 150 μL of the allantoic fluid using a QIAamp viral RNA mini kit (Qiagen) according to the manufacturer's protocol. One-step RT-PCR was then performed (Intron, Korea), using the extracted RNA as a template, to detect the presence of the matrix protein (MA) and nucleoprotein (NP) (Table 1) [2122]. Positive bands of both MA and NP genes indicate VI positive. Briefly, cDNA synthesis was performed at 42°C for 30 min. This was followed by pre-denaturation at 94°C for 5 min; 35 cycles of denaturation at 94°C for 30 sec, annealing at 51°C for 30 sec, and extension at 72°C for 30 sec; and an additional extension step at 72°C for 5 min.
AI virus subtyping by cRT-PCR
For virus subtyping, one-step RT-PCR was performed using gene-specific primer sets (Table 1). Briefly, to confirm the hemagglutinin (HA) subtype, cDNA was synthesized at 42°C for 45 min; followed by incubation at 95°C for 3 min; 35 cycles of incubation at 95°C for 30 sec, annealing at 55°C for 40 sec, and extension at 72°C for 40 sec; with a final extension at 72°C for 10 min [23]. To determine the neuraminidase (NA) subtype, cDNA synthesis was performed at 50°C for 30 min. This was followed by a pre-denaturation at 95°C for 2 min; five touch-down PCR cycles starting at 94°C for 15 sec, then 60°C (decrement of 1°C per cycle) for 30 sec, and 68°C for 1 min; 30 cycles of incubation at 94°C for 15 sec, 54°C for 15 sec, and 68°C for 1 min; and an extension at 68°C for 5 min [21].
NGS by Illumina MiSeq platform of the AI virus genome
Nucleic acid extraction and sample preparation for Illumina sequencing
Viral RNA was extracted from the virus isolated in the allantoic fluid using QIAamp viral RNA mini kit (Qiagen) according to the manufacturer's recommendations. To amplify eight segments of the AI virus genome, one-step RT-PCR was performed using primers MBTuni-12 and MBTuni-13 [24]. Briefly, cDNA synthesis was performed at 72°C for 5 min, followed by 2 min on ice, and incubation at 30°C for 1 h and 72°C for 10 min. Pre-denaturation was then performed at 98°C for 30 sec, followed by 25 cycles of denaturation at 98°C for 30 sec, annealing at 65°C for 30 sec, and extension at 72°C for 7 min 30 sec. This was followed by an additional extension step at 72°C for 7 min. To verify whether the amplified PCR products were the reverse-transcribed eight viral RNA segments, the PCR products were resolved by 1.2% agarose gel electrophoresis and visualized using the Gel Doc system (Bio-Rad Laboratories). The PCR products were then purified using a QIAquick PCR purification kit (Qiagen). The concentration of purified RNA was quantified using Qubit 3.0 fluorometer (Invitrogen, USA).
DNA library preparation
The DNA library was prepared using the Nextera XT DNA Library Prep kit (Illumina, USA) which contains Nextera transposome and Illumina adapters. All the PCR products were subjected to tagmentation, enzymatically cleaved to DNA fragments approximately 300 base-pairs (bp) in length by using the Nextera transposome and tagged using Illumina adapters. After tagmentation, the DNA fragments were amplified by a secondary PCR for indexing and barcoding, using a combination of index 1 adapters (i7) and index 2 adapter (i5). PCR was performed at 72°C for 3 min, and 95°C for 30 sec, followed by 12 cycles of denaturation at 95°C for 10 sec, annealing at 55°C for 30 sec, and extension at 72°C for 30 sec. This was followed by an additional extension step at 72°C for 5 min. After the indexing, the PCR products were purified using the Agencourt AMPure XP beads (Beckman Coulter Inc., USA) and each library was normalized using the Nextera XT library normalization beads. The libraries were then loaded onto a cartridge and sequenced using a MiniSeq system (Illumina) [252627].
NGS data analysis
The depth of coverage (DOC) was calculated by using the read length, number of reads, and theoretical genome length. The breadth of sequence coverage (BOC) was calculated as a sequence percentage of the actual tested contig length divided by the theoretical genome length [16]. The average length of the AI virus genome is 13,588 bp. The representative lengths of the eight gene segments of the AI virus [A/Puerto Rico/8/1934(H1N1)] are as follows: 2,341 bp segment encoding polymerase basic protein 2 (PB2); 2,341 bp segment for polymerase basic protein 1 (PB1); 2,233 bp segment for polymerase acidic protein (PA); 1,778 bp segment for HA; 1,565 bp segment for NP; 1,413 bp segment for NA; 1,027 bp segment for MA; and 890 bp segment for nonstructural protein (NS) [1619].
RESULTS
Determination of viral presence by rRT-PCR
Of 11,145 fecal samples analyzed, 124 samples contained the MA gene, as determined by rRT-PCR. Of the 124 rRT-PCR positive samples, only 26 samples were identified as VI positive (Table 2).
Table 2
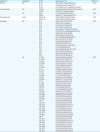
AI virus identification, isolation, and subtyping using different methods*
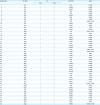
AI, avian influenza; rRT-PCR, real-time reverse transcription-polymerase chain reaction; VI, virus isolation; CE, chicken embryo; cRT-PCR, conventional reverse transcription-polymerase chain reaction; NGS, next generation sequencing.
*A rRT-PCR CT value below 40 indicates a positive reaction (Pos) and negative reaction (Neg); Question marks denote uncertainty of identification; Specimen No. 9 contained H1 (1,776 bp, 38,994 reads) and H7 (1,663 bp, 336 reads); No. 14 contained H1 (1,554 bp, 40,047 reads) and H7 (1,345 bp, 498 reads); No. 23 contained H1 (1,777 bp, 34,024 reads) and H7 (1,729 bp, 376 reads); and No. 24 contained H1 (1,784 bp, 24,110 reads) and H7 (1,728 bp, 234 reads).
AI virus isolation by egg inoculation
Fifty AI viruses were isolated by VI from 11,145 fresh fecal samples. The overall prevalence of AI viruses was 0.45%. Of the 50 isolates, 38 AI viruses were isolated after the first egg passage and 12 AI viruses were isolated after the second egg passage (Table 2).
Comparison of the cRT-PCR and NGS methods for AI virus subtyping
The 50 isolated AI viruses were next subtyped by using cRT-PCR and NGS. The results of NGS subtyping mostly coincided with the results of cRT-PCR (Table 2). However, 11 HA and four NA subtypes confirmed by NGS were not identified by cRT-PCR. All subtypes of the viruses tested, except for one NA subtype, were identified by NGS (Table 3). Further, six cases of co-infection with multiple influenza viruses were identified by NGS: four AI viruses were mixed HA subtypes (H1 and H7), and two AI viruses were mixed N2 and N8 subtypes (Table 2). In total, 17 HA/NA subtype combinations were detected by NGS. The most frequently detected HA and NA subtype combination was H1N1, followed by H3N8. H10 viruses matched only with N5 viruses, and N7 viruses matched only with H2 viruses (Table 2). As a result, NGS can analyze the parts that could not be confirmed by the conventional method and its superiority has been proved.
Table 3
Match rate of the subtyping results obtained by cRT-PCR and NGS*
Detailed AI virus evaluation by NGS
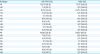
Overall, 13.2 million sequence reads representing a total length of 0.6 million bp were obtained from the 50 processed viral specimens. The average DOC and BOC values of contigs detected by NGS are shown in Table 4. Average BOC in NGS of each segment was PB2 84.6%, PB1 88.1%, PA 83.8%, HA 96.3%, NP 95.0%, NA 94.0%, MA 94.2% and NS 95.9%. The maximum average DOC was observed for the MA gene and the minimum average DOC was observed for the PB1 gene. MA was the most frequently detected gene segment (Table 4). Sequence data of HA and NA described in supplementary data (Supplementary Tables 1 and 2)
Table 4
The average value of BOC and DOC for NGS characterization of the influenza genome*

BOC, breadth of sequence coverage; DOC, depth of coverage; NGS, next generation sequencing.
*The BOC was calculated as sequence percentage of actual testing contig length divided by the theoretical genome length; The DOC was the BOC multiplied by the read counts; a the numbers denotes the representative lengths of each segments from AI virus (A/Puerto Rico/8/1934[H1N1]).
DISCUSSION
In the current study, we set out to compare the commonly used methods for AI virus detection and typing, in an effort to improve AI virus surveillance in Korea. We show that NGS is more sensitive and accurate than conventional methods.
The AI prevalence rate by VI in September 2017 to April 2018 was 0.45%. This prevalence rate is relatively higher compared with previous study conducted in Korea between January 2014 and March in 2016 (0.32%) [3]. The difference probably stems from the study design: the previous studies involved sampling from a wide range of wild bird habitats in Korea. Current study involved intensive sampling of pre-defined areas in which AI virus isolation described [23].
Herein, we confirmed that the rRT-PCR approach is highly specific and sensitive for the analysis of bird samples, as described previously [14]. However, only 52.0% of 50 VI positive samples were also positive by rRT-PCR in the current study, and similar observations were reported earlier. Lewis et al. [28] reported an overall recovery rate of 33.5% (332/992) and VI failure rate of 66.5%. In another study, 3 wild duck and 4 swine swab specimens tested positive for the AI virus by rRT-PCR but tested negative by cRT-PCR and VI [19]. There are several possible reasons for the discrepancy between the outcomes of rRT-PCR and VI analyses of wild bird fecal samples. First, molecular assays, such as rRT-PCR, detect and quantify the viral RNA or DNA of living and dead pathogens [29]. Therefore, while the viral nucleic acid is detected in a sample, the result does not guarantee the presence of live virus. Second, rRT-PCR is prone to non-specific amplification during testing of wildlife-originating specimen [1928]. Because wildlife samples, such as fecal samples, contain many microorganisms [30], primer and probe sequence mismatches may occur during rRT-PCR [19]. Third, because of virus evolution, some primers might not be suitable for the analysis of isolates from some regions [20]. Despite these disadvantages, rRT-PCR is used as a frontline screening assay because it allows rapid analysis of numerous samples, enabling early quarantine, if needed. To overcome these shortcomings, simultaneous detection by VI is required to confirm the initial diagnosis and provide additional information about the virus.
In the current study, 50 AI virus specimens were isolated from 11,145 fecal samples. Approximately three-quarters (38/50) of these AI virus specimens were isolated after the first egg passage, and the rest (12/50) were isolated after the second egg passage. Hence, a considerable fraction of viruses would be undetected if only one egg passage is performed. However, since the second passage requires time and extensive labor [13], the time, resources, and priority of the experiment should be considered before the actual implementation of the second passage.
In this study, we used two methods to confirm the subtype of isolated AI viruses: Of the 50 viruses analyzed, 6 mixed subtypes, 11 HA and 4 NA were not identified using cRT-PCR, while all subtypes except for one NA subtype representative were confirmed by NGS. Common molecular assays, such as cRT-PCR, are not 100% reliable when viruses, such as the AI virus, characterized by frequent genetic variation, are analyzed. These molecular assays may be unable to detect target site variants or emerging novel viruses [31]. In contrast, NGS can be used to detect and analyze emerging viral disease with a high genetic variation, such as AI, because it can analyze a full sequence rather than targeting a specific gene [1218]. Therefore, to minimize misdiagnosis of AI viruses, it would be helpful to use virus-specific primers for PCR [15] or NGS instead of PCR as in the current study.
In addition, 12% of all AI virus isolates were confirmed as mixed-type viruses. Four AI viruses (specimens No. 9, 14, 23, and 24) were mixed HA subtypes, all of which consisted of H1 and H7 (Table 2). In each sample, H7 occupied a relatively small proportion of read counts compared with H1, which may explain why H7 was not detected by cRT-PCR in these samples. Further, two AI viruses were an N2/N8 mix. Co-infection of wild birds with various AI virus subtypes has been reported by many studies [23233]. Co-infection of wild birds with AI viruses appears to occur naturally and is considered an important mechanism for the genetic reassortment of the AI virus [343536]. These genetic variations lead to changes in several viral characteristics, such as pathogenicity, transmissibility, and drug resistance [3]. Therefore, detecting mixed infections is very important and should be done as early as possible. To identify mixed infections, it is essential that methods identifying gene fragments directly from a sample, such as NGS are used [1632].
In the current study, the minimum contig length of 500 bp was used as a criterion for the analysis of the AI virus genome segments by NGS. Although a minimum contig length of 200 bp can be used for AI virus identification by NGS [16], short contigs are also thought to represent influenza virus particles that fail to assemble the full sequence. In the present study, the average BOC of each genome segment was at least 83.8% (Table 4). Similar to BOC, the average DOC was highest for the MA and NS genes. The minimum average DOC was observed for the PB1 gene. These findings are in agreement with those of other studies [1617]. The specific frequency of detection could be dependent on the length of each segment. Additional studies are needed to reveal the relationship between the virus sequence length, and the BOC and DOC during NGS analysis.
If directly analyzing wild specimens with NGS, there are many problems to be overcome such as contamination of host genome [37], existence of many microorganism [1938] and determination of the presence of pathogen at an analytical concentration in the specimens [16]. Because of the above reasons and high cost of applying NGS depending on the number of samples, in this study analyzed already isolated AI virus specimens by NGS as a means of confirming the results of other analytical methods. Studies have been conducted to apply NGS directly to some wild samples [1619] and further studies should be conducted to verify feasibility of NGS for use in the AI virus surveillance system by directly analyzing wild bird fecal samples.
In the current study, we demonstrated the application of conventional methods for the diagnosis and identification of the AI virus in wild bird samples, and the applicability of NGS for the analysis of chicken embryo allantoic fluid specimens. When wild bird specimens are analyzed using classical methods, the methods may fail to detect the AI virus because of their variable sensitivity and specificity. The limitation of each method can lead to misdiagnosis and increase the risk of outbreaks when monitoring viruses introduced to Korea by wild birds. Therefore, to prevent the occurrence of AI outbreaks, several methods should be used together to cross-check the obtained results, and further study on introduction and application of new diagnostic methods such as NGS is required to AI monitoring system.
 XML Download