

 PDF
PDF ePub
ePub Citation
 Print
Print


INTRODUCTION
Cough is a physiological reflex to protect the airways, but it can cause a significant morbidity when it is dysregulated.1 Cough is also one of the most common symptoms that prompts a medical consultation in many countries.23 Persistent or chronic cough is prevalent in general adult populations and can seriously impair quality of life, as it includes physical, psychological, and social consequences.45
The identification and treatment of the causes (or treatable traits) of cough is the mainstay of current management pathways.6789 Airway eosinophilic inflammation is one of the major treatable traits in subacute or chronic cough, which is commonly labeled as cough variant asthma or eosinophilic bronchitis.1011 However, diagnostic tests for these conditions, such as bronchial challenge or induced sputum tests, are technically demanding1213 and mostly restricted to specialist clinics. Thus, inhaled corticosteroids (ICSs) are often considered an empirical therapy for cough.14 However, ICS responsiveness is difficult to interpret for cough patients in routine clinical practice, as the improvements can include placebo effects or period effects (or self-remission).
A Cochrane review published in the Cochrane Library 2013 assessed the effects of ICSs for subacute and chronic coughs in randomized controlled trials (RCTs) of adult patients.15 Here, we re-appraised the literature with up-to-date evidence with a focus on the magnitude of placebo treatment effects. To our knowledge, placebo effects have not been reviewed in RCTs of ICSs in cough. In this systematic review, we examined therapeutic gains of ICS over placebo treatment and also estimated placebo treatment effects in adult patients with cough.
MATERIALS AND METHODS
Literature search
We conducted a systematic search for the following 2 research questions (RQs):
• RQ1. What is the therapeutic gain from ICSs (vs. placebo) in adult patients with cough?
• RQ2. What is the magnitude of the placebo effects in ICS trials of adult patients with cough?
We hypothesized that patient factors (cough duration or respiratory comorbidity) and intervention factors (inhaler) may make a difference in treatment effects, and thus planned subgroup analyses for these parameters. We applied definitions of acute, subacute, and chronic coughs based on a cutoff duration of 3 and 8 weeks, as recommended by international guidelines.616
PubMed, Embase, and Cochrane library databases were systematically searched according to the recommendations of the Preferred Reporting Items for Systematic Reviews and Meta-Analyses (PRISMA) statement.17 Our search strategy is summarized in Supplementary Table S1 in the online repository. Briefly, it included terms for cough and ICSs using the highly sensitive search strategy filter for RCTs suggested by the Cochrane group.18 Articles or conference abstracts published in peer-reviewed journals up to June 2018 were searched without language restriction. Additional manual searches were performed using Google Scholar, ClinicalTrials.gov, and all cross-referenced articles. The inclusion criteria were as follows: 1) Adult patients with cough as the chief complaint, regardless of their underlying conditions; 2) ICS intervention; 3) A matched placebo control; 4) Cough outcome reporting (before and after treatment); and 5) A randomized double-blind study design. Studies were excluded if the population was restricted to children or standard deviations (SDs) for cough outcomes could not be obtained. Given possible carry-over effects by ICS treatment, cross-over trials were also excluded if they did not report the first period results. The study protocol was registered as PROSPERO CRD42018100136.
Data extraction
Two independent researchers extracted the following parameters from the articles included: first author, journal, publication year, study design, clinical setting, sample size, patient selection criteria, patient characteristics, ICS treatment (dose and device), placebo treatment (device), treatment duration, and cough outcomes (before and after treatment). If these parameters were not described in the reports, but were considered potentially available from the original datasets, the corresponding authors were e-mailed to request this information. Therapeutic gain was calculated by subtracting the percentage change from baseline in the cough score in the ICS treatment group from that in the placebo treatment group.
Statistical analysis
Random effects meta-analysis was planned as the primary analysis, considering the potential methodological and clinical heterogeneity across the studies included. As time is a potential determinant for placebo treatment effects, the outcomes measured at similar time points (such as 2 or 4 weeks) were selected for primary analyses. Meta-analyses were conducted for the outcomes of similar domains (such as cough severity or frequency). Mean differences with a 95% confidence interval (CI) were calculated if results were measured using uniform scales. If this was not the case, a standardized mean difference (SMD) with a 95% CI was estimated for pooled effects. The effect size of the SMD was interpreted in accordance with Cohen's rule: small, SMD = 0.2; moderate, SMD = 0.5; and large, SMD = 0.8.21 Heterogeneity was first assessed by visual inspection of forest plots, but was also tested using I2 statistics. An I2 value greater than 50% was considered significant. All statistical analyses were performed using RevMan software, version 5.3 (Cochrane Collaboration, Oxford, UK).
RESULTS
Characteristics of the studies included
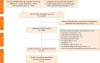
The PRISMA flow chart for the literature selection is presented in Fig. 1. A total of 9 RCTs222324252627282930 met the eligibility criteria. The study by Price et al.27 was included with a data subset for subjects with cough. The cross-over study by Chaudhuri et al.31 reported no significant carryover effects, but was not included because the first period results were not separately reported. Two other studies did not provide SDs for the changes in cough scores,3233 and thus were not included. A search of ClinicalTrials.gov identified 1 unpublished RCT (Identifier: NCT02715167).
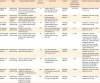
The baseline characteristics of the 9 studies included are summarized in Table 1. All were RCTs primarily conducted on adult patients with cough as the chief complaint, regardless of their underlying conditions. Based on the cough duration of the study participants (Table 1), 3252629 were classified as studies of acute or subacute cough, and 6222324272830 as analyses of chronic cough. High-dose ICSs were administered in 4 studies,22262829 and a medium-dose ICSs in 5 studies.2324252730 The treatment durations ranged from 11 days to 12 weeks. The degree of cough was subjectively assessed using a symptom diary or visual analogue scale (VAS) score in all studies included. However, an objective cough frequency was measured in only 1 study of acute cough (for cough epochs).29 None of the studies included measured cough-specific quality of life.
Table 1
Baseline characteristics of the 9 studies included
| Study (yr) | Design | Cough condition (duration) | No. of participants | Intervention | Control | Treatment duration (time point of outcome measurement) | Cough outcomes (score range) |
|---|---|---|---|---|---|---|---|
| Engel et al. (1989)30 | Randomized double-blind | Chronic bronchitis (cough and expectoration for at least 3 mon a year during at least the preceding 2 yr) | 18 | Medium-dose ICS (budesonide 400 mcg bid), MDI with spacer | Matching placebo | 4, 8, 12 wk | • Subjective outcomes: cough score (0–3) |
| Boulet et al. (1994)22 | Randomized double-blind (crossover design) | Non-asthmatic persistent cough (> 4 wk; all subjects had cough for longer than 8 wk); mean cough duration of 3 yr | 14 | High-dose ICS beclomethasone dipropionate 500 mcg qid), MDI with spacer | Matching placebo | 4 wk | • Subjective outcomes: cough score (0–10) |
| Pizzichini et al. (1999)23 | Randomized double-blind | Non-asthmatic chronic cough (> 1 yr); mean cough duration of 10.8 yr | 44 | Medium-dose ICS (budesonide 400 mcg bid), turbuhaler DPI | Matching placebo | 2 wk | • Subjective outcomes: cough severity VAS (0–100) |
| Ponsioen et al. (2005)26 | Randomized double-blind | Cough of ≥ 2 wk; 90% of subjects had acute or subacute cough | 133 | High-dose ICS (fluticasone propionate 500 mcg bid), MDI with spacer | Matching placebo | 2 wk | • Subjective outcomes: cough diary score (0–6) |
| Pornsuriyasak et al. (2005)25 | Randomized double-blind | Post-infectious cough (>3 wk); 95% of subjects had subacute cough; mean cough duration of 5.3 wk | 30 | Medium-dose ICS (budesonide 400 mcg bid), DPI | Matching placebo | 2, 4 wk | • Subjective outcomes: symptom score (1–20: the sum of 6 scores including cough frequency, cough bout frequency, cough associated symptom, nigh-time cough, frequency of cough medications, and number of cough medications) |
| Gillissen et al. (2007)29 | Randomized double-blind | Post-infectious cough (3–14 days following acute RTI) | 72 | High-dose ICS (HFA-budesonide dipropionate 400 mcg bid), MDI | Matching placebo | 11 days | • Subjective outcomes: cough intensity VAS (0–100) |
| • Objective outcomes: cough epochs objectively measured by Tussometry | |||||||
| Ribeiro et al. (2007)28 | Randomized double-blind | Chronic cough (> 8 wk); mean cough duration of 20 wk | 64 | High-dose ICS (CFC-beclomethasone 1500 mcg/day), MDI | Matching placebo | 2 wk | • Subjective outcomes: cough diary score (0–4) for 1) cough frequency, 2) cough severity, 3) duration of coughing, 4) sleep interruption and 5) Cough severity VAS (0–100) |
| Rytila et al. (2008)24 | Randomized double-blind | Cough with additional respiratory symptoms (> 2 mo); mean cough duration not reported | 140 | Medium-dose ICS (mometasone furoate 400 mcg), DPI | Matching placebo | 4, 8 wk | • Subjective outcomes: cough diary score (0–3) |
| Price et al. (2018)27 | Randomized double-blind | Chronic non-specific persistent respiratory symptoms (> 6 wk); a subgroup with cough | 235 | Medium-dose ICS (QVAR 80 mcg 2 puff bid), MDI | Matching placebo | 4 wk | • Subjective outcomes: cough severity VAS (0–100) |
RTA, respiratory tract infection; ICS, inhaled corticosteroids; MDI, metered dose inhaler; DPI, dry powder inhaler; VAS, visual analogue scale; HFA, hydrofluoroalkane; CFC, chlorofluorocarbon.
![]()
The participant selection criteria in each study are summarized in Supplementary Table S2. A normal chest X-ray result was required for enrollment in 6 studies, whereas the remaining 3 studies262729 excluded lung parenchymal diseases using medical history only. Three studies utilized methacholine or histamine challenge tests to assess airway hyperresponsiveness (AHR),22232530 whereas the others checked bronchodilator responses or medical history for screening asthma. Recent corticosteroid exposure history was controlled in 8 studies.2223252627282930 Markers for airway eosinophilic inflammation were assessed in 4 studies using the following samples or tests: bronchoalveolar lavage,22 induced sputum,2324 and fractional exhaled nitric oxide (FeNO) (Supplementary Table S3).27
Use of concomitant medications (or no allowance) was described in 6 studies (Supplementary Table S4). Five recent RCTs2426272829 did not allow any medications related to the chief complaint; however, 1 study25 allowed the use of mucolytics, β2-agonists, or cough suppressants, and measured the frequency of these medications as an outcome.
Risk of bias assessment
Risk of bias assessments is presented in Supplementary Figure. Details of the randomization and allocation concealment procedures were not provided in 4 studies.22252930 The risk of reporting bias was unclear in 6 studies (either insufficient information on the number of patients assessed for eligibility or insufficient detail in outcome reporting).232425262829 Statistical analyses for publication bias, such as funnel plot asymmetry, were not performed as the number of studies included in the meta-analysis was less than 10.20
RQ1. ICS therapeutic gain over a placebo effect in patients with cough
Of the 9 RCTs included in our present review, only 3 studies262728 reported a significant benefit from ICSs over placebo in cough outcomes. Therapeutic gains from ICS treatments (calculated by subtracting the percentage change from the baseline cough score in the ICS treatment group from that in the placebo treatment group; a positive score indicating a benefit from ICSs) ranged from −5.0% to +13.2% in studies of acute29 or subacute cough, 2526 and ranged from −19.0% to +94.6% in 6 studies of chronic cough2223242728 (Table 2). The extreme range was due to the very high therapeutic gain reported in 1 study28 (+45.6% to +94.6%, depending on outcomes). The outlier28 was also identified in a scatter plot analysis (Fig. 2); in Spearman's tests, ICS treatment effects (relative change in cough severity score from baseline) showed a significant correlation with those of placebo (r = 0.833, P = 0.005). The overall therapeutic gain from ICS was less than +22%, except for the single study.28
Table 2
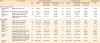
Summary of cough severity and frequency outcome changes before and after placebo and ICS treatment in the 9 studies included
| Study | Outcome (scale) | Placebo treatment group | ICS treatment group | Therapeutic gain | |||||||
|---|---|---|---|---|---|---|---|---|---|---|---|
| No. (%) | Baseline score | Absolute change from baseline (mean ± SD) | Relative change from baseline (A, %) | No. (%) | Baseline score | Absolute change from baseline (mean ± SD) | Relative change from baseline (B, %) | (A-B) | |||
| Acute or subacute cough | |||||||||||
| Ponsioen et al. (2005)26 | Cough diary score (0–6) | 68 | 3.8 ± 1.0 | −1.9 ± 0.72 | −50.0% | 65 | 3.8 ± 1.0 | −2.4 ± 1.16 | −63.2% | +13.2% | |
| Pornsuriyasak et al. (2005)25 | Symptom score (1–20) (at 2 wk)†,‡ | 15 | 9.8 ± 2.4 | −5.53 ± 2.38 | −56.4% | 15 | 9.4 ± 5.0 | −5.47 ± 3.68 | −58.2% | +1.8% | |
| Symptom score (1–20) (at 4 wk)† | 15 | 9.8 ± 2.4 | −7.14 ± 2.12 | −72.9% | 15 | 9.4 ± 5.0 | −7.14 ± 3.73 | −76.0% | +3.1% | ||
| Gillissen et al. (2007)29 | Cough intensity VAS (0–100) | 38 | 66* | −45.1* | −68.3% | 32 | 68.6* | −43.4* | −63.3% | −5.0% | |
| Objective frequency of daytime cough epochs | 26.4 ± 15.8 | −13.1 ± 11.7 | −49.6% | 28.1 ± 16.2 | −15.4 ± 12.0 | −54.8% | +5.2% | ||||
| Chronic cough | |||||||||||
| Engel et al. (1989)30 | Cough score (0–3) (at 4 wk)‡ | 10 | 1.79 ± 0.76 | −0.16 ± 0.54 | −8.9% | 8 | 1.48 ± 0.41 | 0.15 ± 0.67 | 10.1% | −19.0% | |
| Cough score (0–3) (at 12 wk) | 10 | 1.79 ± 0.76 | −0.43 ± 0.55 | −24.0% | 8 | 1.48 ± 0.41 | −0.46 ± 0.37 | −31.1% | +7.1% | ||
| Boulet et al. (1994)22 | Daily cough score (0–10) | 7 | 1.91 ± 0.9 | −0.24 ± 0.88 | −12.6% | 7 | 3.35 ± 2.28 | −1.15 ± 1.56 | −34.3% | +21.7% | |
| Pizzichini et al. (1999)23 | Cough severity VAS (0–100) | 23 | 51 ± 24.6 | −3.7 ± 12.1 | −7.3% | 23 | 61.4 ± 24.0 | −7.7 ± 23.7 | −12.5% | +5.2% | |
| Ribeiro et al. (2007)28 | Cough severity diary score (0–4) | 20 | 1.5 ± 0.7 | −0.6 ± 0.5 | −40.0% | 44 | 1.39 ± 0.7 | −1.19 ± 0.52 | −85.6% | +45.6% | |
| Cough frequency diary score (0–4) | 2.1 ± 0.85 | −0.77 ± 0.74 | −36.7% | 1.98 ± 1.07 | −1.71 ± 0.79 | −86.4% | +49.7% | ||||
| Cough severity VAS (0–100) | 93* | −2* | −2.2% | 94* | −91* | −96.8% | +94.6% | ||||
| Rytila et al. (2008)24 | Cough diary score for morning and evening (combined; 0–3) (at 4 wk)‡ | 60 | 1.39 ± 0.46 | −0.29 ± 0.58 | −20.9% | 61 | 1.42 ± 0.47 | −0.46 ± 0.58 | −32.4% | +11.5% | |
| Cough diary score for morning and evening (combined; 0–3) (at 8 wk) | 60 | 1.39 ± 0.46 | −0.55 ± 0.77 | −39.5% | 61 | 1.42 ± 0.47 | −0.58 ± 0.70 | −40.8% | +1.3% | ||
| Price et al. (2018)27 | Cough severity VAS (0–100) | 112 | 42.52 ± 25.5 | −11.06 ± 21.05 | −26.0% | 123 | 45.09 ± 28.42 | −19.96 ± 20.89 | −44.3% | +18.3% | |
SD, standard deviation; ICS, inhaled corticosteroids; VAS, visual analogue scale.
*No information on SD; †The sum of 6 scores including cough frequency, cough bout frequency, cough associated symptom, nigh-time cough, frequency of cough medications, and number of cough medications; ‡Selected for the primary meta-analysis.
![]()
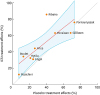 | Fig. 2Scatter plot of ICS and placebo treatment effects (relative change from baseline) in cough severity outcomes at final endpoints. Red solid line indicates linear prediction. Blue shadow represents a 95% confidence interval of the prediction.ICS, inhaled corticosteroids.
|
Random effects meta-analyses were performed for subjective cough severity scores (symptom diary or VAS), and were reported in 8 RCTs.2223242526272830 One RCT of acute cough patients29 was not included here, because it did not report SDs. Overall, the ICS treatment effects were found to be small-to-moderate (SMD, −0.38 [95% CI, −0.54, −0.23]; I2
= 46%). However, these effects were comparable between subacute (SMD, −0.42 [95% CI, −0.73, −0.10]; I2
= 39%) and chronic coughs (SMD, −0.37 [95% CI, −0.55, −0.19]; I2
= 56%) (P = 0.79) (Fig. 3).
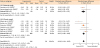 | Fig. 3Forest plot of ICS treatment effects stratified by cough duration (subacute vs. chronic cough). Green squares indicate effect size and weight of each study for standard mean differences. Black diamonds represent the pooled effect size and 95% CI.SD, standard deviation; CI, confidence interval; ICS, inhaled corticosteroids.
|
Notably, the study showing the best outcomes from ICS treatment28 had a high proportion of methacholine-positive patients (50%) and utilized high doses of these drugs (Table 1 and Supplementary Table S3). Thus, we performed sensitivity analyses according to the presence of AHR and ICS dose, and they were suggested to influence ICS treatment effects; however, when the study showing the notably high treatment effects28 is excluded, such differences became less remarkable (Supplementary Table S5). ICS treatment effects also did not appear to differ by treatment duration (2 vs. 4 weeks), when the outlier study28 was excluded (Supplementary Table S5).
Although 4 studies22232427 measured airway eosinophilic inflammation, only 1 study27 was designed to test the associations between this biomarker and the ICS treatment responsiveness, and reported significant dose relationships between the baseline FeNO levels and ICS treatment effects (Supplementary Table S3). The 2 studies that recruited patients with negative methacholine AHR found that none of the subjects tested had airway eosinophilia.2223 One study24 measured the induced sputum eosinophils in a subgroup of patients, but found an insignificant association with ICS treatment effects.
RQ2. Placebo treatment effects in patients with cough
Placebo effects (defined by any difference before and after placebo treatment) were summarized for each of the cough severity or frequency outcomes (Table 2). Numerically, overall placebo treatment effects (%, relative change from the baseline score) ranged from −72.9% to −2.2% (a negative score indicating improvement), but with studies of patients with acute or subacute cough reporting greater placebo effects (range, −72.9%, −49.6%) than those of chronic cough (range, −40.0%, −2.2%). Meanwhile, objective cough frequency was only measured in 1 RCT of acute cough (for cough epochs), and the change was −49.6%.29 Subjective cough frequency score was reported in 1 chronic cough study, which observed a relative change of −36.7%.28
Random effects meta-analyses were conducted for subjective cough severity scores in 8 RCTs (Fig. 4).2223242526272830 Pooled placebo effects yielded an SMD of −0.94 (95% CI, −1.45, −0.44), indicating a strong placebo effect overall, but also with a substantial heterogeneity (I2
= 93%). In a visual inspection of the forest plot, 2 studies of subacute cough2526 showed remarkably greater placebo effects compared to those of chronic cough (Fig. 4). Placebo effects were calculated as an SMD of −2.58 (95% CI, −3.03, −2.13, I2
= 0%) in 2 studies of subacute cough,2526 indicating a very large effect. However, in 6 studies of chronic cough,222324272830 the pooled estimate was an SMD of −0.46 (95% CI, −0.72, −0.21; I2
= 69%), indicating a moderate effect. Subgroup differences were statistically significant between subacute and chronic coughs (P < 0.001) (Fig. 4).
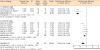 | Fig. 4Forest plot of placebo treatment effects stratified by cough duration (subacute cough vs. chronic cough). Red squares indicate effect size and weight of each study for standard mean differences. Black diamonds represent the pooled effect size and 95% CIs.SE, standard error; CI, confidence interval.
|
The study by Pizzichini et al.,23 which had the longest cough duration (mean cough duration of 10.8 years at baseline; and for at least 1 years in the inclusion criteria), showed the lowest placebo effects. Meanwhile, the study by Ribeiro et al.
28 showed the greater placebo effects among the studies of chronic cough patients, which had a mean cough duration of about 4 months. In sensitivity analyses by inhaler device, there was a trend toward a greater placebo effect in studies using metered dose inhaler than studies using other type of inhalers; however, when excluding the outlier study,28 the magnitude of the trend decreased (Supplementary Table S6). Treatment duration (2 vs. 4 weeks) did not appear to make a difference in placebo effect size; however, longer treatment duration (4 weeks compared to 2 weeks) showed a trend toward a larger placebo treatment effect when the outlier study28 was excluded (Supplementary Table S6).
DISCUSSION
Our present systematic review and meta-analyses summarized the literature on ICS and placebo treatment effects in adult patients with cough. The overall ICS therapeutic gains were small-to-moderate across the studies we reviewed. However, the improvements in cough severity were substantial in the placebo treatment groups; these effects were very large in studies of subacute cough patients, but were modest but still significant in studies of chronic cough patients. These findings collectively indicate the need for careful interpretation of ICS responsiveness in cough patients in the clinic and also for rigorous patient selection to identify ICS-responsive patients.
In the current literature, the magnitude of placebo effects has been found to be substantial for a variety of chronic medical conditions, including chronic itch,34 pain,353637 and gastrointestinal disorders.38 It is also known that strong placebo effects exist in over-the-counter medicines for acute cough.39 To our knowledge, placebo effects, however, have not been systematically examined for cough that persists for different durations. In our present review, we observed placebo effects in the cough severity scores ranging from 50% to 70% in studies of acute or subacute cough, but found that they occurred also in studies of chronic cough (range, 7.3%, 40%), with an inverse correlation with cough duration trend. In our meta-analyses, strong placebo effects were evident in subacute cough (SMD, −2.58 [95% CI, −3.03, −2.13]), and modest but significant effects were observed in chronic cough (SMD, −0.46 [95% CI, −0.72, −0.21]). As none of the RCTs we reviewed included “no treatment” group, the effects we calculated are likely to incorporate period effects (self-remission). The inclusion of a “no treatment group” in any future studies would enable a true placebo effect from inhaler therapies to be estimated. However, from a clinical perspective, present findings suggest that placebo or period effects should be taken into consideration in assessing ICS treatment responsiveness in daily practice or when interpreting uncontrolled clinical trials of ICS in patients with cough.
We observed only a small-to-moderate overall therapeutic gain from ICSs in studies of chronic cough. The gain did not exceed +22% overall in our assessment of cough outcomes across the full series of included studies, except for 1 study28 (Table 2). One study reported a much greater therapeutic gain in the cough scores of about +45.6% to +94.6% after 2 weeks of ICS treatment.28 Our sensitivity analyses indicated that specific patient or intervention characteristics (such as the presence of AHR or a higher dose of ICSs) might be related to ICS treatment effects; however, when the aforementioned outlier study28 was excluded, the sensitivity analysis findings became unremarkable. Hence, it is still unclear whether the methacholine AHR or ICS dose can influence ICS treatment responses.
The methacholine AHR parameter did not show any significant associations with ICS responsiveness within individual studies242628 (Supplementary Table S3). This lack of a relationship may have been attributed to insufficient sample sizes to test the association. However, these findings may also be plausible as nonspecific AHR does not well correlate with eosinophilic inflammation in the airways40; the latter is one of the main targets of corticosteroids. Moreover, eosinophilic bronchitis is common in chronic cough patients without AHR,61140 thus limiting the clinical value of nonspecific AHR in predicting ICS treatment responses in patients with cough.
Biomarkers for eosinophilic airway inflammation,41 such as FeNO or sputum eosinophilia, are suggested to be useful predictors of corticosteroid responsiveness in patients with various respiratory conditions.314042434445 However, only 1 placebo-controlled parallel group study27 among the reports we here reviewed was designed to test the hypothesis and found significant correlations between baseline FeNO levels and improvement in the cough VAS score (defined as a decrease of at least 20 mm) in the ICS treatment group. Further studies are warranted to confirm the utility of practical biomarkers, such as FeNO, to identify ICS responders in chronic cough.
Our study had several limitations of note. First, cough outcomes employed by the studies included (i.e., VAS and cough scores) were heterogeneous and poorly validated. The cough VAS score was utilized in a few studies23272829 and is a common useful tool to assess cough severity in the practice. However, there is a lack of published data reporting its validity and the minimal important difference.46 Other studies included utilized cough diary scores in different scales. 2224252630 Hence, our estimation of the treatment effects relied on an SMD scale, which is a relative measure. Utilization of validated objective cough frequency or cough-specific quality-of-life scores will facilitate more precise interpretation of ICS and placebo treatment effects in patients with cough. Secondly, none of the studies we reviewed had a “no treatment arm,” and the estimated placebo effects could not be differentiated from period effects. Thirdly, we did not perform formal statistical tests for assessing publication bias, as the number of studies included in the meta-analysis was small.20 In our opinion, the placebo treatment effects are less prone to publication bias than the ICS treatment effects, as the former was not primary outcome in the original RCTs. We sought to reduce publication bias by searching Clintrials.gov database for unpublished studies and by having no restriction by publication language or type (such conference abstract) in the literature selection process. Finally, our current findings may not be extrapolated to clinical trials of pharmacological treatments other than ICSs.
In conclusion, overall therapeutic gain from ICS may be modest in cough patients. However, the placebo effects of ICSs are large in subacute cough, and modest but still significant in chronic cough. Specific patient or intervention factors (such as asthmatic traits or treatment doses) may be associated with better treatment outcomes, but there is limited evidence that confirms these relationships. Our present findings of placebo treatment effects indicate that ICS treatment responsiveness should be cautiously interpreted in daily clinical practice or in uncontrolled clinical trials of cough patients. Given a considerable proportion of ICS-responsive cough (cough variant asthma and eosinophilic bronchitis) in the clinics, an empirical trial of ICS may be justified, but a stopping rule needs to be part of the management. In addition, further studies are warranted to identify and validate practical biomarkers for prediction of ICS responsiveness in patients with cough.
 XML Download