

 PDF
PDF ePub
ePub Citation
 Print
Print


INTRODUCTION
Radiomics is an evolving field that involves the use of high-throughput computing to extract a large number of quantitative features from medical imaging data (12). Recent studies have shown that radiomic features (RFs) can serve as prognostic factors in lung cancer and nasopharyngeal cancer (234). In the study by Huang et al. (4), the radiomics signature enhanced performance in predicting disease-free survival when incorporated into a nomogram with clinicopathologic factors. However, these studies analyzed CT images acquired with a wide range of parameter settings.
Since RFs seem to show poor reproducibility across different CT protocols (5), there is concern over the generalizability of radiomics results and their application across multiple centers. In the phantom-based study conducted by Berenguer et al. (5), only 71 of 177 RFs were reproducible when extracted from CT images acquired using different parameters, including 2-, 3-, 5-, and 8-mm slice thicknesses. Although the results of phantom studies cannot necessarily be directly translated to the clinical setting, this study demonstrated the need for standardization of radiomics methodology. Such standardization may improve the reproducibility and diagnostic performance of RFs.
The acquisition thickness of CT images is one aspect affecting reproducibility. He et al. (6) reported that thin-slice (1.25 mm) CT-based radiomic signatures showed significantly better diagnostic performance than thick-slice CT (5 mm) signatures in the discrimination of benign and malignant solitary pulmonary nodules. These results imply that thin-slice CT contains more information for radiomics analysis; however, the acquisition of thin-slice CT images involves greater storage requirements for collection and management of the data.
In an effort to reduce the variability of RFs resulting from differences in slice thickness and to obtain more information from CT images, we considered whether thick-slice images (3 or 5 mm) could be converted to 1-mm slice-thickness images using super-resolution (SR) reconstruction, and whether this would reduce the differences in RFs associated with different CT slice thicknesses (7). SR reconstruction is a post-processing technique that allows a high-resolution image to be produced from a sequence of low-resolution images, and its implementation with convolutional neural network (CNN) algorithms has been investigated in several medical imaging studies (891011).
Therefore, the aim of our study was to retrospectively assess the effect of CT slice thickness on the reproducibility of RFs of lung cancer, and to investigate whether CNN-based SR algorithms can improve the reproducibility of RFs obtained from images with different CT slice thicknesses.
MATERIALS AND METHODS
This retrospective study was approved by the Institutional Review Board of our center, which waived the requirement for patients' informed consent (approval number: 2018-1283).
Study Population
A retrospective search of the electronic medical records of our hospital for the period between July 2017 and December 2017 was performed by one radiologist (who had 2 years of experience in chest CT). A total of 445 patients who had undergone preoperative chest CT before surgical resection of primary lung cancer were identified.
The study population was enrolled on the basis of the following criteria: 1) identical CT parameter settings; contrast-enhanced CT images reconstructed with a B50f kernel and slice thicknesses of 1, 3, and 5 mm; and 2) lung cancers measuring up to 3 cm in the greatest diameter on CT. Exclusion criteria for this analysis were endobronchial or cavitary lesions, poor-quality CT images, and lesions that were difficult to clearly delineate because of accompanying lung parenchymal collapse or obstructive changes.
Among the 319 lung cancers identified as meeting the study criteria, 148 were solid and 171 were ground-glass nodules (GGNs), as classified by two radiologists in consensus. Subsequently, 50 nodules were randomly selected from each of the solid and GGN groups by using a pseudo-random number generating algorithm (Fig. 1). The final study population of 100 patients (mean age, 62.2 ± 10.6 years; range, 29–77 years) was enrolled (Table 1).
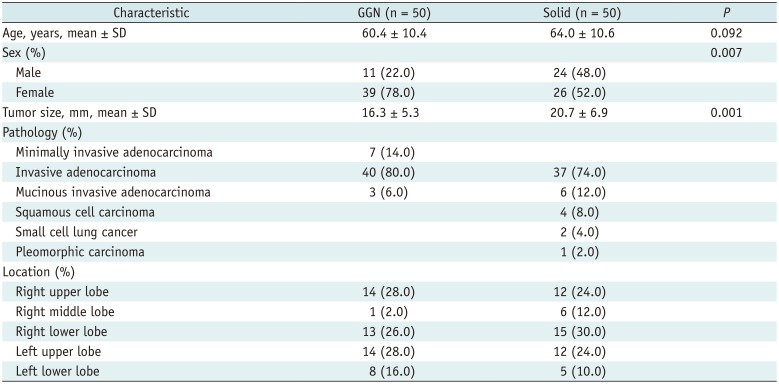
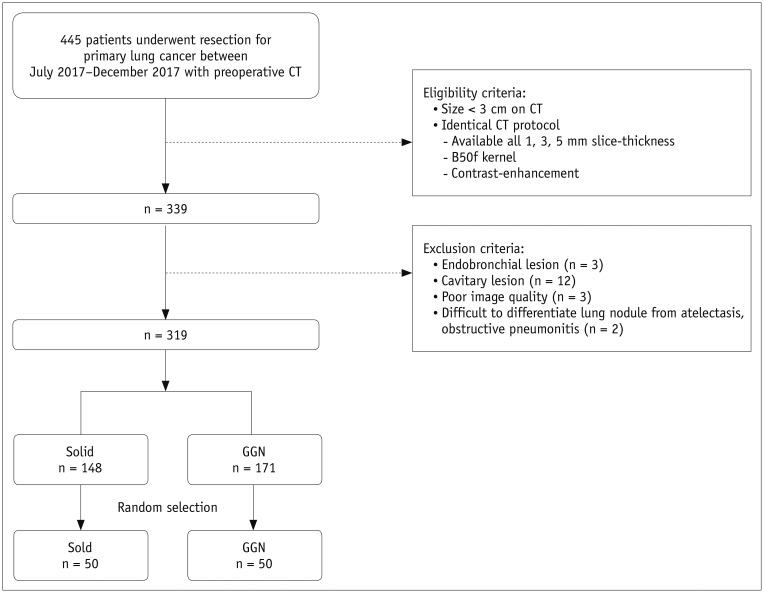
Table 1
Baseline Characteristics of Study Population (n = 100)
![]()
CNN-Based SR Technique
For development and validation of the model, CT data were collected from 100 patients without lung cancers. These 100 CT datasets were evenly divided into four categories according to the radiation dose (standard or low-dose) and the use of contrast enhancement (contrast-enhanced or not). Eighty-eight patients were randomly selected (22 from each category) to train the CNN model, with the remaining 12 patients (three from each category) being used to validate the model performance.
The SR algorithm for CT slice thickness is aimed at improving the resolution only in the depth direction, which can be interpreted as spatial information in the coronal and sagittal planes. The SR network is divided into preprocessing, non-linear mapping, and reconstruction parts (Fig. 2). The preprocessing part deals with variance from input images with different scales, and the non-linear mapping and reconstruction parts deal with the differences between the input images at low resolutions (3 or 5 mm) and the target image (1 mm). Further details are provided in the Supplementary Materials and Supplementary Table 1. To assess whether the CNN-based SR algorithm is better than the conventional simple interpolation algorithm, a trilinear interpolation algorithm was applied to convert slice thickness.
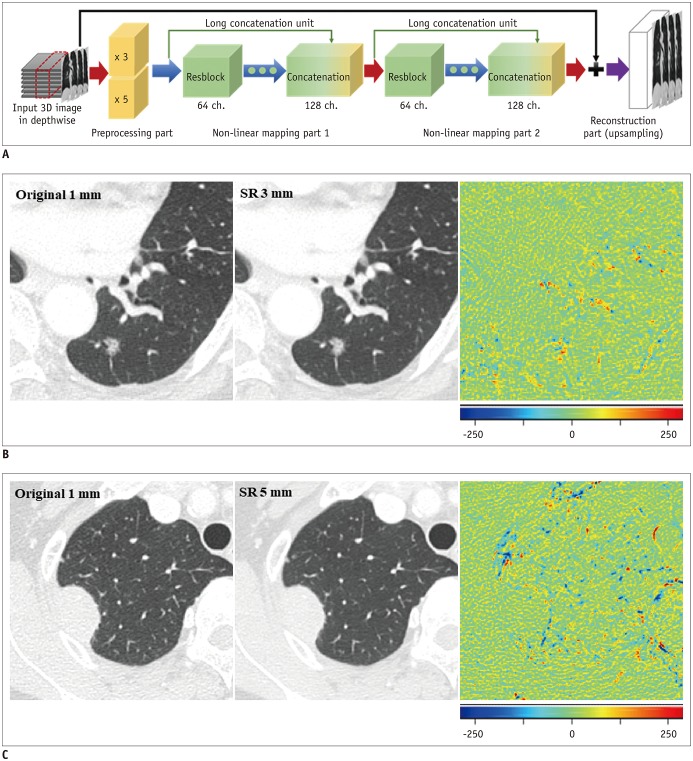
Fig. 2
Development of CNN algorithm for image conversion.
A. Network consists of preprocessing, non-linear mapping, and reconstruction parts. Preprocessing part deals with variance from input images with different scales, and non-linear mapping and reconstruction parts deal with differences between input images at low resolution (3 or 5 mm) and target image (1 mm). B. Ground-truth image, converted image, and difference map are presented. In difference map, green indicates zero, blue represents negative values, and red indicates positive values. When comparing original 1-mm and SR 3-mm images, most of lung parenchyma and small vascular structures show near-zero difference. Regions showing residual differences are present in pulmonary nodule, large vascular structures, fissure, and border between lung parenchyma and pleura (root-mean-square error: 30.83 HU). C. Comparison between original 1-mm and SR 5-mm images shows slightly more prominent differences in background lung parenchyma, including vascular structures, with speckled error regions remaining along margin of lung nodule (root-mean-square error: 37.65 HU). SR 3 mm refers to images converted from original 3-mm slice thickness, SR 5 mm refers to images converted from original 5-mm slice thickness. CNN = convolutional neural network, SR = super-resolution, 3D = three-dimensional
![]()
CT Acquisition
Chest CT images were obtained with SOMATOM Definition AS and Sensation-16 scanners (Siemens Healthineers, Forchheim, Germany), with settings of 120 kVp and 150–200 mAs, a pitch of 0.875–1, and collimation of 1–1.25 mm. Images were reconstructed using a B50f kernel with slice thicknesses of 1, 3, and 5 mm. All CT data were acquired in the supine position at full inspiration. Scan coverage was from the lung base to the level of the thoracic inlet. Intravenous contrast media (100 mL) was injected at a rate of 3 mL/sec, and scanning started after a delay of 50 seconds.
Lung Nodule Segmentation and Radiomics Analysis
Tumor segmentation was performed on 1-, 3-, and 5-mm images using commercial software (AVIEW, Coreline Soft, Seoul, Korea). For each tumor, the software automatically drew regions of interest covering the entire range of the tumor on the axial CT images. Then, one radiologist manually adjusted the boundary regions on each section (1213). Two radiologists confirmed the masks for the final regions of interest in consensus. A total of 718 RFs consisting of tumor shape, intensity, texture, and wavelet features were extracted automatically, as previously described (2).
Since variability in tumor segmentation can also induce differences in the RFs, the mask boundaries on the original 3- and 5-mm slice-thickness images were adjusted with reference to the masks of the original 1-mm slice-thickness images. For the same reason, the masks of the original 1-mm images were copied to the converted 1-mm images.
Statistical Analysis
Root-mean-square errors (RMSEs) were obtained as a quantitative measurement to assess differences between the original 1-mm and converted 1-mm images. The reproducibility of each individual RF was calculated using concordance correlation coefficients (CCCs) (14), with a CCC of ≥ 0.85 indicating a reproducible RF (15). The CCCs of RFs were compared using a paired t test or Wilcoxon test to assess significant differences in the reproducibility of RFs in all possible pairings from the original images (1 mm vs. 3 mm; 1 mm vs. 5 mm; and 3 mm vs. 5 mm). Subsequently, the CCCs of RFs obtained before and after the image conversion were compared. The performance of the CNN-based SR algorithm and that of a simple trilinear interpolation algorithm were compared in terms of CCCs. RFs between nodule types were also compared using an independent t test or Mann-Whitney tests. Sixteen shape features were excluded from this analysis because they had identical shapes, as they were copied from the original 1-mm mask.
All statistical analyses were performed using MedCalc statistical software (version 18.2.1; MedCalc Software, Ostend, Belgium). Data are presented as mean ± standard deviation. P < 0.05 was considered to indicate statistical significance.
RESULTS
Global Performance of the CNN-Based SR Algorithm
The RMSEs were 38.2 ± 3.8 HU between images with an original 1-mm slice thickness and those converted from an original 3-mm slice thickness, and 47.1 ± 4.0 HU between the original 1-mm slice-thickness images and those converted from an original 5-mm slice thickness (Fig. 2).
Effect of Slice Thickness on RFs
The mean CCCs for the shape features were more than 0.85 in all three pairings, which we regarded as an acceptable difference for tumor segmentation. The mean CCCs for all classes of features (except for the shape features) between 1- and 3-mm, 1- and 5-mm, and 3- and 5-mm images were 0.41 ± 0.23, 0.27 ± 0.21, and 0.65 ± 0.22, respectively, with all three pairings showing significant differences (p < 0.001 for all comparisons). Tumor intensity features showed the best reproducibility, while the CCCs for the wavelet features were the lowest in all three pairings.
In terms of nodule type, GGNs showed better reproducibility than solid nodules in all RF classes and in all slice-thickness pairings (p < 0.001 for 1 mm vs. 3 mm and 1 mm vs. 5 mm, and p = 0.002 for 3 mm vs. 5 mm). Table 2 presents the CCCs for the RF classes according to slice thickness.
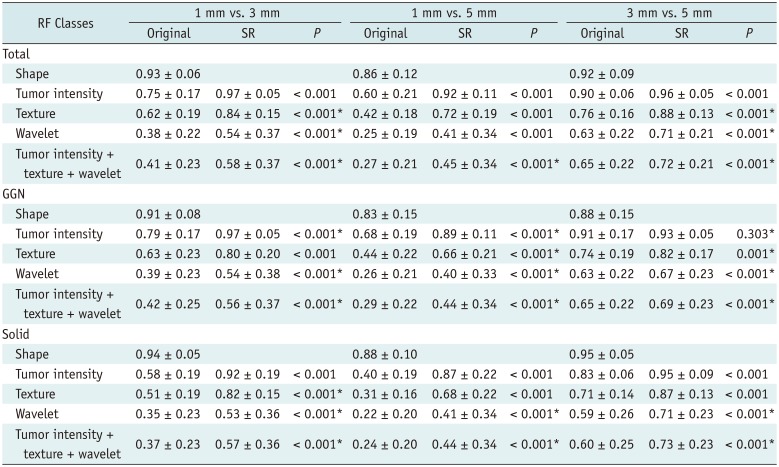
Table 2
CCCs between Different Slice Thicknesses before and after SR Application
![]()
The majority of RFs failed to reach the cut-off value for reproducibility in the original images, with 25, 7, and 151 out of 702 RFs (3.6%, 1.0%, and 21.5%, respectively) being considered as reproducible in comparisons between 1- and 3-mm, 1- and 5-mm, and 3- and 5-mm slice-thickness images, respectively.
Reproducibility of RFs after Image Conversion Using the CNN-Based SR Algorithm
Image conversion from slice thicknesses of 3 and 5 mm to 1 mm significantly improved reproducibility in all three pairings when all classes of features were pooled (mean CCCs increased from 0.27–0.65 to 0.45–0.72; p < 0.001 for all comparisons). This improvement was also observed in the subgroupings based on the classes of RFs and nodule types (Table 2). The CCCs between 1- and 3-mm slice-thickness images improved from 0.75 ± 0.17 to 0.97 ± 0.05, 0.62 ± 0.19 to 0.84 ± 0.15, and 0.38 ± 0.22 to 0.54 ± 0.37 for tumor intensity, texture, and wavelet features respectively (p < 0.001 for all comparisons). The CCCs between 1- and 5-mm slice-thickness images improved from 0.60 ± 0.21 to 0.92 ± 0.11, 0.42 ± 0.18 to 0.72 ± 0.19, and 0.25 ± 0.19 to 0.41 ± 0.34 for tumor intensity, texture, and wavelet features respectively (p < 0.001 for all comparisons).
The CCCs between 3- and 5-mm slice-thickness images also significantly increased, although the pre-conversion values were higher than the CCCs between 1- and 3-mm slice thicknesses (0.90 ± 0.06 to 0.96 ± 0.05, 0.76 ± 0.16 to 0.88 ± 0.13, and 0.63 ± 0.22 to 0.71 ± 0.21 for tumor intensity, texture, and wavelet features, respectively; p < 0.001 for all comparisons). Only the CCC for the tumor intensity features of GGNs was not significantly higher after image conversion (0.91 ± 0.17 to 0.93 ± 0.05, p = 0.303).
In accordance with this increase in the mean CCCs, the numbers of reproducible RFs also increased (Table 3, Fig. 3). Almost all tumor intensity features became reproducible (18, 16, and 18 out of 19 RFs for 1 mm vs. 3 mm, 1 mm vs. 5 mm, and 3 mm vs. 5 mm, respectively) after image conversion. In addition, the number of reproducible features in the texture class, which was particularly low in the comparisons between 1-mm vs. 3-mm and 1-mm vs. 5-mm slice-thickness images, significantly increased after image conversion (3 to 40, 0 to 17, and 23 to 45 out of 59 RFs for 1 mm vs. 3 mm, 1 mm vs. 5 mm and 3 mm vs. 5 mm, respectively).
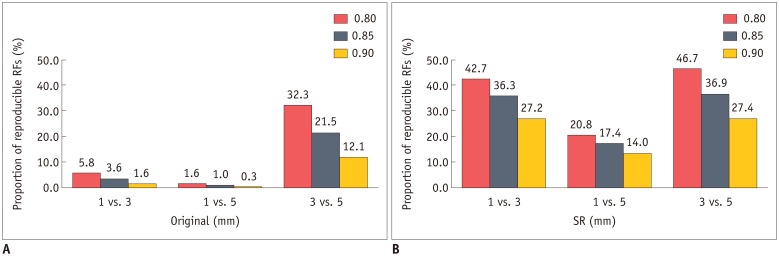
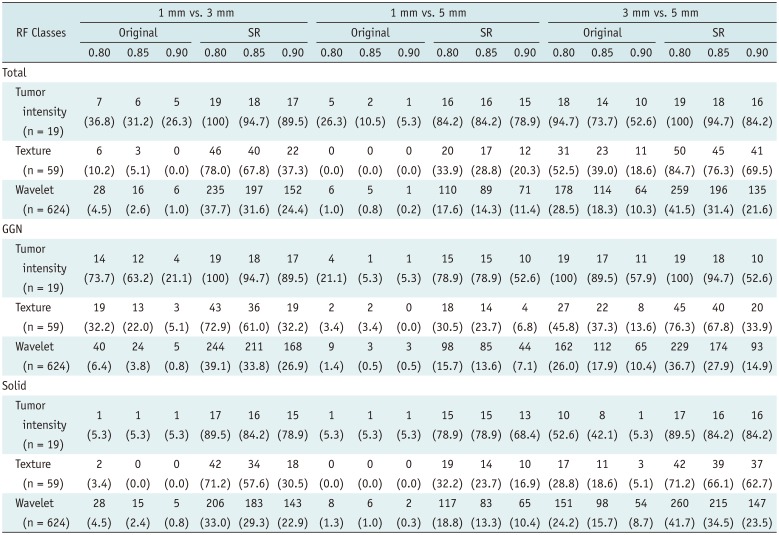
Fig. 3
Proportion of reproducible RFs (CCC ≥ 0.85) in different slice-thickness pairings before and after application of image conversion.
A. Majority of RFs failed to reach cut-off for reproducibility (CCC ≥ 0.85) in original images. After image conversion (B), proportion of reproducible RFs markedly increased in all three slice-thickness pairings. Similar tendency was observed using alternative cut-off values of 0.80 and 0.90. CCC = concordance correlation coefficients, RF = radiomic feature, SR = super-resolution
![]()
Table 3
Numbers of RFs Meeting Reproducibility Criteria according to Different CCC Thresholds (Cut-Offs; 0.80, 0.85, and 0.90)
![]()
For the wavelet features, both the mean CCC and the effect of image conversion varied among the subclasses of wavelet features, depending on the combination of high- or low-frequency components (Supplementary Table 2). The mean CCC tended to be better when more low-pass filters were applied.
When all features were pooled, the total number of reproducible features markedly increased from 16 to 197, 5 to 89, and 114 to 196 out of 624 RFs for 1 mm vs. 3 mm, 1 mm vs. 5 mm, and 3 mm vs. 5 mm, respectively.
Using simple interpolation, the overall reproducibility of the RFs was significantly lower than that with the SR algorithm (p < 0.001 for all comparisons) and was partly worse than those in all three pairings of different original slice-thickness images (Supplementary Table 3).
DISCUSSION
In this study, we demonstrated that the variability in RFs between different CT slice thicknesses was significant in lung cancer, and this variability can be reduced by the use of our CNN-based SR algorithm.
Previous studies showed that a large proportion of RFs (106/177) were prone to change according to the acquisition parameters (5), and that the average number of stable RFs was only 53.4 out of 114 (46.8%) when 1.5- and 3-mm slice thicknesses were compared, even when all sequences were acquired on a single CT scanner (16). These results are in line with our study, which indicates that the overall reproducibility of RFs between different slice-thickness images is not satisfactory (mean CCCs: 0.27–0.65). However, Lu et al. (17) reported that the mean CCCs of RFs were high (0.725–0.875) between pairings of different slice thicknesses (1.25, 2.5, and 5 mm) in 32 lung cancer patients. These discrepancies between our study and the study by Lu et al. (17) could mainly lie in differences in the numbers and composition of RFs, the status of contrast enhancement, and the CT vendor. We included a large number of wavelet features (624/702), which produced the lowest CCCs in the subgroup analysis, and used contrast-enhanced images taken on a scanner from a different vendor. Therefore, further studies with different acquisition settings are required to verify our results.
As expected, the agreements between 1- and 5-mm slice thicknesses were the lowest, while the 3- and 5-mm slice-thickness pairing showed the highest agreement. This agreement trend implies that the more two datasets overlap, the higher the similarity between the images. Tumor intensity and texture features yielded acceptable agreement levels between 3- and 5-mm slice thicknesses; however, in this pairing showing the best agreement, there was still a large proportion of non-reproducible RFs (78.5%, 551/702), and this implies that comparisons of radiomics results derived from CT images with different slice thicknesses may be unreliable.
To overcome this limitation, we developed the CNN-based SR algorithm to reduce the variability of the RFs. When the algorithm was designed, we chose 1 mm as a target slice thickness because measurements of subcentimeter lung nodules should be obtained using thin-slice CT (≤ 1.5 mm), as recommended by the Fleischner Society (18), and thin-slice CT (1.25 mm) is more informative than 5-mm CT for discriminating between benign and malignant solitary pulmonary nodules (6).
Our CNN-based method was consistently effective in all subgroups from all three pairings of different slice thicknesses and showed a significant increase in reproducibility, except for the 3- and 5-mm slice-thickness comparison in the GGN group. Furthermore, the total number of reproducible RFs (CCC ≥ 0.85) was much higher in comparison with the original images, which provided only a small number of reproducible RFs across the various slice-thickness protocols. Therefore, the SR technique can be used to decrease the effect of slice thickness when RFs extracted from different slice-thickness images were compared with each other or analyzed together.
Another interesting finding of our study was that GGNs showed better reproducibility than solid nodules in all RF feature classes in all slice thicknesses, despite GGNs being vulnerable to slice thickness, as they appear faint and may be missed on thick-slice images. A possible explanation is that the volume-averaging effect changes the attenuation and its distribution of solid nodules more greatly than that of GGNs because the difference in attenuation between normal lung parenchyma and GGNs is smaller than that between normal lung parenchyma and solid nodules. However, other factors such as nodule shape or nodule size could influence the results. Matched case comparisons between solid nodules and GGNs may be necessary to confirm our results.
Our study has several limitations. First, our study included only contrast-enhanced images because preoperative CT for lung cancer was performed with contrast enhancement in routine practice. To compensate for this limitation, we used equal quantities of non-contrast and contrast-enhanced CTs for the training set. Thus, we expect the SR technique to work effectively on non-contrast images as well. A second limitation was the variability in tumor segmentation itself. The boundaries of a nodule on 1-, 3-, and 5-mm slice-thickness images are not inherently the same. However, given that substantial agreement in the shape features was achieved between all three pairings of original images (mean CCC ≥ 0.85 for all comparisons), the effects of the segmentation differences on the radiomics data were within acceptable ranges. Third, the shape features that were most sensitive to slice thickness were excluded from the analysis, as the masks were drawn by referencing or copying the masks of the original 1-mm slice-thickness images, to ensure that the effect of slice thickness was evaluated independently of segmentation effects. When applying the SR technique in real practice, segmentation variability, as well as slice thickness, will affect the reproducibility of the extracted RFs. Therefore, in future studies, it will be necessary to investigate the effects of both of these through separate tumor segmentations. Fourth, the trilinear interpolation algorithm applied in our study is one of various interpolation methods and may not be the optimal method for slice-thickness reduction. Therefore, it might be hasty to mention that our CNN-based algorithm outperforms simple interpolation methods. Last, since our study is a feasibility study to investigate the effect of a CNN-based SR algorithm on the reproducibility of RFs, we did not assess whether the better reproducibility obtained with the SR technique will lead to improvements in the performance of radiomics-based tasks. Therefore, further studies are warranted to determine the clinical utility of our method.
In conclusion, the reproducibility of RFs in lung cancer is significantly influenced by CT slice thickness, which can be improved by the application of CNN-based SR algorithms.
 XML Download