Journal List > Korean J Radiol > v.20(10) > 1133450

Lee, Yoon, Lim, Lee, Kim, Choi, and Kim: Ultrasound Feature-Based Diagnostic Model Focusing on the “Submarine Sign” for Epidermal Cysts among Superficial Soft Tissue Lesions

Abstract

Objective

To develop a diagnostic model for superficial soft tissue lesions to differentiate epidermal cyst (EC) from other lesions based on ultrasound (US) features.

Materials and Methods

This retrospective study included 205 patients who had undergone US examinations for superficial soft tissue lesions and subsequent surgical excision. The study population was divided into the derivation set (n = 112) and validation set (n = 93) according to the imaging date. The following US features were analyzed to determine those that could discriminate EC from other lesions: more-than-half-depth involvement of the dermal layer, “submarine sign” (focal projection of the hypoechoic portion to the epidermis), posterior acoustic enhancement, posterior wall enhancement, morphology, shape, echogenicity, vascularity, and perilesional fat change. Using multivariable logistic regression, a diagnostic model was constructed and visualized as a nomogram. The performance of the diagnostic model was assessed by calculating the area under the curve (AUC) of the receiver operating characteristic curve and calibration plot in both the derivation and validation sets.

Results

More-than-half-depth involvement of the dermal layer (odds ratio [OR] = 3.35; p = 0.051), “submarine sign” (OR = 12.2; p < 0.001), and morphology (OR = 5.44; p = 0.002) were features that outweighed the others when diagnosing EC. The diagnostic model based on these features showed good discrimination ability in both the derivation set (AUC = 0.888, 95% confidence interval [95% CI] = 0.825–0.950) and validation set (AUC = 0.902, 95% CI = 0.832–0.972).

Conclusion

More-than-half-depth of involvement of the dermal layer, “submarine sign,” and morphology are relatively better US features than the others for diagnosing EC.

INTRODUCTION

Epidermal cyst (EC), also called epidermoid cyst, infundibular cyst, or sebaceous cyst, is one of the common and benign cutaneous tumor-like lesions (12345). It tends to remain asymptomatic and slowly grows as a benign dermal nodule with extremely rare malignant transformation (678). However, EC may become painful with the ulceration of the epithelial lining. This often precludes clinicians from differentiating EC from other symptomatic, superficially located soft tissue lesions (910). Moreover, complete surgical excision of EC is required due to the high risk of recurrence (11). These characteristics of EC necessitate an accurate differential diagnosis. However, differentiating EC from other subcutaneous cysts, solid tumors, or vascular lesions is sometimes challenging (12). Many superficial lesions can be misdiagnosed as EC on the initial ultrasound (US) examination, partly because the incidence of EC has been reported to be the second-highest after lipoma (10).
In most clinical situations, US has been widely used as the first imaging modality owing to its superiority over MRI in terms of cost-effectiveness (91314151617). Nevertheless, to the best of our knowledge, the reported US features of EC could still not provide a definitive differential diagnostic point in practice (912). Therefore, this study aimed to develop a diagnostic regression model for differentiating EC from other superficial soft tissue lesions based on their distinguishing US features and visualizing it as a nomogram to aid differential diagnosis.

MATERIALS AND METHODS

This retrospective study was approved by the Institutional Review Board of a single institution. The requirement for informed consent from patients was waived.

Patients

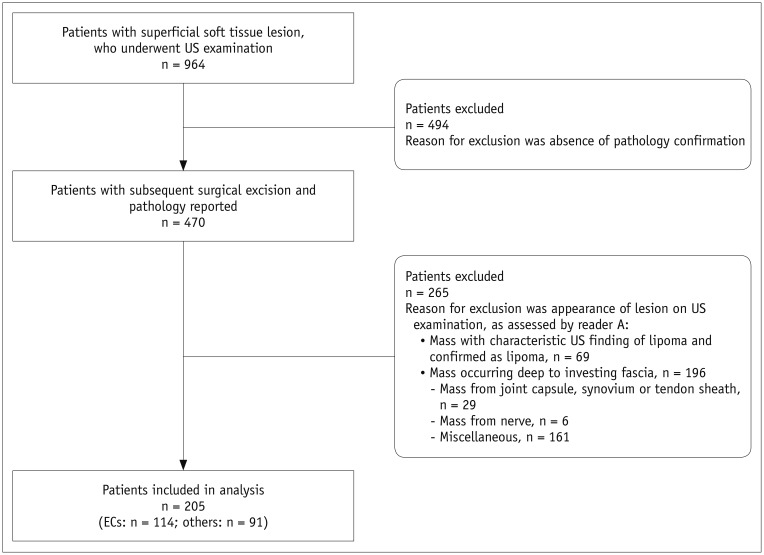
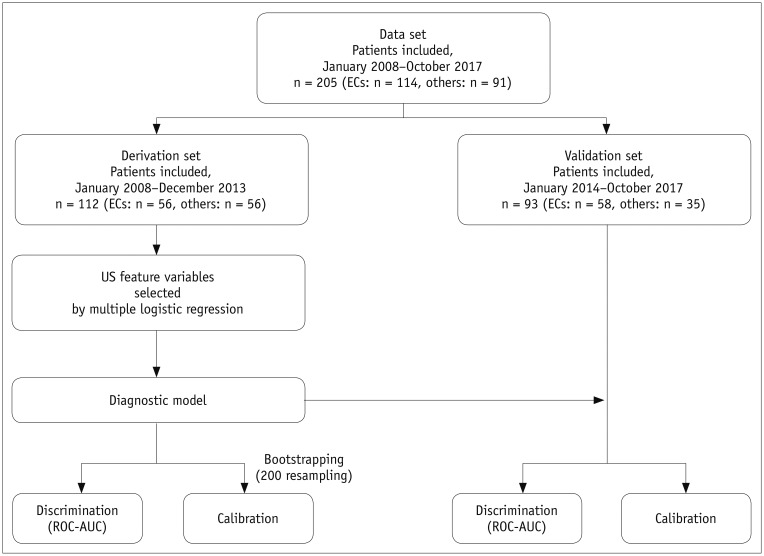
Patients who had palpable, superficial soft tissue lesions and underwent US examination before surgical excision, between January 2008 and October 2017, at our institution, were identified. The demographic characteristics of the patients were reviewed from the electronic medical records. Patients who underwent subsequent surgical excision and reported pathology were included in this study. Ineligible patients were excluded based on US image analysis by a senior musculoskeletal radiologist (reader A, 35 years of experience in musculoskeletal radiology) by using the following criteria: 1) mass with characteristic US finding of lipoma (18) and pathologically confirmed as such (19), and 2) mass occurring deep to the investing fascia (10). The flow chart illustrating patient selection is given in Figure 1.

US Examination

All US examinations were performed by an experienced musculoskeletal radiologist (reader B, 20 years of experience), using 5- to 12-MHz linear-arrayed transducers with the following systems: iU22 (Philips Medical Systems, New Hartford, CT, USA) or Aplio 500 (Canon Medical System, Tokyo, Japan).
The routine US protocol comprised gray-scale and color Doppler US examinations. The gray-scale image was obtained in the transverse and longitudinal planes for each lesion. Color Doppler study was performed after optimizing the visualization of minute vasculature and avoiding artifacts most of the time. The pulse-repetition frequency and wall filter were set as the lowest possible (20). Doppler gain was modulated to the maximum signal at the threshold to noise (21).

US Image Analysis

US Features as Variables

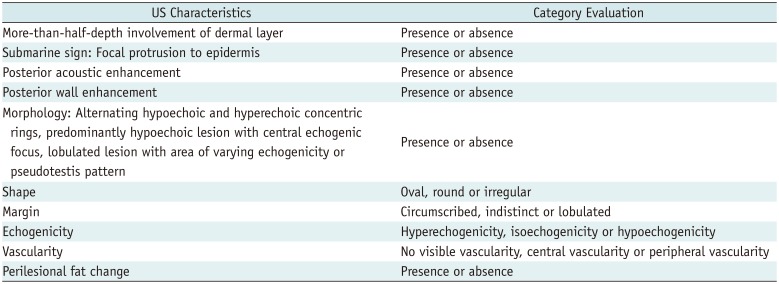
Two musculoskeletal radiologists (readers B and C, with 20 and 10 years of experience, respectively), blinded to the pathology results, independently evaluated each examination retrospectively. The US features of the lesions were described according to the following categories: whether the lesion involved more-than-half-depth of the dermal layer, whether the lesion showed the “submarine sign,” presence of posterior acoustic enhancement, presence of posterior wall enhancement, morphology, shape, margin, echogenicity, vascularity, and presence of perilesional fat change. The evaluated categories are summarized in Table 1.
The location of the lesion was analyzed based on more-than-half-depth involvement of the dermal layer. The “submarine sign” is explained in detail in the following section. Posterior acoustic enhancement was defined as increased transmission deep through the lesion (22). Posterior wall enhancement was identified when the deepest wall of the mass appeared hyperechoic. The morphological category was evaluated based on the presence of a known morphological feature of EC (223). The morphological classification of EC by Lee et al. (2) was used with modification for this purpose. Type 3 and 4 lesions, which were hypoechoic lesion with a central echogenic focus and inhomogeneously hypoechoic lesion, respectively, were excluded as the findings appeared nonspecific. In addition to the classification system stated above, “pseudotestis sign” of EC described by Huang et al. (23) was also used as a morphological indicator. The categories for shape and margin were adopted from the US lexicon concept from the fifth edition of the American Society of Radiology Breast Imaging Reporting and Data System (24) and modified for this study. The shape of the lesion was classified as oval, round, or irregular. Additionally, the margin of the lesion was classified as circumscribed, indistinct, or lobulated. Echogenicity was classified as hypoechogenicity, isoechogenicity, or hyperechogenicity as compared to the echogenicity of the adjacent hypodermal fat (1720). Vascularity of the lesion was evaluated on color Doppler images as absent, central, or peripheral. The presence of perilesional fat change was determined when the adjacent fat showed increased echogenicity to the deep hypodermal fat on the gray-scale image (2526) or increased signal as hyperemia on Doppler image (27).
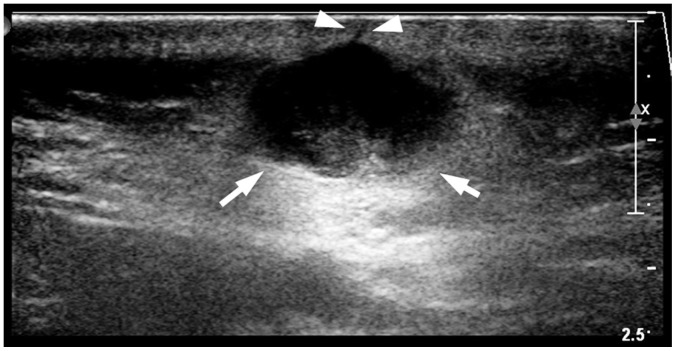
Submarine Sign

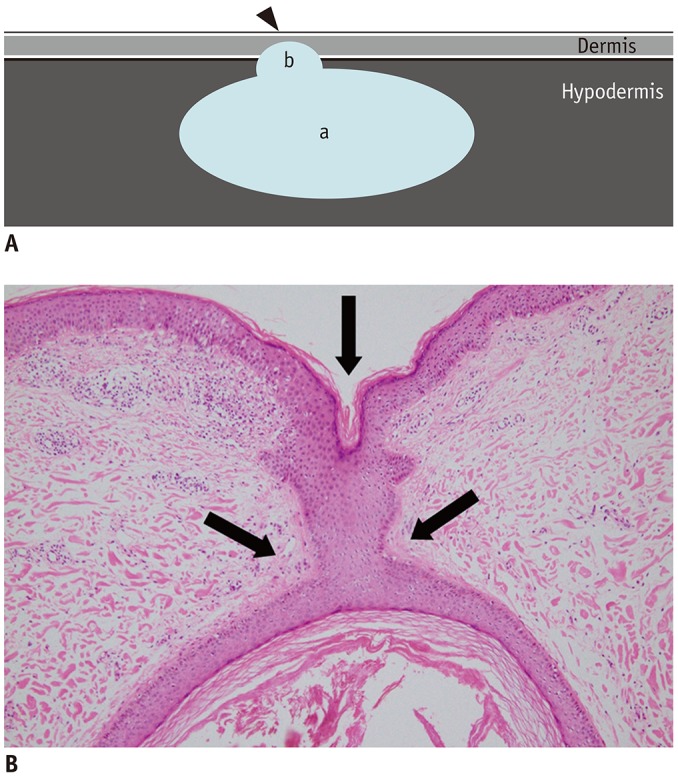
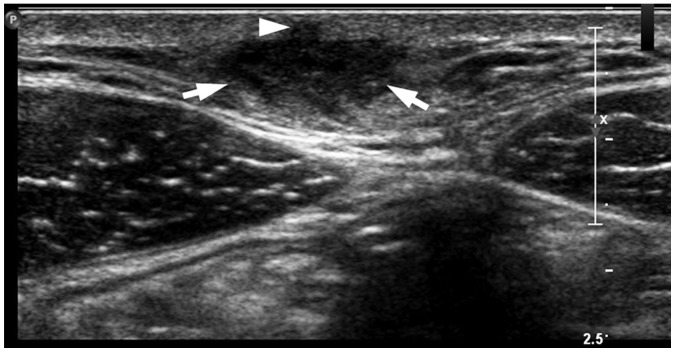
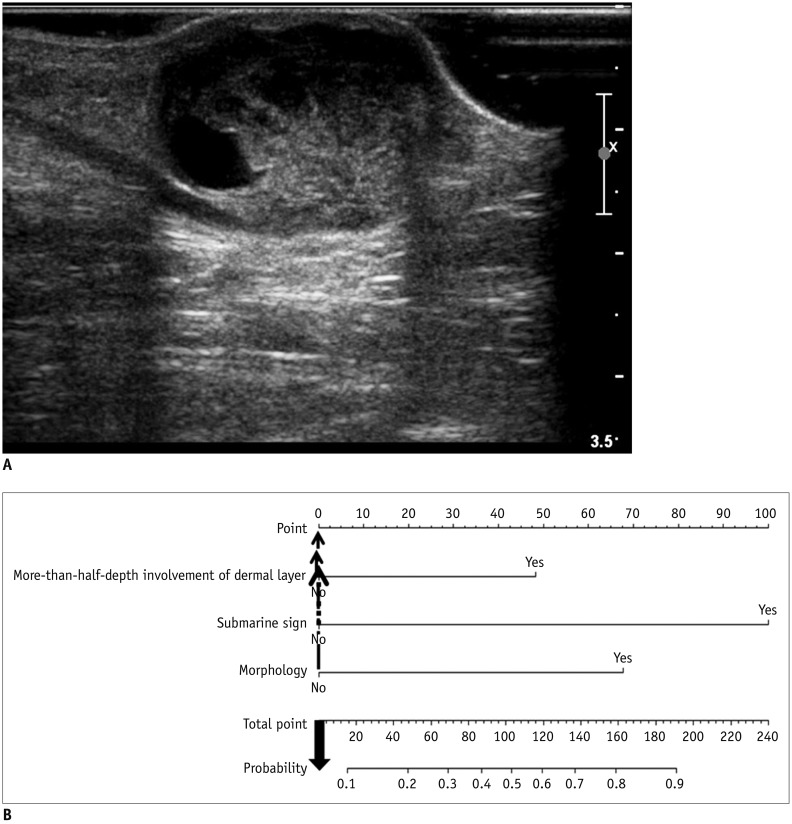
We introduce a descriptive term “submarine sign,” which is depicted in detail in Figure 2 and provide suitable examples (Figs. 3, 4). The “submarine sign” is defined when the lesion shows focal projection of the hypoechoic portion, regardless of the width, depth, and morphology, towards the epidermis. EC may have a clinically visible punctum representing the follicular infundibulum of the terminal hair from which the cyst is derived (45142829). We speculated that the “submarine sign” may be related to the punctum (Fig. 2) and regarded it as a possible image feature of EC.

Statistical Analysis

The included patients were divided into the derivation and the validation sets according to the date of imaging (January 1, 2014) (30). Pearson's chi-square test or Fisher's exact test were performed to compare the categorical image variables between EC and other superficial lesions for categorical image variables. Interobserver agreement was assessed using Cohen's kappa statistics. Based on the derivation set data from reader B, multivariable logistic regression was performed to obtain the odds ratios (ORs) and p values to assess statistical significance (3132). A diagnostic model was developed and constructed as a nomogram. Through internal and external validations, we attempted to examine the performance of the diagnostic model (3334). The discriminatory ability of the diagnostic model was calculated using the area under the curve (AUC) of the receiver operating characteristic (ROC) curve. The Hosmer-Lemeshow test was used for testing the goodness of fit for the model. Moreover, a calibration plot was constructed to investigate the agreement between the observed outcomes and diagnostic prediction for the derivation and validation sets. For the derivation set, 200 bootstrap resampling was applied to obtain bias-corrected calibration (31). In contrast, the image variables constituting the diagnostic model were compared with the AUCs using the DeLong method to compare the predictive poswer of each variable. All statistical tests were two-tailed. A p value less than 0.05 indicated statistical significance with a 95% confidence interval (95% CI). In addition, a p value greater than or equal to 0.05 and less than 0.1 was considered as indicating a trend towards significance to increase the sensitivity for detecting a potential selection bias. The statistical analysis scheme is given in Figure 5.
Statistical analysis was performed using SAS (version 9.3, SAS Institute Inc., Cary, NC, USA). The R Project for Statistical Computing (version 3.2.2, The R Foundation, Vienna, Austria, http://www.R-project.org) was used to develop the diagnostic model as a nomogram.

RESULTS

In the study period, 964 patients underwent US examinations for superficial soft tissue lesions, among whom, 470 patients underwent subsequent surgical excision and pathological examination. All patients had solitary lesions. As per our criteria, 265 patients were excluded for the following reasons: 1) mass with characteristic US finding of lipoma and pathologically confirmed as a lipoma (n = 69), and 2) mass present deep to investing fascia (n = 196). Finally, the study population comprised 205 dermal lesions from 205 patients.
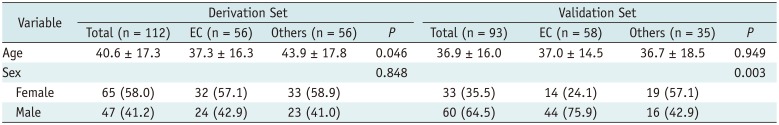
For the derivation set, we identified 56 patients with pathologically confirmed EC (mean age, 37.3 years; 32 female patients and 24 male patients) between January 2008 and December 2013. Another 56 patients were pathologically confirmed as having other soft tissue disease (mean age, 43.9 years; 33 female patients and 22 male patients) during the same period. These 112 patients were included in the derivation set for the construction of the diagnostic model.
For the validation set, we identified 58 patients with pathologically confirmed EC (mean age, 37.0 years; 14 female patients and 44 male patients) between January 2014 and October 2017. Another 35 patients were pathologically confirmed as having other soft tissue disease (mean age, 36.7 years; 19 female patients and 16 male patients) during the same period. Finally, these 93 patients were included in the study as the validation set. The validation set was used to examine the performance of the diagnostic model.
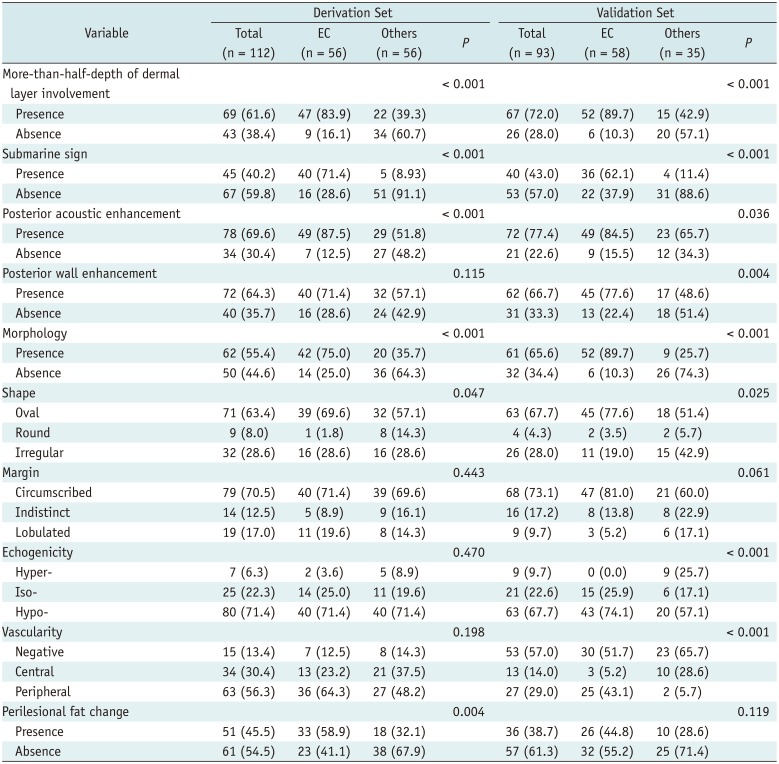
Demographic characteristics of the study population are summarized in Table 2. Additionally, categorical evaluation of US exam in both sets from reader B is listed in Table 3.
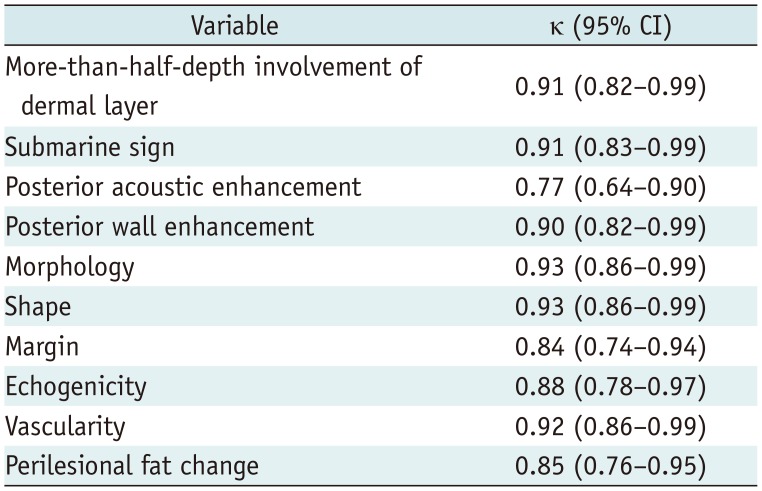
Table 4 shows the interobserver agreement of US features among the two readers. High degree of agreement was shown for almost all variables, including more-than-half-depth involvement of the dermal layer (κ = 0.91), “submarine sign” (κ = 0.91), posterior wall enhancement (κ = 0.90), morphology (κ = 0.93), echogenicity (κ = 0.88), shape (κ = 0.93), margin (κ = 0.84), vascularity (κ = 0.92), and perilesional fat change (κ = 0.85). However, the kappa value for posterior acoustic enhancement indicated substantial agreement (κ = 0.77).
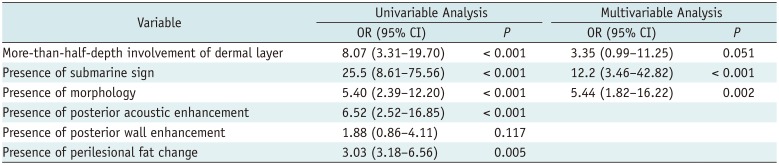
In the univariable regression, we considered variables that had p value less than 0.05, including more-than-half-depth involvement of the dermal layer (p < 0.001), “submarine sign” (p < 0.001), posterior acoustic enhancement (p < 0.001), morphology (p < 0.001), posterior wall enhancement (p = 0.117), and perilesional fat change (p = 0.005).
Thereafter, via stepwise multivariable logistic regression, more-than-half-depth involvement of the dermal layer (OR = 3.35; 95% CI = 0.99–11.3; p = 0.051), “submarine sign” (OR = 12.2; 95% CI = 3.46–42.8; p < 0.001), and morphology (OR = 5.44; 95% CI = 1.82–16.2; p = 0.002) were associated with EC. The result is listed in Table 5. Probability of EC can be calculated by using the following equation:
ProbabilityofEC=1(1+e−LP)kjr-20-1409-e001.jpg
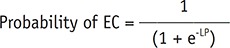
where e is the exponential constant (e = 2.718), LP is the linear predictor, and
LP = −2.5768 + 1.2074 × L + 2.4494 × SM + 1.693 × MP
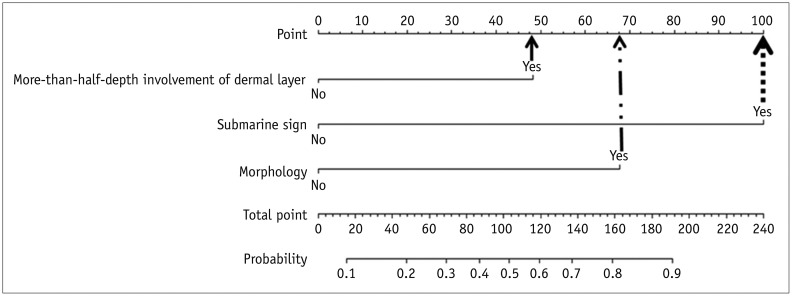
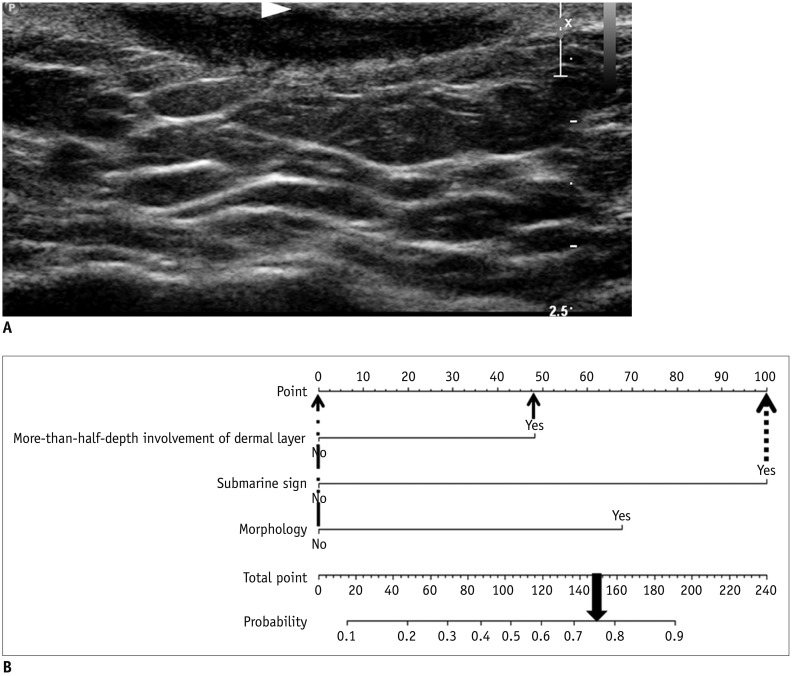
where L is the value for whether the lesion involved more than half the depth of the dermal layer (yes, L = 1; no, L = 0), SM is the value for the “submarine sign” (yes, SM = 1; no, SM = 0), and MP is the value for morphology (yes, MP = 1; no, MP = 0). A nomogram was constructed on the basis of the result of the stepwise multivariate analysis from the derivation set (Fig. 6). Via the summation of points of each variable, it was possible to estimate the probability by calculation of equation and visual assessment of the nomogram. The nomogram used for visual assessment is shown as examples in Figures 7 and 8.
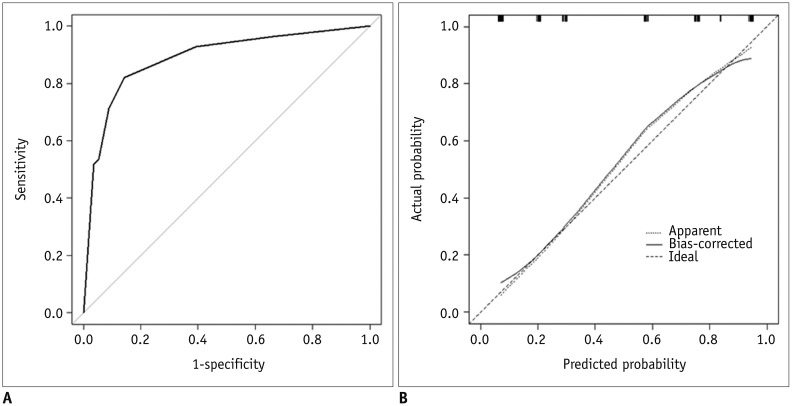
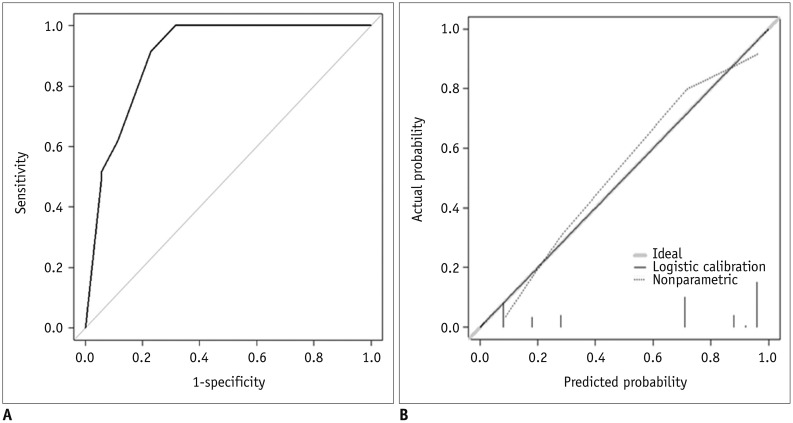
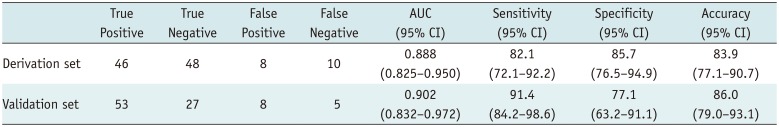
The diagnostic model from the derivation set showed an excellent ability for discrimination (AUC = 0.888, 95% CI = 0.825–0.950; Hosmer-Lemeshow goodness-of-fit test, p = 0.656) (Fig. 9A) and calibration (Fig. 9B). The diagnostic model was applied to the external validation set and showed good ability for discrimination (AUC = 0.902, 95% CI = 0.832–0.972; Hosmer-Lemeshow goodness-of-fit test, p = 0.034) (Fig. 10A) and calibration (Fig. 10B).
By calculating the maximum Youden index and analyzing the ROC curve, we determined the optimal cut-off of the diagnostic model from the derivation set, which was 0.44. In the validation set, the diagnostic model showed 91.4% sensitivity (95% CI = 84.2–98.6), 77.1% specificity (95% CI = 63.2–91.1) and 86.0% accuracy (95% CI = 79.0–93.1). Likewise, in the derivation set, it showed 82.1% sensitivity (95% CI = 72.1–92.2), 85.7% specificity (95% CI = 76.5–94.9) and 83.9% accuracy (95% CI = 77.1–90.7). The detail of the estimation is given in Table 6.
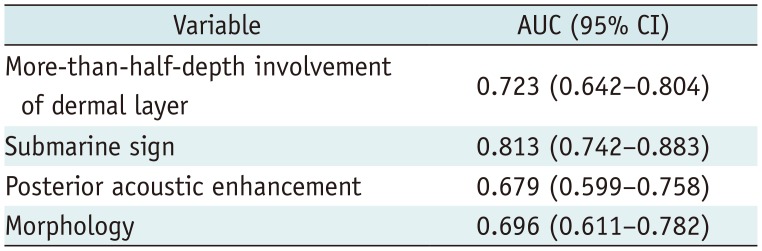
By using DeLong method, we found that the “submarine sign” showed the highest predictive power (AUC = 0.813) among the image variables, including more-than-half-depth involvement of the dermal layer (AUC = 0.723), posterior acoustic enhancement (AUC = 0.679), and morphology (AUC = 0.696) (Table 7).

DISCUSSION

Our study demonstrated that the distinguishing features of EC on US include more-than-half-depth involvement of the dermal layer (OR = 3.35), “submarine sign” (OR = 12.2) and morphology (OR = 5.44). The diagnostic model based on these US features suggests the presence of EC at the cutoff point of 0.44 with 91.4% sensitivity and 77.1% specificity for validation set and 82.1% sensitivity and 85.7% specificity for the derivation set. We believe that our diagnostic model could help differentiate EC from other superficial soft tissue disease on US.
Unlike previous investigations, we excluded the US finding of posterior acoustic enhancement from our diagnostic model. Posterior acoustic enhancement has been reported as a diagnostically important feature in previous investigations (2335). However, we excluded it because its predictive power was less than those of the other US features in the AUC analysis. Collinearity between ‘morphology’ and ‘posterior acoustic enhancement’ caused the discrepancy between our study and the previous investigations. Furthermore, morphology has been reported as an important feature for diagnosing EC. Huang et al. (23) emphasized the “pseudotestis appearance” of EC, which we used as a morphological indicator in this study. Moreover, the morphological features supported by pathologic findings in the study of Lee et al. (2), were also adopted in our study. Based on our results, we believe that morphology should be more focused than posterior acoustic enhancement in differentiating EC from other superficial soft tissue mass-like lesions.
Most of the ECs consisted of keratin debris and were lined with stratified squamous epithelium, arising from the follicular portion of the body (2336). The presence of the tract towards the skin was previously inferred to represent the hair follicle of the dermis towards the epidermis of the EC (37). The “tract-to-skin sign” has been described and is presumably well known to radiologists and dermatologists as a representative characteristic of EC (1438), but this concept was not examined for its statistical significance. We believe that the “submarine sign” we have suggested in this study is closely related to the “tract-to-skin sign” with statistical consideration. The “submarine sign” is expected to be correlated with the punctum connecting the epidermis to the EC. Although the incidence of the punctum has not been rigorously investigated previously, to the best of our knowledge, the previous investigation did report the punctum in 40% of 34 EC (28). In this study, we did not directly correlate the punctum and the “submarine sign” in each case using radiopathologic comparison. However, we believe that the “submarine sign” could suffice as an important image feature based on the results of our study and previous studies describing the presence of the punctum histologically (28) and radiologically (2337).
Finally, the diagnostic model from our study shows 82.1% sensitivity and 85.7% specificity. At first glance, our diagnostic model seems to have a similar degree of sensitivity and specificity to those described in previous studies (910). However, the study population itself differs from those of other studies because it only includes patients with lesions that require differential diagnosis owing to their similar appearance on US examination. Through the study design, we intentionally attempted to analyze the difference between EC and comparable lesions. As a result, lipomas and other deeply located soft tissue lesions were excluded. To our knowledge, the differentiating point between EC and similar lesions has not been reported previously. Furthermore, the reviewer who performed the exclusion did so only on the basis of the US finding without having access to any clinical information.
Several limitations of this study should be addressed. First, this study was retrospective. Hence, potential selection bias cannot be avoided. Characteristics such as more-than-half-depth involvement of the dermal layer and “submarine sign” could have been under detected as these features could be overlooked while acquiring the images used in this study. Second, the study population with EC was not further classified according to the existence of rupture. A ruptured EC is known to have giant cells with keratin material at the ruptured site on pathologic examination (2). Yuan et al. (39) reported that ruptured EC had lobulated margins rather than the oval-shaped margins seen in unruptured EC. However, Jin et al. (40) argued that the presence of a focal protrusion and not a lobulation in EC can serve as a feature for the differential diagnosis of ruptured and unruptured EC. However, the focal protrusion known as “submarine sign” can be applied to both ruptured and unruptured EC, because this sign is based on their possible developmental origin. In this study, we did not compare the exact location between a clinically visible punctum and the “submarine sign” in the lesions. Additionally, a ruptured EC may reveal more blood flow; hence, the value of a variable such as lesional vascularity may be low. Third, the accuracy of this diagnostic model with a cut off value of 0.44 could be limited because the actual prevalence of EC could not be reflected in this study population. Therefore, our current model needs to be further assessed for its diagnostic performance by using data from other populations.
In conclusion, more-than-half-depth involvement of the dermal layer, presence of “submarine sign,” and morphology has a strong association with EC. The “submarine sign” is a useful US marker for EC, even though it has not been validated with pathologic diagnosis in each case. The nomogram developed in our study is expected to contribute as a quantitative tool for the differential diagnosis of EC, thereby aiding therapeutic decision-making.

Notes

This study was supported by the National Research Foundation of Korea (NRF) grant funded by the MIST (Ministry of Science and ICT) of Korean government (2017R1A2B2011366).

Conflicts of Interest: The authors have no potential conflicts of interest to disclose.

References

1. Vincent LM, Parker LA, Mittelstaedt CA. Sonographic appearance of an epidermal inclusion cyst. J Ultrasound Med. 1985; 4:609–611. PMID: 3908709.
crossref
2. Lee HS, Joo KB, Song HT, Kim YS, Park DW, Park CK, et al. Relationship between sonographic and pathologic findings in epidermal inclusion cysts. J Clin Ultrasound. 2001; 29:374–383. PMID: 11579399.
crossref
3. Kim HK, Kim SM, Lee SH, Racadio JM, Shin MJ. Subcutaneous epidermal inclusion cysts: ultrasound (US) and MR imaging findings. Skeletal Radiol. 2011; 40:1415–1419. PMID: 21132291.
crossref
4. Stone MS. Cysts. In : Bolognia JL, Schaffer JV, Cerroni L, editors. Dermatology. 4th ed. New York, NY: Elsevier;2018. p. 1917–1929.
5. Benign neoplasms and hyperplasias. In : Wolff K, Johnson RA, Saavedra AP, Roh EK, editors. Fitzpatrick's color atlas and synopsis of clinical dermatology. 8th ed. New York, NY: McGraw-Hill Education;2017. p. 141–173.
6. López-Ríos F, Rodríguez-Peralto JL, Castaño E, Benito A. Squamous cell carcinoma arising in a cutaneous epidermal cyst: case report and literature review. Am J Dermatopathol. 1999; 21:174–177. PMID: 10218680.
7. Veenstra JJ, Choudhry S, Krajenta RJ, Eide MJ. Squamous cell carcinoma originating from cutaneous cysts: the Henry Ford experience and review of the literature. J Dermatolog Treat. 2016; 27:95–98. PMID: 26105203.
crossref
8. Antón-Badiola I, San Miguel-Fraile P, Peteiro-Cancelo A, Ortiz-Rey JA. [Squamous cell carcinoma arising on an epidermal inclusion cyst: a case presentation and review of the literature]. Actas Dermosifiliogr. 2010; 101:349–353. PMID: 20487691.
crossref
9. Hwang EJ, Yoon HS, Cho S, Park HS. The diagnostic value of ultrasonography with 5–15-MHz probes in benign subcutaneous lesions. Int J Dermatol. 2015; 54:e469–e475. PMID: 26148060.
crossref
10. Hung EH, Griffith JF, Ng AW, Lee RK, Lau DT, Leung JC. Ultrasound of musculoskeletal soft-tissue tumors superficial to the investing fascia. AJR Am J Roentgenol. 2014; 202:W532–W540. PMID: 24848846.
crossref
11. Nigam JS, Bharti JN, Nair V, Gargade CB, Deshpande AH, Dey B, et al. Epidermal cysts: a clinicopathological analysis with emphasis on unusual findings. Int J Trichology. 2017; 9:108–112. PMID: 28932061.
12. Apollos JR, Ekatah GE, Ng GS, McFadyen AK, Whitelaw SC. Routine histological examination of epidermoid cysts; to send or not to send? Ann Med Surg (Lond). 2016; 13:24–28. PMID: 28053700.
crossref
13. Kuwano Y, Ishizaki K, Watanabe R, Nanko H. Efficacy of diagnostic ultrasonography of lipomas, epidermal cysts, and ganglions. Arch Dermatol. 2009; 145:761–764. PMID: 19620556.
crossref
14. Wortsman X. Common applications of dermatologic sonography. J Ultrasound Med. 2012; 31:97–111. PMID: 22215775.
crossref
15. Wortsman X, Wortsman J. Clinical usefulness of variable-frequency ultrasound in localized lesions of the skin. J Am Acad Dermatol. 2010; 62:247–256. PMID: 19962214.
crossref
16. Kleinerman R, Whang TB, Bard RL, Marmur ES. Ultrasound in dermatology: principles and applications. J Am Acad Dermatol. 2012; 67:478–487. PMID: 22285673.
crossref
17. Toprak H, Kiliç E, Serter A, Kocakoç E, Ozgocmen S. Ultrasound and Doppler US in evaluation of superficial soft-tissue lesions. J Clin Imaging Sci. 2014; 4:12. PMID: 24744969.
crossref
18. Fornage BD, Tassin GB. Sonographic appearances of superficial soft tissue lipomas. J Clin Ultrasound. 1991; 19:215–220. PMID: 1646225.
crossref
19. Inampudi P, Jacobson JA, Fessell DP, Carlos RC, Patel SV, Delaney-Sathy LO, et al. Soft-tissue lipomas: accuracy of sonography in diagnosis with pathologic correlation. Radiology. 2004; 233:763–767. PMID: 15486212.
crossref
20. Lee MH, Kim NR, Ryu JA. Cyst-like solid tumors of the musculoskeletal system: an analysis of ultrasound findings. Skeletal Radiol. 2010; 39:981–986. PMID: 20186412.
crossref
21. Teefey SA, Dahiya N, Middleton WD, Gelberman RH, Boyer MI. Ganglia of the hand and wrist: a sonographic analysis. AJR Am J Roentgenol. 2008; 191:716–720. PMID: 18716098.
crossref
22. Feldman MK, Katyal S, Blackwood MS. US artifacts. Radiographics. 2009; 29:1179–1189. PMID: 19605664.
crossref
23. Huang CC, Ko SF, Huang HY, Ng SH, Lee TY, Lee YW, et al. Epidermal cysts in the superficial soft tissue: sonographic features with an emphasis on the pseudotestis pattern. J Ultrasound Med. 2011; 30:11–17. PMID: 21193700.
24. Mendelson EB, Böhm-Vélez M, Berg WA, Whitman GJ, Feldman MI, Madjar H, et al. ACR BI-RADS ultrasound. In : D'Orsi CJ, Sickles EA, Mendelson EB, Morris EA, editors. ACR BI-RADS atlas, breast imaging reporting and data system. 5th ed. Reston, VA: American College of Radiology;2013. p. 1–173.
25. Chau CL, Griffith JF. Musculoskeletal infections: ultrasound appearances. Clin Radiol. 2005; 60:149–159. PMID: 15664569.
crossref
26. Chang CD, Wu JS. Imaging of musculoskeletal soft tissue infection. Semin Roentgenol. 2017; 52:55–62. PMID: 28434505.
crossref
27. Turecki MB, Taljanovic MS, Stubbs AY, Graham AR, Holden DA, Hunter TB, et al. Imaging of musculoskeletal soft tissue infections. Skeletal Radiol. 2010; 39:957–971. PMID: 19714328.
crossref
28. Chandrasekaran V, Parkash S, Raghuveer CV. Epidermal cysts - a clinicopathological and biochemical study. Postgrad Med J. 1980; 56:823–827. PMID: 7267491.
crossref
29. Fullen DR. Cysts and sinuses. In : Busam KJ, Goldblum JR, editors. Dermatopathology. 2nd ed. Philadelphia, PA: Saunders;2016. p. 310–336.
30. Altman DG, Royston P. What do we mean by validating a prognostic model? Stat Med. 2000; 19:453–473. PMID: 10694730.
crossref
31. Steyerberg EW, Bleeker SE, Moll HA, Grobbee DE, Moons KG. Internal and external validation of predictive models: a simulation study of bias and precision in small samples. J Clin Epidemiol. 2003; 56:441–447. PMID: 12812818.
crossref
32. Yoon JH, Lee HS, Kim EK, Moon HJ, Kwak JY. A nomogram for predicting malignancy in thyroid nodules diagnosed as atypia of undetermined significance/follicular lesions of undetermined significance on fine needle aspiration. Surgery. 2014; 155:1006–1013. PMID: 24630147.
crossref
33. Bleeker SE, Moll HA, Steyerberg EW, Donders AR, Derksen-Lubsen G, Grobbee DE, et al. External validation is necessary in prediction research: a clinical example. J Clin Epidemiol. 2003; 56:826–832. PMID: 14505766.
34. Steyerberg EW, Vickers AJ, Cook NR, Gerds T, Gonen M, Obuchowski N, et al. Assessing the performance of prediction models: a framework for traditional and novel measures. Epidemiology. 2010; 21:128–138. PMID: 20010215.
35. Widmann G, Riedl A, Schoepf D, Glodny B, Peer S, Gruber H. State-of-the-art HR-US imaging findings of the most frequent musculoskeletal soft-tissue tumors. Skeletal Radiol. 2009; 38:637–649. PMID: 18846371.
crossref
36. Elston DM. Benign tumors and cysts of the epidermis. In : Elston DM, Ferringer T, Ko CJ, Peckham S, High WA, DiCaudo DJ, editors. Dermatopathology. 3rd ed. New York, NY: Elsevier;2019. p. 36–53.
37. Stavros AT. Sonographic evaluation of breast cysts. In : Stavros AT, editor. Breast ultrasound. Philadelphia, PA: Lippincott Williams & Wilkins;2004. p. 276–350.
38. Giess CS, Raza S, Birdwell RL. Distinguishing breast skin lesions from superficial breast parenchymal lesions: diagnostic criteria, imaging characteristics, and pitfalls. Radiographics. 2011; 31:1959–1972. PMID: 22084181.
crossref
39. Yuan WH, Hsu HC, Lai YC, Chou YH, Li AF. Differences in sonographic features of ruptured and unruptured epidermal cysts. J Ultrasound Med. 2012; 31:265–272. PMID: 22298870.
crossref
40. Jin W, Ryu KN, Kim GY, Kim HC, Lee JH, Park JS. Sonographic findings of ruptured epidermal inclusion cysts in superficial soft tissue: emphasis on shapes, pericystic changes, and pericystic vascularity. J Ultrasound Med. 2008; 27:171–176. quiz 177-178. PMID: 18204007.
Fig. 1

Flow chart illustrating patient selection.

EC = epidermal cyst, US = ultrasound
kjr-20-1409-g001
Fig. 2

“Submarine sign” of EC.

A. Illustration demonstrating “submarine sign,” which is defined when lesion shows focal protrusion of hypoechoic portion (b) from main mass (a) to epidermis (arrowhead). B. Photomicrograph (original magnification, × 400; hematoxylin-eosin stain) shows focal tract-like appearance (arrows) of EC and epidermis.
kjr-20-1409-g002
Fig. 3

Representative case of “submarine sign” in 54-year-old female with EC in back.

Focal protrusion of hypoechoic portion (arrowhead) from main mass appears as “submarine sign.” Arrows indicate delineation from adjacent hypodermal fat.
kjr-20-1409-g003
Fig. 4

Another representative case of “submarine sign” in 32-year-old male with EC in posterior neck.

Focal protrusion of hypoechoic portion (arrowheads) from main mass appears like “tract-to-skin sign.” It also counted as “submarine sign.” Arrows indicate delineation from adjacent hypodermal fat.
kjr-20-1409-g004
Fig. 5

Algorithm showing statistical analysis schema.

AUC = area under curve, ROC = receiver operating characteristic
kjr-20-1409-g005
Fig. 6

Nomogram visualizing diagnostic model for predicting of EC.

Point corresponding to each US feature can be determined using at uppermost scale (more-than-half-depth involvement of dermal layer = 48 [solid arrow]; “submarine sign” = 100 [dashed arrow]; and morphology = 68 [dotted and solid arrow]). Then, sum of all points is matched at scale of total point. Further, line drawn down from at that point helps calculate probability of EC. If calculated probability exceeds 0.44, it is considered highly likely to be EC.
kjr-20-1409-g006
Fig. 7

True positive example identified using developed nomogram.

A. US exam obtained from 26-year-old male patient revealed subcutaneous nodule in anterior chest wall involving more-than-half-depth of dermal layer, “submarine sign” (arrowhead), and no posterior acoustic enhancement. Its morphology does not fit any of morphological criteria. B. Total point which is taken from nomogram of patient is 148 (48 + 100 + 0 = 148). This point is converted to predicted probability of 0.756 by using calculation of equation. Similar numerical value is obtained via visual assessment of nomogram (bold arrow). This lesion is pathologically confirmed as EC.
kjr-20-1409-g007
Fig. 8

True negative example identified using developed nomogram.

A. Subcutaneous nodule in left calf of 30-year-old male patient is noted with internal cystic change and posterior acoustic enhancement on US exam. However, this lesion shows less than half-depth involvement of dermis and no “submarine sign.” Morphology of this lesion does not fit any of known typical morphology of EC. This mass was excised and was found to be schwannoma with cystic degeneration and hemorrhage. B. Total point obtained from nomogram of patient is 0 (0 + 0 + 0 = 0). As it yields predicted probability of 0.07 by using equation, visually assessed probability based on nomogram is less than 0.10 and lower than cut-off value of 0.44.
kjr-20-1409-g008
Fig. 9

Internal validation of diagnostic model.

A. Discrimination performance. Following ROC curve analysis for diagnostic model of EC was obtained in derivation set. AUC was 0.888 (95% CI, 0.825–0.950). B. Calibration ability. Dashed line was reference line where ideal diagnostic model would lie. Dotted line was calibration ability of diagnostic model, while solid line corrects for bias. 95% CI = 95% confidence interval
kjr-20-1409-g009
Fig. 10

External validation of diagnostic model.

A. Discrimination performance. In independent validation set, it was shown as following ROC curve analysis for diagnostic model of EC. AUC was 0.902 (95% CI, 0.832–0.972). B. Calibration ability. Soft and thickly drown diagonal line represents reference line where ideal diagnostic model would lie. Lines, that stand for calibration ability of diagnostic model in independent validation set with both logistic calibration (solid line) and nonparametric calibration (dotted line, using lowess), almost coincide with ideal reference.
kjr-20-1409-g010
Table 1

US Characteristics of Superficial Soft Tissue Lesions

kjr-20-1409-i001
US Characteristics Category Evaluation
More-than-half-depth involvement of dermal layer Presence or absence
Submarine sign: Focal protrusion to epidermis Presence or absence
Posterior acoustic enhancement Presence or absence
Posterior wall enhancement Presence or absence
Morphology: Alternating hypoechoic and hyperechoic concentric rings, predominantly hypoechoic lesion with central echogenic focus, lobulated lesion with area of varying echogenicity or pseudotestis pattern Presence or absence
Shape Oval, round or irregular
Margin Circumscribed, indistinct or lobulated
Echogenicity Hyperechogenicity, isoechogenicity or hypoechogenicity
Vascularity No visible vascularity, central vascularity or peripheral vascularity
Perilesional fat change Presence or absence

US = ultrasound

Table 2

Demographic Data of Derivation and Validation Sets

kjr-20-1409-i002
Variable Derivation Set Validation Set
Total (n = 112) EC (n = 56) Others (n = 56) P Total (n = 112) EC (n = 56) Others (n = 56) P
Age 40.6 ± 17.3 37.3 ± 16.3 43.9 ± 17.8 0.046 36.9 ± 16.0 37.0 ± 14.5 36.7 ± 18.5 0.949
Sex 0.848 0.003
 Female 65 (58.0) 32 (57.1) 33 (58.9) 33 (35.5) 14 (24.1) 19 (57.1)
 Male 47 (41.2) 24 (42.9) 23 (41.0) 60 (64.5) 44 (75.9) 16 (42.9)

Data for age are means ± standard deviation. Data for sex shows number of patients, with percentage in parentheses. EC = epidermal cyst

Table 3

Chi-Square Test or Fisher's Exact Test for Derivation and Validation Sets

kjr-20-1409-i003
Variable Derivation Set Validation Set
Total (n = 112) EC (n = 56) Others (n = 56) P Total (n = 93) EC (n = 58) Others (n = 35) P
More-than-half-depth of dermal layer involvement < 0.001 < 0.001
 Presence 69 (61.6) 47 (83.9) 22 (39.3) 67 (72.0) 52 (89.7) 15 (42.9)
 Absence 43 (38.4) 9 (16.1) 34 (60.7) 26 (28.0) 6 (10.3) 20 (57.1)
Submarine sign < 0.001 < 0.001
 Presence 45 (40.2) 40 (71.4) 5 (8.93) 40 (43.0) 36 (62.1) 4 (11.4)
 Absence 67 (59.8) 16 (28.6) 51 (91.1) 53 (57.0) 22 (37.9) 31 (88.6)
Posterior acoustic enhancement < 0.001 0.036
 Presence 78 (69.6) 49 (87.5) 29 (51.8) 72 (77.4) 49 (84.5) 23 (65.7)
 Absence 34 (30.4) 7 (12.5) 27 (48.2) 21 (22.6) 9 (15.5) 12 (34.3)
Posterior wall enhancement 0.115 0.004
 Presence 72 (64.3) 40 (71.4) 32 (57.1) 62 (66.7) 45 (77.6) 17 (48.6)
 Absence 40 (35.7) 16 (28.6) 24 (42.9) 31 (33.3) 13 (22.4) 18 (51.4)
Morphology < 0.001 < 0.001
 Presence 62 (55.4) 42 (75.0) 20 (35.7) 61 (65.6) 52 (89.7) 9 (25.7)
 Absence 50 (44.6) 14 (25.0) 36 (64.3) 32 (34.4) 6 (10.3) 26 (74.3)
Shape 0.047 0.025
 Oval 71 (63.4) 39 (69.6) 32 (57.1) 63 (67.7) 45 (77.6) 18 (51.4)
 Round 9 (8.0) 1 (1.8) 8 (14.3) 4 (4.3) 2 (3.5) 2 (5.7)
 Irregular 32 (28.6) 16 (28.6) 16 (28.6) 26 (28.0) 11 (19.0) 15 (42.9)
Margin 0.443 0.061
 Circumscribed 79 (70.5) 40 (71.4) 39 (69.6) 68 (73.1) 47 (81.0) 21 (60.0)
 Indistinct 14 (12.5) 5 (8.9) 9 (16.1) 16 (17.2) 8 (13.8) 8 (22.9)
 Lobulated 19 (17.0) 11 (19.6) 8 (14.3) 9 (9.7) 3 (5.2) 6 (17.1)
Echogenicity 0.470 < 0.001
 Hyper- 7 (6.3) 2 (3.6) 5 (8.9) 9 (9.7) 0 (0.0) 9 (25.7)
 Iso- 25 (22.3) 14 (25.0) 11 (19.6) 21 (22.6) 15 (25.9) 6 (17.1)
 Hypo- 80 (71.4) 40 (71.4) 40 (71.4) 63 (67.7) 43 (74.1) 20 (57.1)
Vascularity 0.198 < 0.001
 Negative 15 (13.4) 7 (12.5) 8 (14.3) 53 (57.0) 30 (51.7) 23 (65.7)
 Central 34 (30.4) 13 (23.2) 21 (37.5) 13 (14.0) 3 (5.2) 10 (28.6)
 Peripheral 63 (56.3) 36 (64.3) 27 (48.2) 27 (29.0) 25 (43.1) 2 (5.7)
Perilesional fat change 0.004 0.119
 Presence 51 (45.5) 33 (58.9) 18 (32.1) 36 (38.7) 26 (44.8) 10 (28.6)
 Absence 61 (54.5) 23 (41.1) 38 (67.9) 57 (61.3) 32 (55.2) 25 (71.4)

Data are number of patients according to each US features, with percentage in parentheses.

Table 4

Inter-Reader Agreement on US Features from Kappa Statistics (95% CI)

kjr-20-1409-i004
Variable κ (95% CI)
More-than-half-depth involvement of dermal layer 0.91 (0.82–0.99)
Submarine sign 0.91 (0.83–0.99)
Posterior acoustic enhancement 0.77 (0.64–0.90)
Posterior wall enhancement 0.90 (0.82–0.99)
Morphology 0.93 (0.86–0.99)
Shape 0.93 (0.86–0.99)
Margin 0.84 (0.74–0.94)
Echogenicity 0.88 (0.78–0.97)
Vascularity 0.92 (0.86–0.99)
Perilesional fat change 0.85 (0.76–0.95)

Data are κ values with 95% CIs in parentheses. 95% CI = 95% confidence interval

Table 5

Logistic Regression for US Features Predicting EC among Superficial Soft Tissue Lesions in Derivation Set

kjr-20-1409-i005
Variable Univariable Analysis Multivariable Analysis
OR (95% CI) P OR (95% CI) P
More-than-half-depth involvement of dermal layer 8.07 (3.31–19.70) < 0.001 3.35 (0.99–11.25) 0.051
Presence of submarine sign 25.5 (8.61–75.56) < 0.001 12.2 (3.46–42.82) < 0.001
Presence of morphology 5.40 (2.39–12.20) < 0.001 5.44 (1.82–16.22) 0.002
Presence of posterior acoustic enhancement 6.52 (2.52–16.85) < 0.001
Presence of posterior wall enhancement 1.88 (0.86–4.11) 0.117
Presence of perilesional fat change 3.03 (3.18–6.56) 0.005

Data in parentheses are 95% CIs. OR = odds ratio

Table 6

Estimation of Diagnostic Model by Using Cut-Off Value of 0.44

kjr-20-1409-i006
True Positive TrueNegative False Positive False Negative AUC (95% CI) Sensitivity (95% CI) Specificity (95% CI) Accuracy (95% CI)
Derivation set 46 48 8 10 0.888 (0.825–0.950) 82.1 (72.1–92.2) 85.7 (76.5–94.9) 83.9 (77.1–90.7)
Validation set 53 27 8 5 0.902 (0.832–0.972) 91.4 (84.2–98.6) 77.1 (63.2–91.1) 86.0 (79.0–93.1)

Data on true positive, true negative, false positive and false negative are number of patients. Data on sensitivity, specificity and accuracy are percentage with 95% CI in parentheses. AUC = area under curve

Table 7

Comparison of Predictive Power of Single Image Variable

kjr-20-1409-i007
Variable AUC (95% CI)
More-than-half-depth involvement of dermal layer 0.723 (0.642–0.804)
Submarine sign 0.813 (0.742–0.883)
Posterior acoustic enhancement 0.679 (0.599–0.758)
Morphology 0.696 (0.611–0.782)

Data in parentheses are 95% CIs.

TOOLS
Similar articles