

 PDF
PDF ePub
ePub Citation
 Print
Print


Introduction
Cerebrovascular disease mortality ranks as the second most common cause of death around the world,1) but, in Korea, cerebrovascular disease is the leading cause of death among single -organ diseases.2)3) Every year approximately 105000 people experience a new or recurrent stroke and more than 26000 people die.2) Fortunately, there have been great improvements in the management of stroke over the last decades. Among the Organization for Economic Cooperation and Development (OECD) member countries, Korea recorded the lowest in-hospital, 30-day case-fatality rate for ischemic stroke and the third lowest rate for hemorrhagic stroke in 2009.2)4) Understanding cerebrovascular disease mortality trends is important to reduce the health burden. Mortality trends of cerebrovascular diseases have been reported in many countries including Korea.5)6)7) However, there are only a few studies reporting long-term trends in mortality from cerebrovascular diseases in the Korean population. Thus, we examined the 30-year changing pattern of cerebrovascular disease mortality in Korea to further understand and quantify recent trends in mortality by analyzing the Cause of Death statistics from Statistics Korea.
Subjects and Methods
Annual mortality data were obtained from the Korean Statistical Information Service managed by Statistics Korea (former the Korea National Statistical Office). Mortality statistics with cause of death information have been available since 1983. Causes of death were coded according to the International Classification of Disease, 10th Revision. For the purpose of this study, deaths from cerebrovascular disease (I60-69) were further classified into hemorrhagic stroke (I60-62), cerebral infarction (I63), unspecified stroke (I64), and other cerebrovascular diseases (I65-69). Hemorrhagic stroke included subarachnoid hemorrhage (I60), intracerebral hemorrhage (I61), and other nontraumatic intracranial hemorrhage (I62). Mortality rates from total heart diseases (I00-13 and I20-51) and ischemic heart disease (I20-25) were previously reported.8)
Crude and age-adjusted mortalities were calculated only for cerebrovascular disease, hemorrhagic stroke, and cerebrovascular disease, because reported numbers of deaths from unspecified stroke and other cerebrovascular diseases showed great fluctuation in the 1990s and early 2000s, probably due to changes in classifying causes of death. We calculated age-adjusted mortality through a direct standardization method using the age distribution of the Korean population in 2000 as the standard population. We analyzed data using 10-year age intervals and the same population structure for standardization in men and women to compare mortality by sex. We also presented penalized B-Splines to explore the non-linear pattern of the crude death rate and age-adjusted death rate per 100000 over time in years. Penalized regression methods are used to quantify the notion of roughness of a curve through a suitable penalty function and the necessary compromise between bias and variability in curve fitting can be explicit in estimation of the problem.9)
Results
Numbers of deaths from cerebrovascular disease
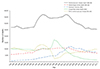
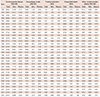
Table 1 and Fig. 1 show the number of deaths from cerebrovascular diseases for each year. The absolute number of deaths from cerebrovascular disease did not change much between 1983 and 1990, but it increased rapidly in the early 1990s then stayed high until 2002. However, after 2002, the number of deaths from cerebrovascular disease has consistently declined. The number of deaths from cerebrovascular disease was 26922 in 1983, peaked at 37131 in 1994, and decreased to 25447 by 2013. Number of deaths from hemorrhagic stroke peaked in 2002, while deaths from cerebral infarction reached its peak in 2004. In 1983, deaths from hemorrhagic stroke (n=5549) were almost 8 times more common than deaths from cerebral infarction (n=703). However, since 2003, cerebral infarction has been the most common cause of death among cerebrovascular diseases. The number of deaths from unspecified stroke increased steeply between 1996 and 1998, but it rapidly decreased until recently since 1998.
Crude and age-adjusted mortality from cerebrovascular disease
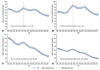
The crude mortality rate from cerebrovascular disease showed fluctuating patterns until 2002, but thereafter it decreased. In the 1980s, the crude mortality rate for men was higher than for women, but the gender difference gradually decreased and has reversed since 1991. The crude mortality rate from cerebrovascular disease in 1983 was 73.3 per 100000 in men and 61.5 per 100000 women. In 2012, the crude mortality rate per 100000 was 49.2 for men and 53.1 for women. After the highest crude mortality rate in 1994, there were 33% and 14% mortality decreases in men and women, respectively, until 2012.
Age-adjusted mortality rates from cerebrovascular disease has decreased too, until recently, but the rate has been always higher in men than in women. In 1983, the age-adjusted mortality rate for men was about 2 times higher than for women (124.3 vs. 68.1 per 100000). But the sex difference has gradually reduced to 28.7 per 100000 men and 17.2 per 100000 women in 2012 (Fig. 2).
Crude and age-adjusted mortality from hemorrhagic stroke
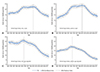
Crude mortality rate from hemorrhagic stroke showed upward trends between 1983 and 2001. But, after 2001, the rate has rapidly decreased. The crude mortality rate for men was higher than for women until 1991, but thereafter the rate for women was higher than men. In 1983, the crude mortality rate from hemorrhagic stroke per 100000 was 15.8 for men and 11.9 for women, but the corresponding rate was 13.3 for men and 13.7 for women in 2012. After the highest mortality rate in 2001, there was about a 39.8% decrease in men and 41.5% decrease in women until 2012.
Age-adjusted hemorrhagic stroke mortality rate peaked in 1994, then the rate decreased in both men and women. Unlike crude mortality, the age-adjusted mortality rate has been consistently higher in men than in women. The age-adjusted hemorrhagic stroke mortality rate per 100000 was 24.4 for men and 14.2 for women in 1983. However, the corresponding rate decreased to 8.6 for men and 5.8 for women by 2012. After the highest age-adjusted mortality rate in 1994, there was a 68.1% decrease in men and a 41.5% decrease in women until 2012 (Fig. 3). It is also notable that crude hemorrhagic stroke mortality peaked in 2001, but the age-adjusted mortality peaked much earlier in 1994.
Crude and age-adjusted mortality rates from cerebral infarction
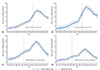
Crude mortality rate from cerebral infarction increased until 2004. But, thereafter, the rate has rapidly decreased. Crude mortality rate per 100000 was 1.9 for men and 1.6 for women in 1983, which increased to 22.3 in men and 26.3 for women in 2004, then decreased to 13.8 for men and 16 for women by 2012. After the highest age-adjusted mortality rate in 2004, there was a 30.7% decrease in men and 32.2% decrease in women.
Age-adjusted cerebral infarction mortality rates peaked in 2003. Unlike crude mortality, the age-adjusted cerebral infarction mortality rate has been consistently higher in men than in women. After the highest age-adjusted mortality in 2003, there was about 61.8% decrease in men and 65.6% decrease in women (Fig. 4). Figures without penalized regression splines for cerebrovascular diseases are provided as supplemental data (Supplementary Figs. 1 to 3 in the online-only Data Supplement).
Discussion
Our study reports the death rate of major cerebrovascular diseases in the Korean population and their trends over the last 30 years. The age-standardized mortality rate from cerebrovascular diseases has significantly decreased since 1983 in Korea and the decline in mortality from cerebrovascular diseases was more prominent in men than women. Over the last three decades, the age-adjusted mortality rate from cerebrovascular diseases decreased, but temporarily increased between 1991 and 1993. This fluctuation might be due to changes of classification of the Cause of Death Statistics in Korea. During the same time period, deaths from hypertensive disease (I10-I15) significantly decreased.8)
In most developed countries, cerebrovascular disease had been among the leading causes of death in the past, but it has decreased in recent decades.10)11) In particular, Australia, New Zealand, and the UK showed a continuous decline in cerebrovascular disease mortality since 1950. The United States showed a steep declining trend since the 1970s and the trend was more prominent in men than women.10)11)12) Among Asian countries, Japan had the highest cerebrovascular disease mortality in the 1950s (433 per 100000 in men in 1957), but the rate significantly decreased to less than 100 per 100000 by 2004.6)10) Recent studies reported that the stroke mortality rate of Korea was double that of Japan in the beginning of the 2000s,10) although both Japan and Korea showed decreasing mortality trends for stroke at that time.13)
A number of studies reported the accelerated decline in stroke mortality during the late 1970s and the early 1980s. Among them, some earlier studies reported declining trends in the stroke incidence rate as well as stroke fatalities during the 1970s,14)15) suggesting that the effect of stroke incidence rate on stroke mortality.14) However, there was no significant association between stroke mortality and stroke incidence in Sweden.15) This study reported that a decline of mortality from stroke may be due to a decline of smoking and blood pressure (BP) together with an increase in the use of anti-hypertensive treatments rather than changes of stroke incidence.15) Accordingly, it may be because acute stroke events have become less severe and the survival rate of stroke patients is increasing.
The successful control of risk factors may have contributed to declining incidence and fatality of stroke, which may lead to the decreasing trends of stroke mortality.16)17) In most populations, hypertension is the most attributable factor for cerebrovascular disease.18)19)20) In a previous study analyzing data from 1998-2011 available in the Korea National Health Nutrition Examination Survey (KNHANES),21) the age-adjusted prevalence of hypertension decreased by 0.2 to 0.3 percent annually. The study reported that mean systolic BP level decreased by 8 mmHg in men and by 10 mmHg in women during this period which suggested that decreasing BP was largely due to lowered BP levels among patients with diagnosed hypertension.21) The improved BP control might contribute to the remarkable decrease in stroke mortality in Korea. In another systematic review of data from Korean or other populations, the attributable risk of hypertension for ischemic stroke was 19.9 to 30.5% in men and 17.1 to 26.6% in women.22) At ages 40 to 69, usual BP is directly related to stoke mortality in a meta-analysis of clinical trials.23) On the other hand, a few studies were unconvincing that improvement in control of hypertension resulted in a decline of mortality from stroke.24) However, according to a meta-analysis of clinical trials in 1992, anti-hypertensive treatment reduced fatal strokes by 33% and cardiovascular mortality by 22%.25)26) The use of cholesterol-lowering medications also decreased stroke risk and mortality in observational studies and clinical trials.27)28) Improved acute stroke management might also contribute to the mortality decline.7) Between 1998 and 2002, the prevalence of hypertension decreased, whereas the prevalence of hypercholesterolemia significantly increased in both sexes.4) Smoking rate decreased only in men, whereas the prevalence of diabetes did not change over time. Another study reported epidemiologic trends of ischemic stroke between 2002 and 2010, by analyzing data from the Korean Stroke Registry.29) Patient's age steadily increased, while prevalence of risk factors such as hypertension, diabetes, and smoking declined. Although cerebrovascular disease mortality rate has decreased over the last 30 years, cerebrovascular disease still remains a great burden to society and is a major cardiovascular risk factor prevalent among Koreans. To further reduce the burden of cerebrovascular disease, we need to monitor the trends of mortality from cerebrovascular disease and its subcategories, because management and prevention strategies for different stroke types vary.
The major strength of the present study is that it analyzed nationwide mortality data covering 30 years in the Korean population. But, there are also several limitations to be discussed. First, validity of cause of death can be debated. The Statistics Korea report annually the Cause of Death Statistics, and the database are primarily based on the death certificates. A previous study retrospectively compared the Cause of Death Statistics with hospital medical records, and reported the overall accuracy of causes of death as 91.9%.30) Second, there are still a significant number of deaths recorded without underlying causes in the Death Statistics. In 2012, 9.4% of deaths were classified as unknown, although the deaths by unknown causes are decreasing. Thus there is a possibility of underestimation of mortality from cerebrovascular disease. Third, the reported number of cerebrovascular deaths can be influenced by the health care system. Over the last decades, Korea experienced marked improvement in medical service accessibility and health care technologies. These changes might affect the reported number of cerebrovascular diseases. Lastly, there is no available nationwide data on the incidence of cerebrovascular disease, so we cannot explore the underlying causes of changing mortality trends.
In conclusion, cerebrovascular disease mortality has significantly decreased over the last 30 years, but remains a great health burden and the prevalence of major for cardiovascular risk factors are still highly prevalent in Korea. We need to continuously monitor the trends of mortality from cerebrovascular disease and its subcategories to further reduce cerebrovascular disease burdens.
 XML Download