

 PDF
PDF ePub
ePub Citation
 Print
Print


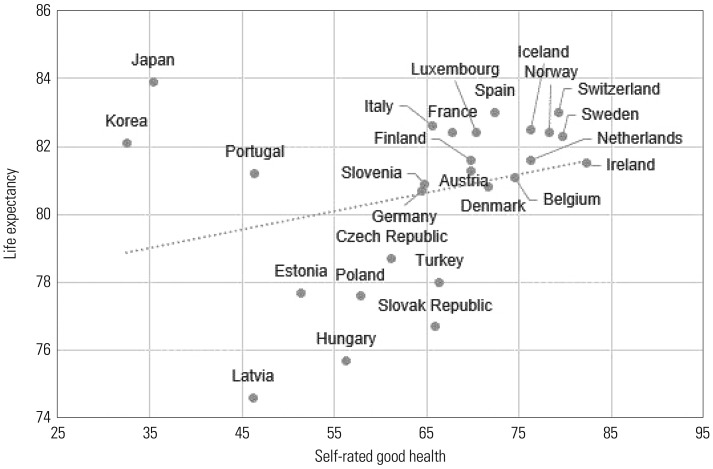
With advanced economies, Japan and Korea have encountered a common public health paradox: high life expectancy (LE) combined with low self-rated health (SRH).1 Japan has had one of the highest LEs in the world since the mid-1970s (84.0 years in 2016),2 while Korea is expected to have the highest LE by 2030, particularly among women (57% probability for a LE greater than 90 years in 2030).3 Meanwhile, among the 26 Organization for Economic Co-operation and Development (OECD) countries with data on responses to the same SRH questions in 2015, good SRH at the population level was directly associated with higher LE (Fig. 1). However, Japan and Korea show a unique pattern, in which the percentage of people who report good health is disproportionately low despite having high LE. Whenever OECD health statistics are published, this puzzling juxtaposition of the highest LE and the lowest SRH receives media coverage.45 Since SRH is an important subjective health status indicator, understanding the reasons for poor SRH relative to LE is of public health importance.
This work was inspired by Amartya Sen6 who found that, although LE was higher in the United States, reported levels of poor health were also disproportionately higher there than in Bihar, India. It was suggested that the patterns of LE and SRH observed in the United States and Bihar (India) could be explained through healthcare utilization: Americans use healthcare more, so they come to be aware of their poor health more.
A few findings from single-country studies have shown a mixed directionality for this association: Healthcare utilization was related to better SRH in two middle/low-income countries,78 whereas it was linked to worse SRH in two high-income countries.910 Preventive healthcare service users tended to rate their health more positively than non-users in Turkey.7 Similarly, low utilization of healthcare services was associated with lower SRH among people in the Armavir region of Armenia.8 In contrast, a cross-sectional study in Canada revealed that more frequent doctor visits (i.e., the self-reported number of visits and telephone conversations with dentists, doctors and specialists, nurses, chiropractors, and physiotherapists and having an overnight hospital stay) were associated with poorer SRH among adults in Ontario.9 A longitudinal study in Norway showed that a higher level of healthcare attendance at baseline was linked to poorer SRH four years later among adolescents in the Nord-Trøndelag county.10
Healthcare utilization is high in Japan and Korea, which have the highest per capita numbers of annual doctor consultations worldwide (16.0 in Korea as of 2015 and 12.7 in Japan as of 2014).1 Frequent utilization of healthcare may well constitute a major cultural aspect of health and healthcare in Japan and Korea. Both countries operate a universal healthcare scheme with a fee-for-service reimbursement system that provides free access to healthcare providers and promotes supplier-induced demand. Both countries also operate nationwide health screening programs. Under these circumstances, overdiagnosis and overtreatment have emerged as major national concerns.1112 Against this backdrop, we sought to explain this high-LE-low-SRH paradox in Japan and Korea by examining the associations among LE, the prevalence of good SRH, and healthcare utilization. We hypothesized that countries with more frequent healthcare use would demonstrate poorer SRH and that SRH would not show a meaningful association with LE among developed countries.
This study utilized Health at a Glance 2017 report by the OECD.1 This publication covers 35 OECD member countries and partner countries, including Brazil, China, Colombia, Costa Rica, India, Indonesia, Lithuania, the Russian Federation, and South Africa. Cross-nationally comparable data are updated each year (e.g., the publication in 2017 contains data collected in 2015 or the nearest year) based on administrative sources and nationally representative datasets, such as the European Union Statistics on Income and Living Conditions. Its sub-fields consist of 1) health status as the ultimate goal of health systems, 2) risk factors for health, and 3) indicators of healthcare system performance, including access to care, quality and outcomes of care, health expenditures, health workforce, healthcare activities, the pharmaceutical sector, and aging and long-term care. The target population is adults aged 15 and over, although the details vary from variable to variable. This article does not report on any studies with human participants performed by any of the authors.
LE, or LE at birth, estimates how long people will live based on a given set of age-specific death rates in a society. SRH is measured using the question, “How is your health in general?” Answers are generally reported as very good, good, fair, poor, and very poor. Very good and good are categorized as good SRH, while poor and very poor are labelled as poor SRH. Countries using dissimilar forms of the SRH question, such as four response categories instead of five, were excluded from this study (e.g., the US). The number of doctor consultations per capita refers to the average frequency of contact with a physician (generalists and specialists) in a society. The methodologies used to operationalize these variables slightly differ; for example, in Hungary, visits for computed tomography and magnetic resonance imaging scans are included as contacts with a doctor, which is not the case in other countries. The variables are, nonetheless, constructed to enable reliable comparisons across countries.
Ultimately, 26 countries with valid and comparable information on LE, SRH, and the number of doctor consultations per capita were included in this study. These 26 countries employed the same five response categories with regard to SRH and did not have missing values for any of the three variables analyzed herein (LE, SRH, and the number of doctor consultations per capita). We utilized the same numerical values that appeared in Health at a Glance 2017, without cleaning or otherwise altering the original values. The average LE was 80.6 years (SD=2.47 years), with a minimum value of 74.6 years (Latvia) and a maximum of 83.9 years (Japan) (Table 1). On average, 64.7% of the study population thought their health was in a good condition (SD=13.24%), with Sweden having the highest rate (82.3%) and Korea the lowest (32.5%). The mean number of doctor consultations per capita was 7.4 (SD=3.13). As with good SRH, visits to a doctor were least common in Sweden (2.9), while Korea saw the largest number (16.0) (detailed profile of each country is in Supplementary Table 1, only online).
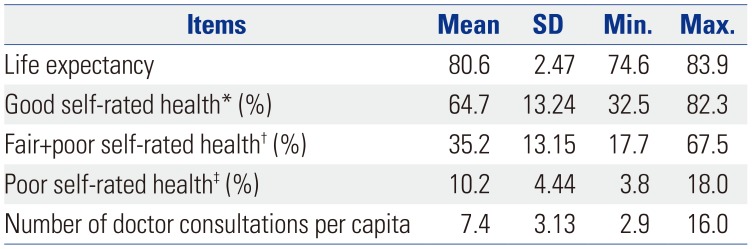
Table 1
Summary Statistics of Life Expectancy, Self-Rated Health, and Number of Doctor Consultations Per Capita (n=26)
![]()
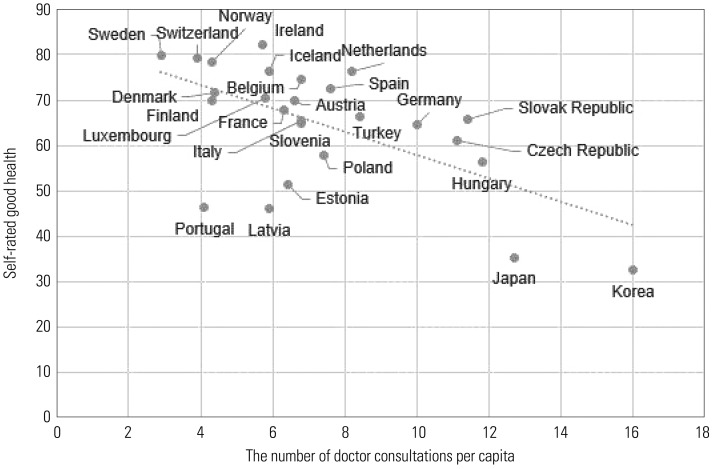
The relationships among LE, good SRH, and the number of doctor consultations per capita were examined by conducting Pearson's correlation analyses. The relationship between the frequency of doctor consultations and SRH was first analyzed to develop the argument that greater healthcare utilization is correlated with poorer subjective health. Then, the association between doctor consultations and LE was tested to show that more frequent healthcare use is not necessarily related to high LE in advanced economies. Among the 26 OECD countries, the number of annual doctor consultations per capita and the prevalence of good SRH were closely correlated (correlation coefficient=−0.610; p=0.001; Fig. 2). When we excluded the three outlier countries (Portugal, Latvia, and Estonia), the correlation coefficient was −0.839 (p<0.001). When we replaced good SRH with poor SRH, the magnitude of the coefficient marginally decreased, but remained high (0.521; p=0.006; Supplementary Fig. 1, only online). In addition, the exclusion of the three outlier countries resulted in a stronger correlation (0.799; p<0.001), suggesting that increased healthcare utilization is associated with perceptions of poorer SRH.
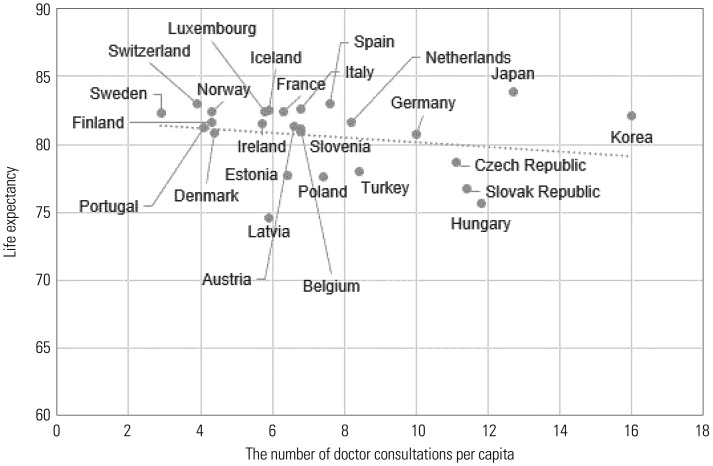
Moving to the relationship between annual per capita doctor consultations and LE, we found that the correlation coefficient was quite low (−0.216; p=0.289; Fig. 3). This suggested that more frequent use of healthcare services in developed countries where basic health care needs are met is not necessarily associated with an increased LE, the most objective measurement of health. This contrasts with the aforementioned finding, which showed a tightly intertwined relationship between healthcare utilization and poorer SRH.
This study was conducted to explain the high-LE-low-SRH paradox in Japan and Korea, and the results suggested that the low prevalence of good SRH could be related to a high level of healthcare utilization. Regarding the low SRH found in Japan and Korea, several alternative explanations could be suggested. A tendency for Asians to provide midpoint responses on surveys has been reported in studies on general survey response patterns.1314 However, this does not explain the findings of our study because our analyses using both good SRH and poor SRH resulted in the same conclusion.
Socioeconomic factors might also be considered as an explanation, as unfavorable social conditions may lead to an increased prevalence of mental health problems (e.g., depressive symptoms) and associated healthcare utilization. For example, the Guardian has reported on the high poverty rate and suicide rate among Korean older adults, despite the high LE, calling this phenomenon “South Korea's inequality paradox.”15 Japan also has shown relatively high suicide and poverty rates in comparison to other industrialized countries.1617 However, the correlation between LE and suicide rate1 was low (−0.127; p=0.536; Supplementary Fig. 2, only online). Furthermore, the relationship between LE and good SRH barely changed (from 0.292 to 0.271; p=0.147 and 0.190, respectively) after controlling for suicide rate. In addition, Japan and Korea are considered to be relatively equitable countries in terms of income inequality. The existence of other social problems is not a sufficient explanation of these findings.
A prior Korean study examining socioeconomic differences in SRH may support our analysis of the association between healthcare utilization and poor SRH.18 With the expansion of national health insurance, the prevalence of poor SRH increased. Prior to the full introduction of the Korean universal health insurance system in 1989, educational inequality in SRH was not evident in women. In both men and women, the magnitude of inequality increased with the expansion of the national health insurance system. It should be noted that individuals of high socioeconomic status report poorer health than those of low socioeconomic status in many underdeveloped countries that lack universal health insurance.1920 With the expansion of national health insurance in Korea, individuals of low socioeconomic status are able to obtain greater access to health services, receive diagnoses, and report ill health, resulting in an increase in the prevalence of poor SRH and widening socioeconomic inequalities in SRH.
Differences in health systems, as exemplified by the National Health Service in the United Kingdom, may result in dissimilar levels of healthcare utilization. When countries with a tax-based health financing system (Denmark, Finland, Iceland, Ireland, Italy, Norway, Portugal, Spain, and Sweden) were excluded,21 the analysis demonstrated the same results: LE and good SRH were positively related, albeit very slightly (0.159; p=0.543); the number of doctor consultations and good SRH exhibited a clearer association (−0.643; p=0.005); and LE and the number of doctor consultations were hardly associated (−0.029; p=0.911).
This analysis is based on an ecological study employing national-level statistics. Therefore, the results of this analysis should not be interpreted as associations at the individual level, which would follow an ecological fallacy. In addition, further investigations using multi-national individual-level datasets in developed countries are necessary to draw stronger conclusions. Nonetheless, we consider this study a meaningful attempt to shed light on the paradox that exists in Japan and Korea regarding high LE and low SRH. While good SRH is related to better LE at the individual level within a population, this is not true at the national level. Frequent use of healthcare in Japan and Korea was strongly correlated with poorer SRH, without any meaningful correlation with LE. Excessive healthcare utilization may play a crucial role in contributing to low SRH in these two countries.
Moreover, the high-LE-low-SRH paradox and its potential explanation in terms of healthcare utilization found in Japan and Korea may also be applicable to differences in LE, SRH, and healthcare utilization between men and women. At the individual level, SRH is closely related to mortality in both men and women.22 A prior Korean study also showed that SRH is a good predictor of mortality in both men and women.23 Although SRH is worse in women than in men, LE in women is generally higher than in men. This may be related to the fact that women utilize healthcare more than men. Further investigations should be expanded to explain sex differences in SRH, LE, and healthcare utilization.
In conclusion, the findings of this study suggest the possibility that poor SRH is associated with healthcare utilization in advanced societies. Although SRH is a reliable indicator of general health conditions and a useful predictor of mortality,232425 caution is needed when applying it in the social settings of developed countries, such as Japan and Korea.
 XML Download