

 PDF
PDF ePub
ePub Citation
 Print
Print


INTRODUCTION
Compared to the past, hospital mortality of critically ill patients admitted to the intensive care unit (ICU) has continued to decrease, owing to advances in critical medicine and patient management.123 In other words, the number of ICU survivors is continuing to increase. However, ICU survivors experience posttraumatic stress, depression, cognitive impairment, and physical weakness; and are known to have poorer long-term survival outcomes compared to the general population.145 Therefore, improving the long-term outcomes of ICU survivors remains a very important issue today.67 Nevertheless, it is a very challenging task which requires the efforts of individual patients, their guardians, and the society as a whole.89
Financial burden is one of the biggest and most common stress factors that ICU survivors face while experiencing critical illness.10 This burden also impacts their caregivers, and is a serious problem that can cause psychological stress. A recent observational study conducted in two academic hospitals in New York City reported that race or ethnicity was not associated with long-term mortality among ICU survivors, while insurance status was closely associated.11 In other words, the lack of insurance coverage was associated with increased mortality among ICU survivors, and thus this study has emphasized the need for the provision of appropriate financial coverage for ICU survivors. However, it remains uncertain whether complete financial coverage through the insurance system can improve long-term mortality among patients with lower economic status, since there has been no study to date on this topic. Determining whether the long-term outcomes of ICU survivors with lower economic status can be sufficiently improved through financial support may be helpful in establishing suitable policies targeting these ICU survivors.
Accordingly, the objective of the present study was to investigate whether complete financial coverage by the national insurance system for patients with lower economic status is associated with improvement of 1-year mortality after ICU discharge. We hypothesized that ICU survivors with lower economic status, who receive complete financial coverage, will experience an improvement in 1-year mortality after ICU discharge, as compared to regular patients.
MATERIALS AND METHODS
Ethical statement, design, and setting
This retrospective cohort study was conducted with approval from the Institutional Review Board (IRB) of Seoul National University Bundang Hospital (SNUBH) (IRB approval number: B-1902/522-105). Considering the nature of a retrospective cohort study that involves analysis of medical records of patients who have already completed their treatment, the requirement for informed consent was waived by the IRB.
Data source
The present study used electronic health records stored in Seoul National University Bundang Hospital Electronic System for Total Care (BESTCare), which is the electronic medical record system of SNUBH, as the data source.12 Moreover, the date of death and cause of death of all patients, including follow-up loss patients, were collected from the database of Statistics Korea (http://kostat.go.kr/portal/eng). The causes of death were classified according to the Korean standard classification of disease and cause of death (KCD) 7th edition supplied by Statistics Korea.
Study population
The study population in the present study consisted of discharged adult ICU survivors who were 18 years or older and had been admitted to the ICU between January 2012 and December 2016. Only the last ICU admission of patients who had been admitted to the ICU more than once was considered for analysis. Among the ICU survivors, foreign patients who were not enrolled in the insurance system of South Korea, patients admitted to the ICU with industrial accident compensation insurance or car insurance, as well as patients with incomplete or missing medical records, were excluded from the analysis.
Health insurance system in South Korea as an independent variable
Since 1989, all South Korean citizens have been required to enroll in the National Health Insurance (NHI) system provided by the government.13 Most citizens pay a fixed rate of health insurance premium based on their income, with approximately 2/3 of their medical expenses subsidized by the government. In addition, foreigners who stay in South Korea for a certain period (6 months or longer) may also enroll for NHI service. However, patients who are too poor to pay their insurance premium or have difficulty in financially supporting themselves belong to the medical aid program (MAP), through which the government covers almost all medical expenses to reduce the burden of medial cost on these patients. Specifically, the patients in MAP were classified as type 1 MAP and type 2 MAP depending on their income, property, and other factors. Specifically, type 1 MAP patients included workers with inability to work, households with rare incurable diseases, recipients of subsidized housing, patients of national merit, and North Korea defectors. Type 2 MAP group included low-income people unable to live independently, but not meeting the type 1 MAP conditions. The government pays for 100% of the medical costs for patients in type 1 MAP group, and 85% of costs for those in type 2 MAP group. According to a recent Profile of National Cohort in South Korea, the percentage of males and females enrolled in the total MAP was 2.5% and 3.4%, respectively.14
Study endpoints
The primary endpoint in the present study was 1-year mortality after ICU discharge. The secondary endpoint was the cause of death (e.g., cardiovascular disease, cancer, neurological disease, injury, or trauma) related to the 1-year mortality after ICU discharge.
Covariates
Data collected included 1) physical characteristics [sex, age, and body mass index (BMI, kg/m2)]; 2) information regarding socioeconomic status [highest educational attainment (lower than high school/more than or equal to high school, lower than college/more than or equal to college) and marital status (unmarried/ married or living with someone/divorced or separated/ widowed)], 3) Acute Physiology and Chronic Health Evaluation (APACHE) II; 4) comorbidities [hypertension, diabetes mellitus, history of coronary disease and cerebrovascular disease, liver disease (hepatitis, liver cirrhosis, and fatty liver), chronic obstructive lung disease, chronic kidney disease, and cancer]; and 5) admitting department (internal medicine or emergency medicine/neurologic center/cardiothoracic surgical department/ other surgical department). For collection of comorbidity-related information, International Classification of Disease 10th Revision (ICD-10) diagnostic system was used in this study.
Statistical analysis
Baseline characteristics of the ICU survivors were presented as the mean with standard deviation or numbers with percentage. First, we performed propensity score (PS) matching, which is known to minimize the influence of confounders in cohort studies.15 PS matching was performed using the nearest neighbor method with 1:3 ratio and no replacement by caliper 0.2. Absolute value of standardized mean difference (ASD) was used to assess the balance between NHI and MAP groups before and after PS matching. All covariates (age, BMI, sex, highest educational attainment, marital status, APACHE II, hypertension, diabetes mellitus, history of coronary artery disease and cerebrovascular disease, liver disease, chronic obstructive lung disease, chronic kidney disease, cancer, admitting department, and year of ICU discharge) were included in PS model. Our goal was to match all confounders between the two groups to obtain an ASD of <0.1 through PS matching. After confirming a good balance between the two groups in the PS-matched cohort, we performed stratified Cox regression analysis for 1-year mortality after ICU discharge for conditional Cox regression. We also performed a competing risk analysis to investigate differences in hazard between NHI and MAP groups, based on the four types of 1-year mortality according to the cause of death (death related to cardiovascular disease, cancer, neurologic disease, or injury or trauma) in the PS-matched cohort.
Next, we performed a multivariable Cox regression analysis on the entire cohort for the following two reasons: first, to determine whether the findings in the PS-matched cohort were generalizable for the entire cohort; and second, to determine the associations with 1-year mortality in the same context as all covariables without dividing the ICU survivors by insurance type. Additionally, we performed Cox regression analysis in both PS-matched cohort and entire cohort after multivariable adjustment by dividing the total MAP group into two groups (Type 1 MAP and Type 2 MAP) for sensitivity analysis. Finally, the overall survival times after ICU discharge of MAP group and NHI group are presented as Kaplan-Meir curves generated from data before and after PS matching, and log-rank test was used to test statistical significance. All resulting values of the Cox regression models are presented as hazard ratios (HRs) and confidence intervals (CIs), and the log-minus-log plot function was used to determine whether each Cox proportional hazard model satisfied the central assumption. Concordance (C) statistics were used to identify the C-index of the multivariable Cox regression model. All analyses were performed using R software (version 3.6.0; R Foundation for Statistical Computing, Vienna, Austria), and p<0.05 was considered statistically significant.
RESULTS
Between January 2012 and December 2016, there were 34245 total ICU admissions involving 25079 unique patients. After excluding multiple ICU admissions of the same patient (n=9166), the last episode of ICU admissions of 25079 patients were included in the analysis. From this patient population, the following patients were excluded: 4925 children aged under 18 years; 108 foreigners not covered by insurance; 300 patients admitted to the ICU with industrial accident compensation insurance or car insurance; 323 patients discharged from the ICU after December 2016; 1505 patients who died during their stay in the ICU; and 148 patients with incomplete or missing medical records. As a result, 17770 ICU survivors were included in the analysis, with 17130 patients (96.4%) in NHI group and 640 patients (3.6%) in MAP group. After performing PS matching to balance the two groups, a total PS matching of 2495 ICU survivors (NHI group: 1859; MAP group: 636) were included in the final analysis (Fig. 1). Comparison results of the characteristics of ICU survivors between NHI and MAP groups before and after PS matching are shown in Table 1. After PS matching, two groups were well-balanced with ASD <0.1, while the distribution of PS after PS matching was similar to that before PS matching (Supplementary Fig. 1, only online).
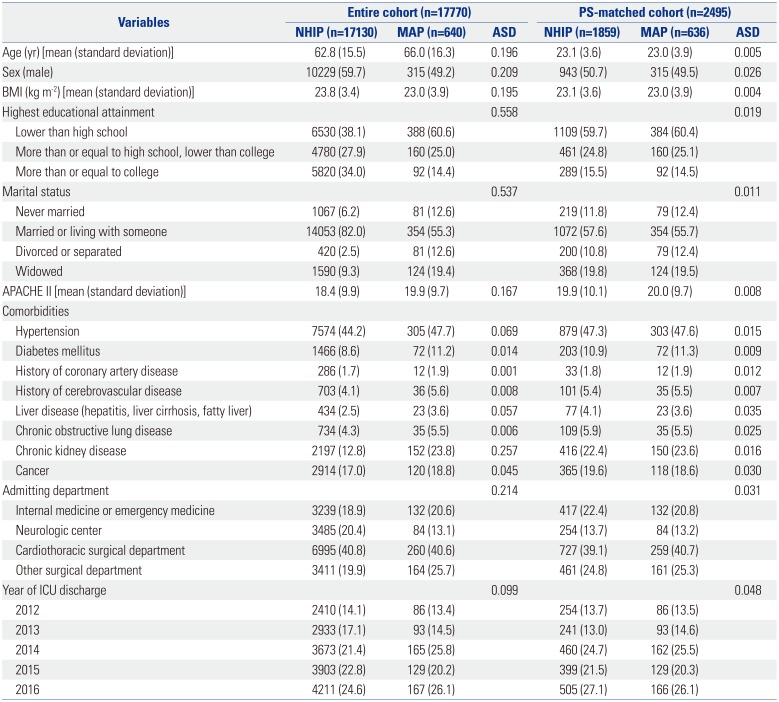
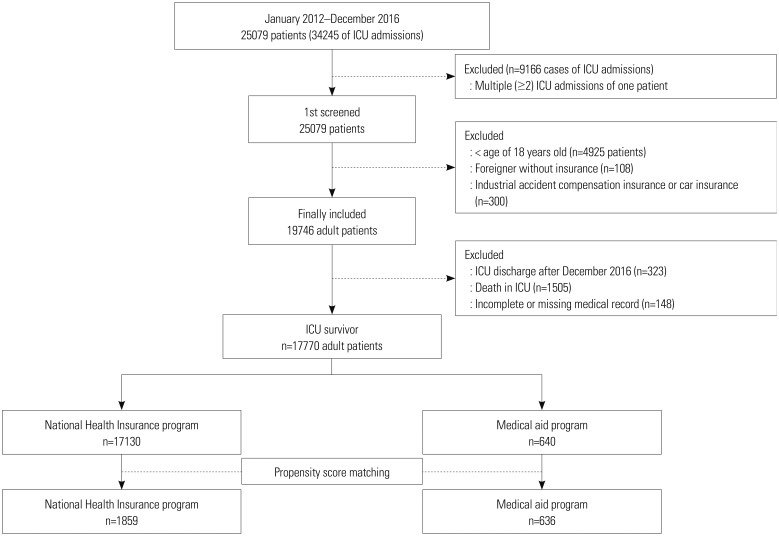
Table 1
Characteristics of ICU Survivors before and after Propensity Score Matching
ICU, intensive care unit; PS, propensity score; ASD, absolute value of standardized mean difference; BMI, body mass index; APACHE, Acute Physiology and Chronic Health Evaluation.
Data are presented as number (percentage) or mean (standard deviation) unless otherwise indicated. Patients in the medical aid program (MAP) were those classified to have low income, and most of their hospital charges were paid by the government. Meanwhile, for patients in the National Health Insurance program (NHIP), approximately two-thirds of their hospital charges were covered by the government.
![]()
Survival analysis after PS adjustment
The analysis results of 1-year mortality among ICU survivors in PS-matched cohort are shown in Table 2. The results showed 1-year mortality of 289/1880 (15.5%) and 127/636 (20.0%) in NHI and MAP groups, respectively. In the stratified Cox regression model, MAP group showed 1.31-fold higher 1-year mortality than NHI group (HR: 1.31, 95% CI: 1.06 to 1.61; p=0.012). Kaplan-Meir curves for 1-year mortality before (A) and after (B) PS matching are shown in Fig. 2, in which MAP group showed significantly poorer survival probability than NHI group both before and after PS matching (Fig. 2A, p<0.001; and Fig. 2B, p=0.011 by log-rank test). In sensitivity analysis in PS-matched cohort, type 1 MAP group showed 1.36-fold higher 1-year mortality (HR: 1.36, 95% CI: 1.10 to 1.68, p=0.004), while type 2 MAP group did not show significant 1-year mortality, compared to NHI group (p=0.168). A competing risk analysis using the PS-matched cohort showed that 1-year mortality rates after ICU discharge due to cardiovascular disease, cancer, neurological disease, and injury or trauma were not significantly different between the two groups (all p>0.05 in Table 2).
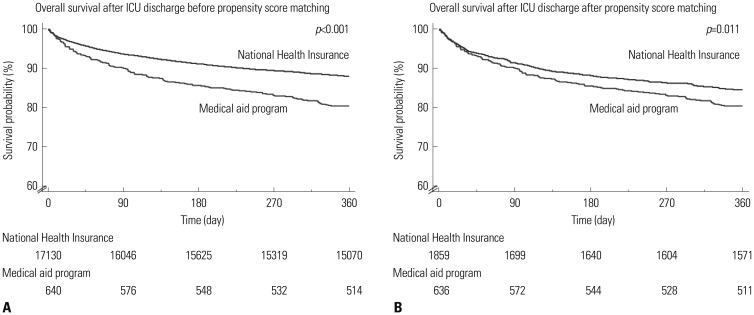
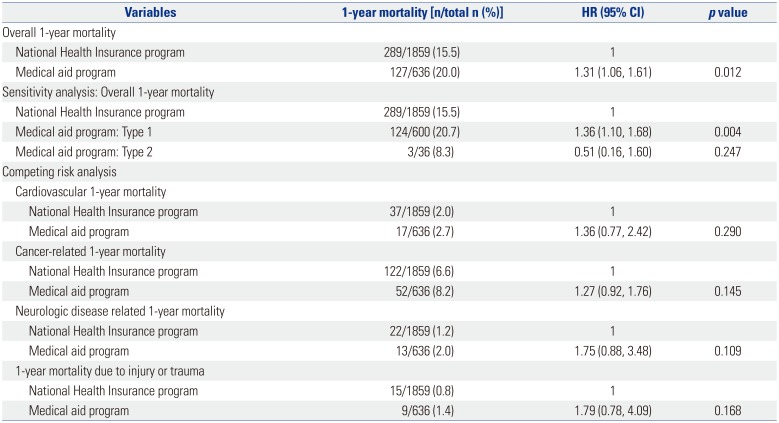
Fig. 2
Kaplan-Meir curve of overall survival after intensive care unit (ICU) discharge before (A) and after (B) propensity score matching.
![]()
Table 2
Survival Analysis in the Propensity Score-Matched Cohort
![]()
Survival analysis after multivariable adjustment in entire cohort
The results of sensitivity analysis using multivariable Cox regression models for the entire cohort are presented in Table 3. MAP group showed 1.26-fold higher 1-year mortality than NHI group (HR: 1.26, 95% CI: 1.05 to 1.51, p=0.015). C-index of multivariable model was 0.82 (95% CI: 0.81 to 0.83). In sensitivity analysis using the entire cohort, type 1 MAP group showed 1.25-fold higher 1-year mortality (HR: 1.25, 95% CI: 1.04 to 1.51, p=0.017), while type 2 MAP group did not show significant 1-year mortality compared to NHI group (p=0.574).
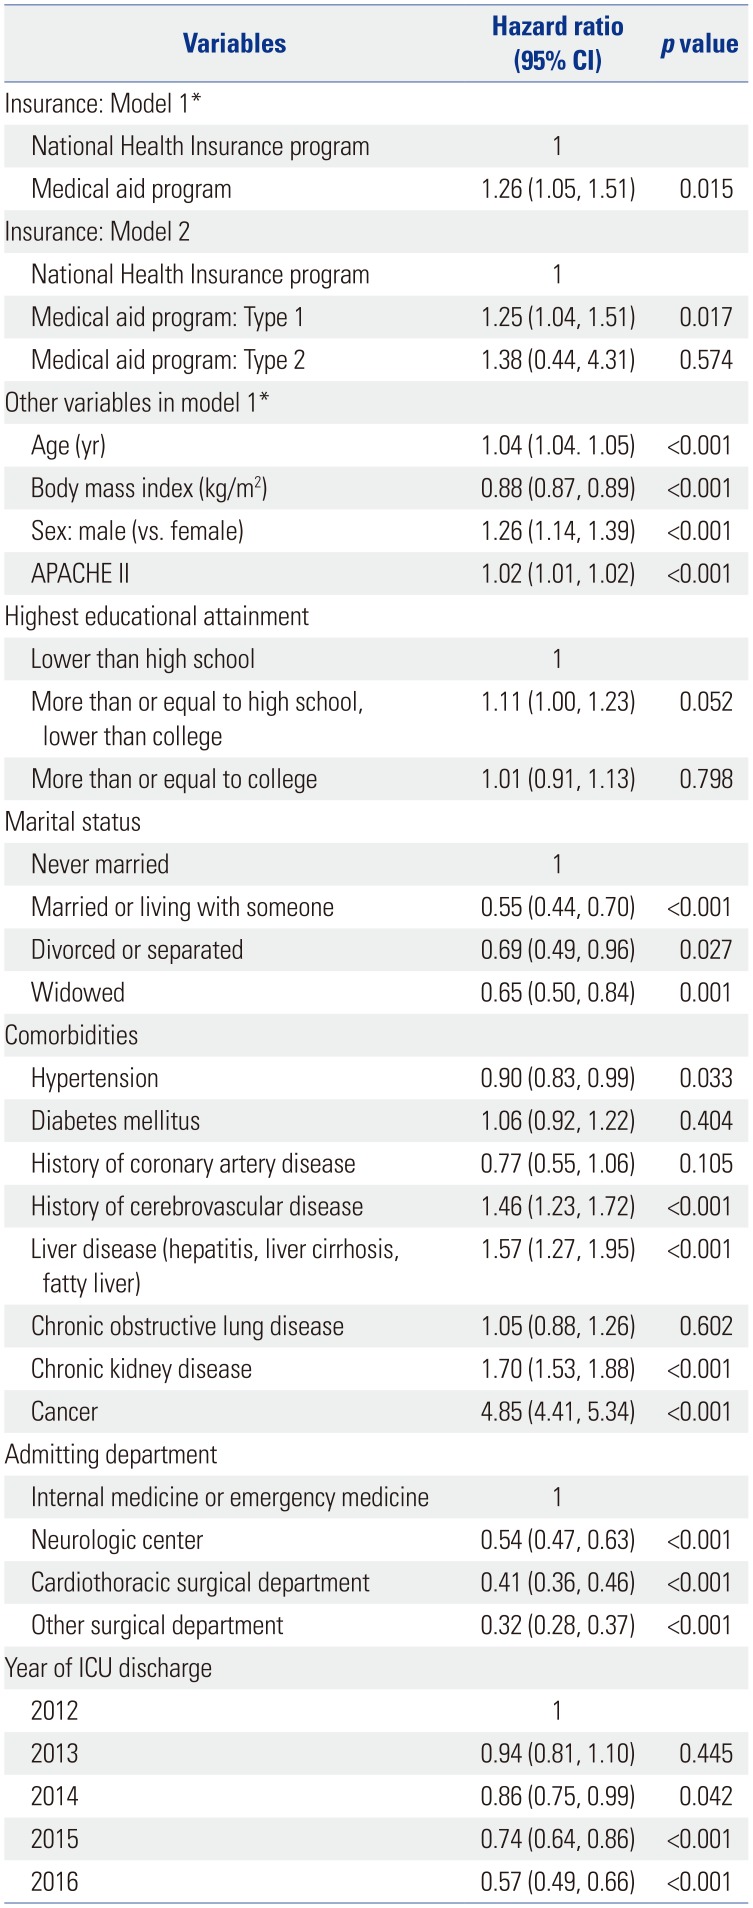
Table 3
Multivariable Cox Regression Model for 1-Year Overall Mortality in Entire Cohort
![]()
DISCUSSION
The findings in the present study showed that the ICU survivors in MAP group, who were poor but received financial coverage from the government for most of their medical expenses, experienced higher 1-year mortality after ICU discharge compared to other ICU survivors in NHI group. Additionally, this association was more pronounced in type 1 MAP group, who might represent more difficult economic circumstances than type 2 MAP group. In other words, the findings in the present study showed that providing financial coverage alone cannot improve the long-term outcomes of ICU survivors with lower economic status, and that a more nuanced and multifaceted policy approach is needed for such patients. A competing risk analysis revealed no significant difference in specific cause of death between the two groups.
Despite sufficient financial coverage, the higher 1-year mortality among ICU survivors with lower economic status has many reasons. The first reason is the issue of frailty, which is the loss of physiologic or cognitive reserve. Recent reports have indicated that patients with lower socioeconomic status tend to be more frail.1617 Pre-ICU admission frailty status is a scale that can predict the prognosis of ICU survivors,18 while increase in such frailty is known to be associated with increase in long-term mortality.19 It is possible that pre-ICU admission frailty may have been more common among patients with lower economic status in the present study (MAP group), which may be associated with higher 1-year mortality among ICU survivors in MAP group.
Second, the utilization of healthcare source may have been different between MAP and NHI groups. According to the behavioral model by Andersen,20 three major factors that trigger the utilization of health care source are individual needs, enabling factors, and predisposing factors. In the present study, MAP group addressed the enabling factor by receiving financial coverage; however, because marital status or final educational attainment was matched through PS, predisposing factor did not have a significant influence on healthcare utilization. Therefore, the possible source of problem in the present study may have been individual needs of the patients. ICU survivors commonly experience unplanned hospital readmissions after discharge;21 as a result, they often require continued health care utilization. In addition, strict compliance to prescribed medication would be essential for improving long-term outcomes of ICU survivors. While additional studies may be needed on this topic, patients with lower economic status in MAP group may have had little need for treatment, despite having sufficient financial coverage.
Another noteworthy finding was in the multivariable Cox regression models including all covariates. Overall, 1-year mortality increased independently in patients with comorbidities such as cancer, chronic kidney disease, cerebrovascular disease, or liver disease. Such finding was consistent with previous studies reporting that preexisting comorbidity played an important role in the prognosis of ICU survivors.21 Moreover, the unmarried group in this study showed the association of independently increased 1-year mortality compared to married group. This finding was consistent with previous studies reporting that the role and burden of caregivers may be higher for ICU survivors;22 moreover, when the behavioral model by Andersen was applied, family was found to be an important predisposing factor on the outcomes of ICU survivors.20 As a result, the significance of the present study is that it used PS matching to investigate the association between complete financial coverage for ICU survivors with very low economic status and 1-year mortality, and revealed factors associated with insurance status through multivariable Cox models including various variables.
Our study implies that insurance status, such as MAP or NHI, was not determinative of long-term mortality among ICU survivors, though it might reflect the patients' level of frailty upon returning to community. As previous studies reported, insurance status reflects the level of frailty, especially when it is representative of economic status.2324 Therefore, association between MAP group and increased 1-year mortality after ICU discharge should be interpreted carefully in this context. Additionally, our sensitivity analysis showed that type 1 MAP group, and not type 2 MAP group, was associated with higher 1-year mortality, despite receiving a higher level of financial coverage rate than type 2 MAP group. These results suggest that frailty status upon ICU discharge has more predictive value than financial coverage.
The present study had some limitations. First, the limitation of using a retrospective cohort design may have caused some selection bias. Second, since this was a single-center, single-country study, the findings cannot be generalized. As South Korea has relatively good insurance coverage for its citizens through its NHI service, direct comparisons with other countries would be difficult. Third, the proportion of patients with lower economic status belonging to MAP group was very small in the present study, and it was inevitable that a lot of samples were discarded through PS matching in this study. Fourth, we did not consider the difference in income levels of patients within NHI group, as specific and individual income level was not collected at our institution to protect the privacy of individual patients. The spectrum of economic status represented by NHI group might be broad, which might affect our results. Lastly, since the two groups differed in economic status, the treatments received in the ICU might be different. For example, MAP group would not have received the same treatment as non-reimbursable ones. Therefore, the lack of analysis of the treatment levels associated with insurance types was an important limitation of this study.
In conclusion, this retrospective cohort study showed that ICU survivors with low economic status experience higher 1-year mortality. Our results suggest the necessity of a more nuanced and multifaceted approach to policy for ICU survivors with low economic status.
 XML Download