Journal List > Yonsei Med J > v.60(10) > 1133226

Yoon, Kim, Kim, Choo, Park, Seo, and For the Alzheimer's Disease Neuroimaging Initiative: Distinct Neural Correlates of Executive Function by Amyloid Positivity and Associations with Clinical Progression in Mild Cognitive Impairment

Abstract

Purpose

This study aimed to identify the neural basis of executive function (EF) in amnestic mild cognitive impairment (aMCI) according to beta-amyloid (Aβ) positivity. Furthermore, we explored if the identified brain areas could serve as predictors for clinical progression.

Materials and Methods

We included individuals with aMCI using data from [18F]-florbetapir-positron emission tomography (PET), fluorodeoxyglucose-PET, and EF scores, as well as follow-up clinical severity scores at 1 and 5 years from baseline from the Alzheimer's Disease Neuroimaging Initiative database. The correlations between EF score and regional cerebral glucose metabolism (rCMglc) were analyzed separately for aMCI with low Aβ burden (aMCI Aβ−, n=230) and aMCI with high Aβ burden (aMCI Aβ+, n=268). Multiple linear regression analysis was conducted to investigate the associations between rCMglc and clinical progression.

Results

Longitudinal courses differed between aMCI Aβ− and aMCI Aβ+ groups. On average, aMCI Aβ− subjects maintained their level of clinical severity, whereas aMCI Aβ+ subjects showed progression. EF impairment in aMCI Aβ− was related to the anterior cingulate cortex (ACC), whereas that in aMCI Aβ+ was related to Alzheimer's Disease-vulnerable brain regions. ACC and the posterior cingulate cortex were associated with clinical progression in aMCI Aβ− and aMCI Aβ+, respectively.

Conclusion

Our findings suggest that although MCI subjects showed similar behavioral phenotypes at the time of diagnosis, EF and further progression were associated with different brain regions according to Aβ burden. Clarification of the etiologies and nature of EF impairment in aMCI are critical for disease prognosis and management.

INTRODUCTION

Mild cognitive impairment (MCI) is an intermediate state between normal aging and dementia, with evidence of cognitive impairment but preserved functional independence.1 MCI has various etiologies, leading to its heterogeneous neuropsychological profile2 and biomarker positivity patterns.3 In particular, a considerable proportion (36–46%) of individuals with MCI showed low levels of beta-amyloid (Aβ) deposition.45 In addition, the clinical course of MCI is also diverse. MCI is not always a prodromal form of AD; it can be any type of dementia, and can remain stable over a long period of time6 or may even be reversible.7 For example, based on 41 robust cohort studies on MCI progression,8 overall annual conversion rate was around 6.7% for all kinds of dementia, 6.5% for AD dementia, and 1.6% for vascular dementia. A considerable number of MCI cases were not progressed to dementia for more than 10 years follow-up.8
Although memory deficit is generally considered an early cognitive alteration associated with MCI, other cognitive deficits are also widely observed in MCI. Notably, previous MCI studies have reported executive dysfunction91011 and frontal lobe alteration.12 Executive function (EF) encompasses a set of top-down cognitive processes to support goal-directed behavior.13 Consequently, EF and memory could influence each other.14 As Seo, et al.11 pointed out, memory and EF are closely related. More importantly, EF is an important cognitive domain in prognosis and dementia conversion. For example, previous works showed EF impairment years prior to MCI1115 or AD diagnosis.16 Compared to MCI with higher EF, MCI with lower EF is more often converted to AD after 1 year.14 Moreover, EF test, not episodic memory tests, combined with regional cerebral glucose metabolism (rCMglc), has high predictability for conversion from normal to MCI or AD dementia.16 Taken together, previous studies suggest the important role of EF as an early warning system in the clinical course of MCI.
Nevertheless, only a limited number of studies have directly investigated the functional neural correlates for EF impairment in MCI populations. One functional imaging study reported that connectivity strengths in dorsolateral prefrontal cortex (DLPFC) and anterior cingulate cortex (ACC) were associated with EF in MCI.17 In terms of AD population, EF impairment was correlated with rCMglc in parietotemporal and prefrontal regions.18 Findings from structural brain studies on MCI also suggested a correlation between parietotemporal and prefrontal regions and EF.1920 However, little attention has been paid to the nature of EF impairment in MCI with pathophysiologies other than AD; i.e., MCI with low Aβ burden. It is plausible that EF failure in MCI depends on different neural substrates according to their etiologies.
[18F]-fluorodeoxyglucose positron emission tomography (FDG-PET) is a valuable index of synaptic function that provides information to understand underlying neurodegenerative pathology.21 It is a commonly used methodology for evaluation of the brain-cognition relationship and early detection of dementia.22 A recent meta-analysis of nine FDG-PET studies suggested that hypometabolism in posterior cingulate cortex (PCC) and precuneus (PreCu) were the most reliable and robust markers for early detection of and tracking conversion from MCI to AD.23 Hypometabolism in ACC was also related to clinical progression, but it was much less reliable.23 These areas could be acceptable candidate imaging biomarkers of clinical progression.
Therefore, this study aimed to identify the functional neural basis of EF impairment in MCI separately for Aβ positivity. Furthermore, we explored whether the identified functional brain areas could serve as predictors for clinical progression.

MATERIALS AND METHODS

Participants

Data on individuals with MCI were selected from the Alzheimer's Disease Neuroimaging Initiative (ADNI) database (adni.loni.usc.edu). For detailed explanation of the ADNI, please refer http://www.adni-info.org. The diagnosis criteria for MCI in ADNI database were clinical dementia rating (CDR)24 of 0.5, Mini-Mental State Examination (MMSE) scores between 24 and 30, a memory complaint with objective memory loss as defined by logical memory test score but showing no impairment in other cognitive domains, preserved activities of daily living, and nondemented.25 Therefore, MCI from ADNI database were all amnestic MCI (aMCI). The inclusion criteria for the current study were described previously.26 Briefly, individuals with aMCI who had conducted [18F]-florbetapir-PET and FDG-PET, as well as clinical and cognitive assessment. The final analysis included 498 individuals who received baseline clinical evaluation and PET scans between April 2010 and December 2013. Among these 498 individuals with MCI, follow-up diagnosis and CDR sum of boxes (CDR-SOB) at 1 year later, which were assessed between March 2011 and June 2014, were collected to obtain information on clinical progression. CDR-SOB covers six domains of cognitive and daily functioning, with a score ranging from 0 to 18. It is a useful tool for staging clinical severity. In addition, renewed diagnosis and CDR-SOB at 5 years later, which were assessed between March 2015 and December 2018, were also collected to obtain information on longer clinical progression. To control for the interval time, we included subjects who had an evaluation visit at 54–66 months from baseline date.

EF measures and other clinical information

ADNI composite scores for EF (ADNI-EF)27 were selected to measure EF. This score was developed using factor analysis on the measures including Digit Symbol Substitution and Digit Span Backwards from the revised Wechsler Adult Intelligence Scale, Trail Making Tests A and B, Category Fluency, and Clock Drawing Test. Therefore, ADNI-EF score covered a wide range of EF components. The score was standardized with a mean of 0 and a standard deviation of 1, based on the 800 subjects in ADNI.27 Higher score meant better EF in MCI. For everyday functioning, we included the Functional Assessment Questionnaire (FAQ), which assessed the instrumental activities of daily living with a score ranging from 0 to 30. For global cognition, MMSE score was included. Information on apolipoprotein E (APOE) genotypes was also collected.

Florbetapir PET

We obtained the mean florbetapir standardized uptake value ratio (SUVR) for each participant. A detailed description of florbetapir PET acquisition and processing can be found on ADNI website (http://adni.loni.usc.edu/methods/pet-analysis-method/pet-analysis/) or in previously published reports.28 Briefly, the subject's first florbetapir image was co-registered to their magnetic resonance image and segmented into Free-surfer (version 4.5.0, Athinoula A. Martinos Center for Biomedical Imaging at Massachusetts General Hospital, Massachusetts, MA, USA; https://surfer.nmr.mgh.harvard.edu/)-defined cortical regions (frontal, anterior/posterior cingulate, lateral parietal, and lateral temporal). Next, the mean florbetapir uptake from these gray matter regions was extracted relative to the uptake in the whole cerebellum. Participants were classified as aMCI with low Aβ burden (aMCI Aβ−) or aMCI with high Aβ burden (aMCI Aβ+) according to SUVR cut-off of 1.11 for amyloid positivity.28

FDG-PET preprocessing

We collected the most preprocessed form of FDG-PET data from ADNI to investigate the relationship between ADNI-EF and rCMglc. ADNI-PET protocol was strictly followed in each site. ADNI preprocessing steps of FDG-PET data were previously described.25 Briefly, a quality control process was applied to all scans, which included assessment of image resolution and uniformity, checks for statistical noise, motion assessment across temporal frames, and visual checks for common artifacts. Then, using the original raw PET images, the different temporal frames were co-registered. All image sets, including dynamic image and single-frame averaged image sets, were reoriented to a common spatial orientation and interpolated onto a uniform image grid. To reduce inter-scanner differences (17 different scanner models from three vendors), the images were smoothed with a scanner-specific filter derived from each site's Hoffman phantom, and then provided a common isotropic resolution of 8-mm full-width at half-maximum resolution.25 We further preprocessed for group-level analysis. These scans were adjusted for their origin, and spatially normalized to the Montreal Neurological Institute (MNI, McGill University, Montreal, Canada) space using Statistical Parametric Mapping 12 (SPM12) (Institute of Neurology, University College of London, London, UK) implemented in MATLAB (MathWorks; Massachusetts, MA, USA). They were then smoothed with a Gaussian kernel of 8-mm full-width at half-maximum. Finally, global normalization using proportional scaling was performed, as it has a higher signal to noise compared to that of cerebellar count normalization.29
A region of interest (ROI)-based approach was also applied to investigate the association between rCMglc and clinical progression. The automatic anatomic labeling (AAL) algorithm and a region-combining method were applied to set ROIs to measure regional brain metabolism in the bilateral ACC (AAL template No. 31–32), bilateral PCC (AAL template No. 35–36), and bilateral PreCu (AAL template No. 67–68).30

Statistical analysis

The correlations between ADNI-EF and rCMglc were analyzed separately for aMCI Aβ− and aMCI Aβ+ groups using a multiple regression model with age, sex, education, and APOE genotype as covariates. Statistical threshold was set at p<0.001, uncorrected for multiple comparisons, with an extent threshold of greater than 50 contiguous voxels. CDR-SOB was further added as a covariate to the multiple regression model to control for clinical severity. These analyses were performed using SPM12 (Institute of Neurology, University College of London).
Demographic and clinical data were compared between groups by separate one-way analysis of variance (ANOVA) and χ2 tests for continuous and categorical variables, respectively. Multiple linear regression analysis was conducted to investigate the associations between rCMglc and clinical progression as measured by CDR-SOB at 1 year later. Age, sex, education, and APOE ε4 genotype were included in the first step using the “Enter” method to control for their effects on CDR-SOB; then, ACC, PCC, and PreCu metabolism were included using the “Stepwise” method. Additional multiple linear regression analysis was also conducted to investigate the associations between rCMglc and further clinical progression (CDR-SOB) 5 years later. These analyses were performed using SPSS version 25.0 (IBM Corp., Armonk, NY, USA), and p values <0.05 were considered statistically significant.

Ethics statement

Institutional Review Boards approved the study procedures across institutions participating in ADNI. Written informed consent to share data for scientific research purposes was obtained from each participant. A request for access to data was approved by the ADNI Data and Publication Committee (https://adni.loni.usc.edu/wp-content/uploads/how_to_apply/ADNI_DSP_Policy.pdf). The institutional review board of Chosun University also approved the present study (IRB no. 2-1041055-AB-N-01-2017-28).

RESULTS

Participant characteristics at baseline and follow-up

Based on mean SUVR, aMCI group was divided into aMCI Aβ− (n=230) and aMCI Aβ+ (n=268). The demographic and clinical characteristics of the 498 subjects are presented in Table 1. No group differences in sex or education were found; however, aMCI Aβ− group was younger than aMCI Aβ+ group. APOE ε4 carriers were more frequent among aMCI Aβ+ subjects. CDR-SOB, FAQ, MMSE, and ADNI_EF scores were significantly worse in aMCI Aβ+ group compared to those in aMCI Aβ− group. Among them, 409 (82.1%) subjects completed evaluations at 1 year later. Individuals with aMCI Aβ+ (n=253, 94.4%) were more followed than aMCI Aβ− (n=156, 67.8%) (χ2df=1= 59.564, p<0.001) at the 1-year follow-up (Table 1). The 5-year follow-up analysis included 120 (24.1%) subjects. Remaining subjects were not followed up after 1 year (n=56), or were followed up but were not included in the analysis due to longer (n=38) or shorter (n=195) follow-up intervals than 5.0±0.5 years.
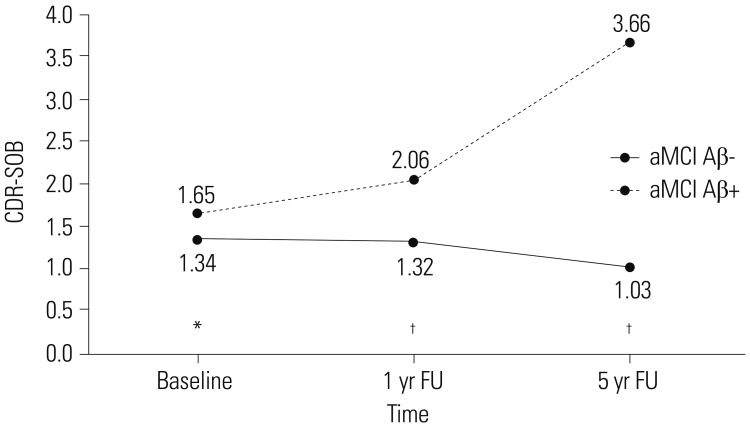
Changes in CDR-SOB scores are shown in Fig. 1. These scores did not differ between baseline and one- and 5-year follow-up in aMCI Aβ− group, whereas these scores were significantly increased from baseline to 1 year (p<0.001) and between the one and 5-year follow-ups (p<0.001) in aMCI Aβ+ group. CDR-SOB scores in aMCI Aβ− group were significantly lower than those in aMCI Aβ+ group (baseline, p=0.01; one- and 5-year follow-up, p<0.001). In aMCI Aβ− group, three individuals converted to dementia but seven reverted to cognitively normal (CN) status at the 1-year follow-up, and no individuals had additionally converted to dementia but nine had reverted to CN at the 5-year follow-up. In aMCI Aβ+ group, 33 converted to dementia but six reverted to CN at the 1-year follow-up, and 28 additionally converted to dementia and four reverted to CN at the 5-year follow-up.

Relationship between ADNI-EF and rCMglc at baseline

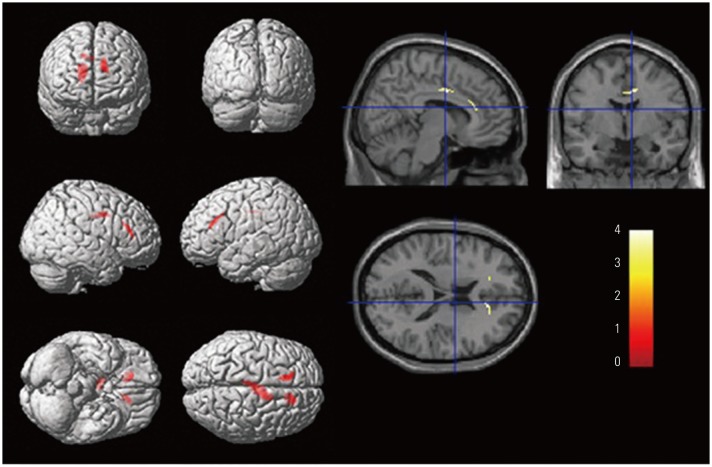
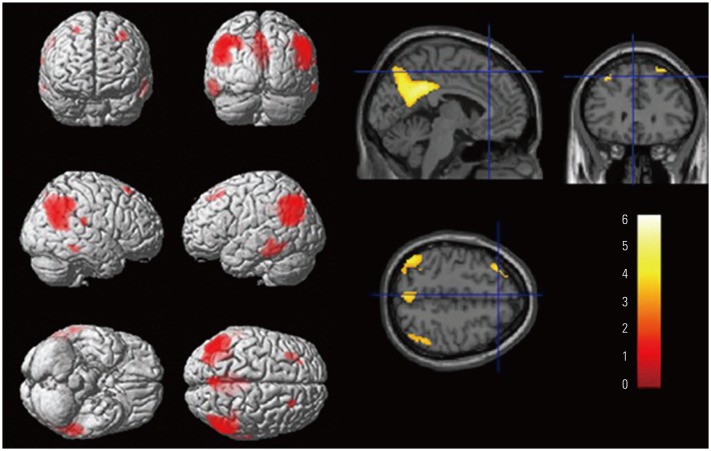
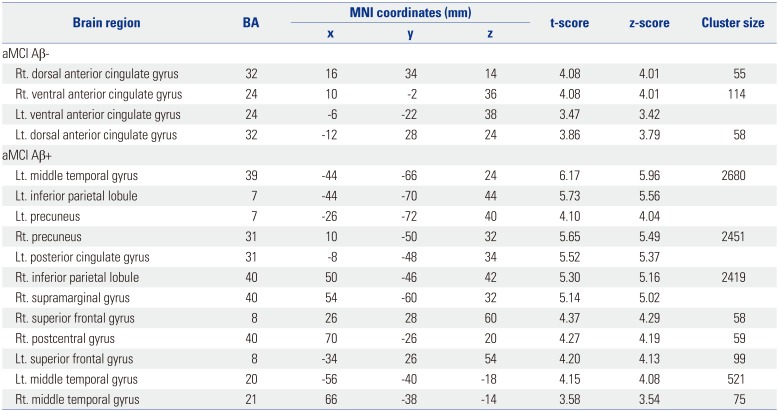
The relationships between ADNI-EF and rCMglc were investigated after controlling for age, sex, education, and APOE genotype. In aMCI Aβ− group, significant positive correlations between ADNI-EF and rCMglc were found mainly in bilateral ACC (Fig. 2, Table 2). In contrast, in aMCI Aβ+ group, significant positive correlations between ADNI-EF and rCMglc were found in bilateral PreCu, left PCC, bilateral middle temporal gyri, bilateral inferior parietal lobule, and bilateral superior frontal gyri (Fig. 3, Table 2). These patterns of correlation remained unchanged when clinical severity was added as a covariate.

Associations of clinical progression with ACC, PCC, and PreCu rCMglc

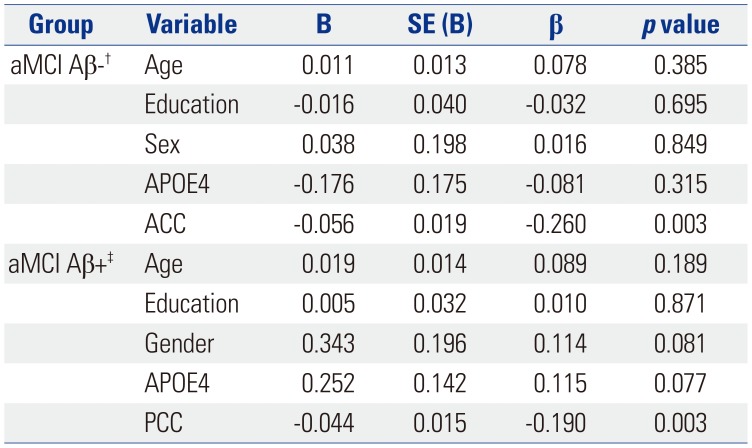
Multiple linear regression analysis using stepwise method showed Aβ positivity-dependent distinct patterns of associations between rCMglc ROIs and CDR-SOB at 1 year. In aMCI Aβ− group, baseline ACC hypometabolism was significantly associated with a higher CDR-SOB (β=−0.260, p=0.003) independently of age, sex, education, and APOE genotype. In contrast, in aMCI Aβ+ group, baseline PCC hypometabolism was significantly associated with a higher CDR-SOB (β=−0.190, p=0.003) independently of age, sex, education, and APOE genotype (Table 3). In terms of 5-year follow-up, aMCI Aβ− group showed no significant associations between rCMglc ROIs and CDR-SOB. However, aMCI Aβ+ group showed a significant association between baseline PCC hypometabolism and higher CDR-SOB (β=−0.291, p=0.024).

DISCUSSION

The results of the current study demonstrated that aMCI Aβ− and aMCI Aβ+ groups had distinct brain regions correlated to EF and different predictors of clinical progression. The rCMglc in bilateral ACC and AD-vulnerable brain regions were correlated with EF in aMCI Aβ− and aMCI Aβ+ groups, respectively. Moreover, rCMglc in ACC and PCC were associated with clinical progression in aMCI Aβ− and aMCI Aβ+ groups, respectively.
As expected, longitudinal courses differed clearly between the two groups. On average, aMCI Aβ− subjects maintained their level of clinical severity, whereas aMCI Aβ+ subjects showed clinical progression, suggesting that aMCI Aβ− subjects had a much longer duration of illness than did aMCI Aβ+ subjects. As shown in Fig. 1, on average, aMCI Aβ− subjects showed no clinical progression. While some aMCI Aβ− subjects showed increased CDR-SOB (n=37, 24% of aMCI Aβ− group), they numbered much less than aMCI Aβ+ subjects with progression (n=121, 47.8% of aMCI Aβ+ group). During 1-year follow-up, 2% of aMCI Aβ− subjects converted to AD dementia, compared to 13% of aMCI Aβ+ subjects. Our observations that much higher progression rate in aMCI Aβ+ subjects were largely consistent with previous reports on longitudinal studies of MCI,3132 which have examined conversion rate separately for Aβ positivity. Along with previous report,33 different conversion rates between aMCI Aβ− and aMCI Aβ+ groups also suggest that Aβ deposition is a very early process in the course of AD. Our results support that, although MCI subjects were diagnosed using the same criteria and showed similar behavioral phenotypes at the time of diagnosis, underlying pathologies could to lead different clinical courses.
The relationship between brain function and cognition is important for the understanding of underlying pathology. Multiple etiologies could cause superficially similar symptoms; i.e., EF impairment in aMCI; however, the neural base for impairment may differ. We found clear differences according to Aβ positivity in the current study. Our findings in aMCI Aβ− group suggest that bilateral ACC is a critical brain area responsible for Aβ-independent EF impairment. Similar to our results, a previous study reported that metabolism in ACC was correlated with EF measured by fluency test and declined with normal aging.34 There is rich literature supporting the role of ACC in cognitive control, such as monitoring and evaluative processes.35 Given that ACC is connected to DLPFC and parietal cortex35 and serves as a hub in brain networks associated with cognitive control,36 reductions in cerebral glucose utilization in ACC in our aMCI Aβ− subjects indicates that their EF impairment could be related to an inefficient brain system for cognitive control. On the other hand, our study also revealed that EF impairment in aMCI Aβ+ group was related to the default mode network (DMN), which was mainly affected by Aβ pathology37 rather than isolated dysfunction of EF-related brain system. Hypometabolism, particularly in PCC and PreCu, key areas of DMN, was the most robust feature in the progression from MCI to AD.23 Previous studies reported that EF impairment in MCI and AD were correlated to both temporoparietal and prefrontal regions.181920 These reports and our findings altogether suggest that EF failure in aMCI due to AD may be the consequence of AD pathology, rather than pure EF-related brain systems. Taken together, the current findings indicate that, although the two subgroups were superficially in the same aMCI category, EF impairment process depends on completely different functional brain regions according to the Aβ burden. Information on neuropathology is important to understand clinical characteristics and diverse patterns of clinical progression in MCI.38
Another point worth mentioning is that we adopted a composite scoring system for EF, which was developed through factor analysis of the wide range of EF tests.27 EF is basically an umbrella term encompassing decision-making, abstract thinking, planning, integrative attention, inhibition, maintenance, monitoring, set shifting, etc.13 A single EF test covers only a subset of executive components. Therefore, combining results from multiple EF tests could be used to more precisely assess the neural substrates of EF compared to a single test.
Given that EF and its related brain areas can play an important role as an early warning system in clinical progression,1139 the current study examined separately whether ACC, PCC, and PreCu were associated with clinical progression according to Aβ positivity. ACC and PCC were associated with clinical progression at 1 year in aMCI Aβ− and aMCI Aβ+, respectively. However, ACC was no longer useful for the prediction of clinical progression at 5 years in aMCI Aβ− group, whereas PCC was still associated with clinical progression at 5 years in aMCI Aβ+ group. Our results indicate that ACC, but not posterior brain areas, can be a useful predictor for short-term Aβ-independent clinical progression regardless of age, sex, education, and APOE genotype. Given that ACC is a main node of cognitive control network,36 alterations in EF-related brain systems might play a role in the pathogenesis of Aβ-independent clinical progression. In contrast, hypometabolism in PCC in aMCI Aβ+ can be a useful predictor for both short-term and long-term clinical progression regardless of age, sex, education, and APOE genotype. This finding is consistent with those of a recent meta-analysis which investigated brain regions with hypometabolism to predict the conversion from MCI to AD.23 Based on nine studies, they concluded that hypometabolism in PCC and PreCu were the most robust regions for early detection and disease tracking.23 Previous studies considered PCC and PreCu as a single cluster, whereas this study used separate ROIs for these regions. In the current study, only PCC, and not PreCu, was a significant predictor of clinical progression. This finding might be attributable to the high correlation between PCC and PreCu (Pearson correlation, r=0.361, p<0.001). We applied stepwise regression. After including PCC in the regression model, PreCu did not significantly increase the model fit. PCC is a key node of DMN40 that is altered in AD dementia that involves very early stages of AD trajectory and leads to the neurodegeneration process in AD.41
Despite its significant implications, the current study had some limitations and needs future improvements. First, sample size at the 5-year follow-up was small, since we excluded data if the evaluation interval times more or less than 5 years from baseline date. Consequently, the associations of rCMglc ROIs and long-term clinical progression were interpreted with caution. Further studies based on larger sample sizes for long-term clinical progression are advised to replicate our results. Second, we investigated the neural correlates for EF in terms of localizationist view. Given that ACC and PCC are the hubs of cognitive control network and DMN, respectively, further network-based neural correlate studies using functional and structural imaging are warranted to extend our knowledge of the mechanisms of underlying EF impairment in MCI.
In conclusion, to our knowledge, the current study is the first to separately explore the functional neural correlates of EF impairment in aMCI with and without Aβ pathology. Given the role of EF as an early warning system and the pathophysiological heterogeneity in MCI, clarification of the etiologies and the nature of EF impairment in MCI are critical for disease prognosis and management. EF impairment in aMCI Aβ− was related to ACC, the main node of cognitive control network, whereas EF impairment in aMCI Aβ+ was related to the PCC, PreCU, and other AD-vulnerable brain regions. Moreover, ACC and PCC were associated with the clinical progressions of aMCI Aβ− and aMCI Aβ+, respectively. These findings suggest that, although MCI subjects showed similar behavioral phenotypes at the time of diagnosis, EF impairment and further clinical progression was associated with completely different brain regions according to their Aβ burden.

ACKNOWLEDGEMENTS

This research was supported by Basic Science Research Program through the National Research Foundation of Korea (NRF) funded by the Ministry of Education (NRF-2017R1D-1A1B03028377), and by the Bio & Medical Technology Development Program of NRF funded by the Korean government (MSIT) (No. 2016M3A9E9941914).
Data collection and sharing for this project were funded by the ADNI (National Institutes of Health Grant U01 AG024904) and DOD ADNI (Department of Defense award number W81XWH-12-2-0012). ADNI is funded by the National Institute on Aging and the National Institute of Biomedical Imaging and Bioengineering, as well as through generous contributions from the following: Alzheimer's Association; Alzheimer's Drug Discovery Foundation; Araclon Biotech; BioClinica, Inc.; Biogen Idec Inc.; Bristol-Myers Squibb Company; Eisai Inc.; Elan Pharmaceuticals, Inc.; Eli Lilly and Company; EuroImmun; F. Hoffmann-La Roche Ltd. and its affiliated company Genentech, Inc.; Fujirebio; GE Healthcare; IXICO, Ltd.; Janssen Alzheimer Immunotherapy Research & Development, LLC.; Johnson & Johnson Pharmaceutical Research & Development LLC.; Medpace, Inc.; Merck & Co., Inc.; Meso Scale Diagnostics, LLC.; NeuroRx Research; Neurotrack Technologies; Novartis Pharmaceuticals Corporation; Pfizer Inc.; Piramal Imaging; Servier; Synarc Inc.; and Takeda Pharmaceutical Company. The Canadian Institutes of Health Research is providing funds to support ADNI clinical sites in Canada. Private sector contributions are facilitated by the Foundation for the National Institutes of Health (www.fnih.org). The grantee organization is the Northern California Institute for Research and Education, and the study was coordinated by the Alzheimer's Disease Cooperative Study at the University of California, San Diego. ADNI data are disseminated by the Laboratory of Neuro Imaging at the University of Southern California.

Notes

Part of this study (results of neural correlates of EF at baseline) was presented as poster in the Cognitive Neuroscience Society held in San Francisco, USA, in 2017.

The authors have no potential conflicts of interest to disclose.

AUTHOR CONTRIBUTIONS:

  • Conceptualization: All authors.

  • Data curation: Hyung-Jun Yoon, Eun Hyun Seo, and the Alzheimer's Disease Neuroimaging Initiative.

  • Formal analysis: Hyung-Jun Yoon and Eun Hyun Seo.

  • Funding acquisition: Eun Hyun Seo and the Alzheimer's Disease Neuroimaging Initiative.

  • Methodology: Hyung-Jun Yoon and Eun Hyun Seo.

  • Supervision: Seung-Gon Kim, Sang Hoon Kim, and Sang Hag Park.

  • Writing—original draft: Hyung-Jun Yoon and Eun Hyun Seo.

  • Writing—review & editing: Hyung-Jun Yoon, Seung-Gon Kim, Sang Hoon Kim, IL Han Choo, Sang Hag Park, and Eun Hyun Seo.

References

1. Winblad B, Palmer K, Kivipelto M, Jelic V, Fratiglioni L, Wahlund LO, et al. Mild cognitive impairment--beyond controversies, towards a consensus: report of the International Working Group on Mild Cognitive Impairment. J Intern Med. 2004; 256:240–246. PMID: 15324367.
2. Clark LR, Delano-Wood L, Libon DJ, McDonald CR, Nation DA, Bangen KJ, et al. Are empirically-derived subtypes of mild cognitive impairment consistent with conventional subtypes? J Int Neuropsychol Soc. 2013; 19:635–645. PMID: 23552486.
crossref
3. Nettiksimmons J, DeCarli C, Landau S, Beckett L. Alzheimer's Disease Neuroimaging Initiative. Biological heterogeneity in ADNI amnestic mild cognitive impairment. Alzheimers Dement. 2014; 10:511–521. PMID: 24418061.
crossref
4. Wolk DA, Price JC, Saxton JA, Snitz BE, James JA, Lopez OL, et al. Amyloid imaging in mild cognitive impairment subtypes. Ann Neurol. 2009; 65:557–568. PMID: 19475670.
crossref
5. Nordberg A, Carter SF, Rinne J, Drzezga A, Brooks DJ, Vandenberghe R, et al. A European multicentre PET study of fibrillar amyloid in Alzheimer's disease. Eur J Nucl Med Mol Imaging. 2013; 40:104–114. PMID: 22961445.
crossref
6. Ravaglia G, Forti P, Montesi F, Lucicesare A, Pisacane N, Rietti E, et al. Mild cognitive impairment: epidemiology and dementia risk in an elderly Italian population. J Am Geriatr Soc. 2008; 56:51–58. PMID: 18028343.
crossref
7. Pandya SY, Lacritz LH, Weiner MF, Deschner M, Woon FL. Predictors of reversion from mild cognitive impairment to normal cognition. Dement Geriatr Cogn Disord. 2017; 43:204–214. PMID: 28301848.
crossref
8. Mitchell AJ, Shiri-Feshki M. Rate of progression of mild cognitive impairment to dementia--meta-analysis of 41 robust inception cohort studies. Acta Psychiatr Scand. 2009; 119:252–265. PMID: 19236314.
9. Brandt J, Aretouli E, Neijstrom E, Samek J, Manning K, Albert MS, et al. Selectivity of executive function deficits in mild cognitive impairment. Neuropsychology. 2009; 23:607–618. PMID: 19702414.
crossref
10. Kirova AM, Bays RB, Lagalwar S. Working memory and executive function decline across normal aging, mild cognitive impairment, and Alzheimer's disease. Biomed Res Int. 2015; 2015:748212. PMID: 26550575.
crossref
11. Seo EH, Kim H, Lee KH, Choo IH. Altered executive function in pre-mild cognitive impairment. J Alzheimers Dis. 2016; 54:933–940. PMID: 27567814.
crossref
12. Clement F, Gauthier S, Belleville S. Executive functions in mild cognitive impairment: emergence and breakdown of neural plasticity. Cortex. 2013; 49:1268–1279. PMID: 22841389.
crossref
13. Diamond A. Executive functions. Annu Rev Psychol. 2013; 64:135–168. PMID: 23020641.
crossref
14. Chang YL, Jacobson MW, Fennema-Notestine C, Hagler DJ Jr, Jennings RG, Dale AM, et al. Level of executive function influences verbal memory in amnestic mild cognitive impairment and predicts prefrontal and posterior cingulate thickness. Cereb Cortex. 2010; 20:1305–1313. PMID: 19776343.
crossref
15. Duara R, Loewenstein DA, Greig MT, Potter E, Barker W, Raj A, et al. Pre-MCI and MCI: neuropsychological, clinical, and imaging features and progression rates. Am J Geriatr Psychiatry. 2011; 19:951–960. PMID: 21422909.
crossref
16. Ewers M, Brendel M, Rizk-Jackson A, Rominger A, Bartenstein P, Schuff N, et al. Reduced FDG-PET brain metabolism and executive function predict clinical progression in elderly healthy subjects. Neuroimage Clin. 2014; 4:45–52. PMID: 24286024.
crossref
17. Wu L, Soder RB, Schoemaker D, Carbonnell F, Sziklas V, Rowley J, et al. Resting state executive control network adaptations in amnestic mild cognitive impairment. J Alzheimers Dis. 2014; 40:993–1004. PMID: 24583406.
crossref
18. Shon JM, Lee DY, Seo EH, Sohn BK, Kim JW, Park SY, et al. Functional neuroanatomical correlates of the executive clock drawing task (CLOX) performance in Alzheimer's disease: a FDG-PET study. Neuroscience. 2013; 246:271–280. PMID: 23673275.
crossref
19. Zheng D, Sun H, Dong X, Liu B, Xu Y, Chen S, et al. Executive dysfunction and gray matter atrophy in amnestic mild cognitive impairment. Neurobiol Aging. 2014; 35:548–555. PMID: 24119547.
crossref
20. Nho K, Risacher SL, Crane PK, DeCarli C, Glymour MM, Habeck C, et al. Voxel and surface-based topography of memory and executive deficits in mild cognitive impairment and Alzheimer's disease. Brain Imaging Behav. 2012; 6:551–567. PMID: 23070747.
crossref
21. Jueptner M, Weiller C. Review: does measurement of regional cerebral blood flow reflect synaptic activity? Implications for PET and fMRI. Neuroimage. 1995; 2:148–156. PMID: 9343597.
22. Della Rosa PA, Cerami C, Gallivanone F, Prestia A, Caroli A, Castiglioni I, et al. A standardized [18F]-FDG-PET template for spatial normalization in statistical parametric mapping of dementia. Neuroinformatics. 2014; 12:575–593. PMID: 24952892.
crossref
23. Ma HR, Sheng LQ, Pan PL, Wang GD, Luo R, Shi HC, et al. Cerebral glucose metabolic prediction from amnestic mild cognitive impairment to Alzheimer's dementia: a meta-analysis. Transl Neurodegener. 2018; 7:9. PMID: 29713467.
crossref
24. Morris JC. The Clinical Dementia Rating (CDR): current version and scoring rules. Neurology. 1993; 43:2412–2414.
25. Petersen RC, Aisen PS, Beckett LA, Donohue MC, Gamst AC, Harvey DJ, et al. Alzheimer's Disease Neuroimaging Initiative (ADNI): clinical characterization. Neurology. 2010; 74:201–209. PMID: 20042704.
crossref
26. Seo EH, Choo IL. Alzheimer's Disease Neuroimaging Initiative. Amyloid-independent functional neural correlates of episodic memory in amnestic mild cognitive impairment. Eur J Nucl Med Mol Imaging. 2016; 43:1088–1095. PMID: 26613793.
crossref
27. Gibbons LE, Carle AC, Mackin RS, Harvey D, Mukherjee S, Insel P, et al. A composite score for executive functioning, validated in Alzheimer's Disease Neuroimaging Initiative (ADNI) participants with baseline mild cognitive impairment. Brain Imaging Behav. 2012; 6:517–527. PMID: 22644789.
crossref
28. Landau SM, Mintun MA, Joshi AD, Koeppe RA, Petersen RC, Aisen PS, et al. Amyloid deposition, hypometabolism, and longitudinal cognitive decline. Ann Neurol. 2012; 72:578–586. PMID: 23109153.
crossref
29. Dukart J, Mueller K, Horstmann A, Vogt B, Frisch S, Barthel H, et al. Differential effects of global and cerebellar normalization on detection and differentiation of dementia in FDG-PET studies. Neuroimage. 2010; 49:1490–1495. PMID: 19770055.
crossref
30. Tzourio-Mazoyer N, Landeau B, Papathanassiou D, Crivello F, Etard O, Delcroix N, et al. Automated anatomical labeling of activations in SPM using a macroscopic anatomical parcellation of the MNI MRI single-subject brain. Neuroimage. 2002; 15:273–289. PMID: 11771995.
crossref
31. Ye BS, Kim HJ, Kim YJ, Jung NY, Lee JS, Lee J, et al. Longitudinal outcomes of amyloid positive versus negative amnestic mild cognitive impairments: a three-year longitudinal study. Sci Rep. 2018; 8:5557. PMID: 29615677.
crossref
32. Rowe CC, Bourgeat P, Ellis KA, Brown B, Lim YY, Mulligan R, et al. Predicting Alzheimer disease with β-amyloid imaging: results from the Australian imaging, biomarkers, and lifestyle study of ageing. Ann Neurol. 2013; 74:905–913. PMID: 24448836.
crossref
33. Mormino EC, Papp KV. Amyloid accumulation and cognitive decline in clinically normal older individuals: implications for aging and early Alzheimer's disease. J Alzheimers Dis. 2018; 64(s1):S633–S646. PMID: 29782318.
crossref
34. Pardo JV, Lee JT, Sheikh SA, Surerus-Johnson C, Shah H, Munch KR, et al. Where the brain grows old: decline in anterior cingulate and medial prefrontal function with normal aging. Neuroimage. 2007; 35:1231–1237. PMID: 17321756.
crossref
35. Heilbronner SR, Hayden BY. Dorsal anterior cingulate cortex: a bottom-up view. Annu Rev Neurosci. 2016; 39:149–170. PMID: 27090954.
crossref
36. Alexopoulos GS, Hoptman MJ, Kanellopoulos D, Murphy CF, Lim KO, Gunning FM. Functional connectivity in the cognitive control network and the default mode network in late-life depression. J Affect Disord. 2012; 139:56–65. PMID: 22425432.
crossref
37. Sheline YI, Raichle ME, Snyder AZ, Morris JC, Head D, Wang S, et al. Amyloid plaques disrupt resting state default mode network connectivity in cognitively normal elderly. Biol Psychiatry. 2010; 67:584–587. PMID: 19833321.
crossref
38. Kim Y, Suh YL, Kim SJ, Bae MH, Kim JB, Kim Y, et al. The brain donation program in South Korea. Yonsei Med J. 2018; 59:1197–1204. PMID: 30450854.
crossref
39. Hamel R, Köhler S, Sistermans N, Koene T, Pijnenburg Y, van der Flier W, et al. The trajectory of cognitive decline in the pre-dementia phase in memory clinic visitors: findings from the 4C-MCI study. Psychol Med. 2015; 45:1509–1519. PMID: 25407094.
crossref
40. Fransson P, Marrelec G. The precuneus/posterior cingulate cortex plays a pivotal role in the default mode network: Evidence from a partial correlation network analysis. Neuroimage. 2008; 42:1178–1184. PMID: 18598773.
crossref
41. Jacobs HI, Van Boxtel MP, Jolles J, Verhey FR, Uylings HB. Parietal cortex matters in Alzheimer's disease: an overview of structural, functional and metabolic findings. Neurosci Biobehav Rev. 2012; 36:297–309. PMID: 21741401.
crossref
Fig. 1

Longitudinal Clinical Dementia Rating sum of boxes (CDR-SOB) score changes according to beta-amyloid positivity. The number of subjects at baseline was 230 and 268 for amnestic mild cognitive impairment with low Aβ burden (aMCI Aβ−) and amnestic mild cognitive impairment with high Aβ burden (aMCI Aβ+), respectively. The number of subjects at 1-year follow-up (FU) was 156 and 253 for aMCI Aβ− and aMCI Aβ+, respectively. The number of subjects at 5-year FU was 52 and 68 for aMCI Aβ− and aMCI Aβ+, respectively. *p<0.01; p<0.001.

ymj-60-935-g001
Fig. 2

Brain areas with significant positive correlations between regional cerebral glucose metabolism and executive function in amnestic mild cognitive impairment (aMCI) with low Aβ burden. Statistical parametric maps showing positive correlations between Alzheimer's Disease Neuroimaging Initiative executive function composite scores and regional cerebral glucose metabolism using a multiple regression model with age, sex, education, and apolipoprotein E (APOE) genotype as covariates in aMCI with low Aβ burden. Significant regions have p<0.001 (uncorrected for multiple comparisons) with an extent threshold of greater than 50 contiguous voxels. The yellow-red color bar represents t-score.

ymj-60-935-g002
Fig. 3

Brain areas with significant positive correlations between regional cerebral glucose metabolism and executive function in amnestic mild cognitive impairment (aMCI) with high Aβ burden. Statistical parametric maps showing positive correlations between Alzheimer's Disease Neuroimaging Initiative executive function composite scores and regional cerebral glucose metabolism using a multiple regression model with age, sex, education, and apolipoprotein E (APOE) genotype as covariates in aMCI with high Aβ burden. Significant regions have p<0.001 (uncorrected for multiple comparisons) with an extent threshold of greater than 50 contiguous voxels. The yellow-red color bar represents t-score.

ymj-60-935-g003
Table 1

Demographic and Clinical Characteristics of Participants at Baseline

ymj-60-935-i001
Total participants Followed for 1 year only
aMCI Aβ− (n=230) aMCI Aβ+ (n=268) aMCI Aβ− (n=156) aMCI Aβ+ (n=253)
Age (yr) 70.95 (8.32) 73.69 (7.14)* 71.53 (8.45) 73.71 (6.99)*
Education (yr) 16.34 (2.48) 15.94 (2.87) 16.62 (2.42) 15.86 (2.88)*
Female (n, %) 127 (55.2) 154 (57.5) 63 (40.4) 107 (42.3)
APOE ε4 carriers (n, %) 54 (23.5) 173 (64.6)* 41 (26.3) 167 (66.0)*
1.00 (0.53) 1.37 (0.17)* 1.01 (0.55) 1.37 (0.17)*
CDR-SOB 1.32 (0.83) 1.63 (0.98)* 1.34 (0.86) 1.65 (0.96)*
FAQ 1.97 (3.18) 3.29 (4.07)* 2.15 (3.28) 3.43 (4.14)*
MMSE 28.52 (1.45) 27.64 (1.84)* 28.60 (1.48) 27.60 (1.85)*
ADNI-EF 0.53 (0.73) 0.18 (0.82)* 0.48 (0.74) 0.16 (0.81)*

aMCI Aβ−, amnestic mild cognitive impairment with low Aβ burden; aMCI Aβ+, amnestic mild cognitive impairment with high Aβ burden; APOE, apolipoprotein E; Aβ, florbetapir mean standard uptake value ratio of frontal, anterior cingulate, precuneus and parietal cortex relative to the cerebellum; CDR-SOB, Clinical Dementia Rating sum of boxes; FAQ, Functional Assessment Questionnaire; MMSE, Mini Mental Status Examination; ADNI-EF, Alzheimer's Disease Neuroimaging Initiative composite score for executive function.

Data are presented as mean (standard deviation) unless specified otherwise.

*p<0.05.

Table 2

Brain Regions Showing Significant Correlations between rCMglc and ADNI-EF

ymj-60-935-i002
Brain region BA MNI coordinates (mm) t-score z-score Cluster size
x y z
aMCI Aβ−
 Rt. dorsal anterior cingulate gyrus 32 16 34 14 4.08 4.01 55
 Rt. ventral anterior cingulate gyrus 24 10 −2 36 4.08 4.01 114
 Lt. ventral anterior cingulate gyrus 24 −6 −22 38 3.47 3.42
 Lt. dorsal anterior cingulate gyrus 32 −12 28 24 3.86 3.79 58
aMCI Aβ+
 Lt. middle temporal gyrus 39 −44 −66 24 6.17 5.96 2680
 Lt. inferior parietal lobule 7 −44 −70 44 5.73 5.56
 Lt. precuneus 7 −26 −72 40 4.10 4.04
 Rt. precuneus 31 10 −50 32 5.65 5.49 2451
 Lt. posterior cingulate gyrus 31 −8 −48 34 5.52 5.37
 Rt. inferior parietal lobule 40 50 −46 42 5.30 5.16 2419
 Rt. supramarginal gyrus 40 54 −60 32 5.14 5.02
 Rt. superior frontal gyrus 8 26 28 60 4.37 4.29 58
 Rt. postcentral gyrus 40 70 −26 20 4.27 4.19 59
 Lt. superior frontal gyrus 8 −34 26 54 4.20 4.13 99
 Lt. middle temporal gyrus 20 −56 −40 −18 4.15 4.08 521
 Rt. middle temporal gyrus 21 66 −38 −14 3.58 3.54 75

rCMglc, regional cerebral glucose metabolism; ADNI-EF, Alzheimer's Disease Neuroimaging Initiative composite score for executive function; BA, Brodmann area; MNI, Montreal Neurological Institute; aMCI Aβ−, amnestic mild cognitive impairment with low Aβ burden; aMCI Aβ+, amnestic mild cognitive impairment with high Aβ burden; Rt., right; Lt., left.

Table 3

Multiple Linear Regression of ACC, PCC, and PreCu Regions of Interest at Baseline on 1-Year Follow-Up CDR-SOB*

ymj-60-935-i003
Group Variable B SE (B) β p value
aMCI Aβ− Age 0.011 0.013 0.078 0.385
Education −0.016 0.040 −0.032 0.695
Sex 0.038 0.198 0.016 0.849
APOE4 −0.176 0.175 −0.081 0.315
ACC −0.056 0.019 −0.260 0.003
aMCI Aβ+ Age 0.019 0.014 0.089 0.189
Education 0.005 0.032 0.010 0.871
Gender 0.343 0.196 0.114 0.081
APOE4 0.252 0.142 0.115 0.077
PCC −0.044 0.015 −0.190 0.003

ACC, anterior cingulate cortex; PCC, posterior cingulate cortex; PreCu, precuneus; CDR-SOB, Clinical Dementia Rating sum of boxes; aMCI Aβ−, amnestic mild cognitive impairment with low Aβ burden; aMCI Aβ+, amnestic mild cognitive impairment with high Aβ burden; APOE, apolipoprotein E; B, regression coefficient; SE (B), standard error of B; β, standardized regression coefficient.

*Age, education, ACC, and PCC were entered as continuous variables. APOE4 was coded as the number of epsilon 4 alleles (0, 1, or 2). Sex was coded as 0 and 1 for female and male, respectively; R2=0.062, p=0.008; R2= 0.108, p=0.005.

TOOLS
Similar articles