

 PDF
PDF ePub
ePub Citation
 Print
Print


Abstract
Purpose
To develop software to measure the shortest radius in curvature of Bruch's membrane from optical coherence tomography (OCT), and then to apply it to various types of eyes.
Methods
Macular OCT images consisting of 12 images of 9 mm radial scans were studied. The horizontal to vertical pixel ratios were changed to 1:1, and Bruch's membrane was marked automatically on each image. Software to measure the radius of Bruch's membrane curvature was developed. The shortest radius on each image was defined as r (mm) and the average r of 12 images was defined as R (mm). The reciprocal of R was multiplied by the constant, 337.5, which was defined as the posterior staphyloma (PS) index.
Results
The OCT images of five eyes were analyzed by the software, which could calculate the curvature of Bruch's membrane automatically. The PS indices were 12.7, 23.7, and 66.4 in eyes without refractive error (Case I), in the high myopic group without posterior staphyloma (Case II), and in the high myopic group with posterior staphyloma (Case V), respectively. The PS index gradually increased according to aging in a 37-year-old patient (Case IV) with mild staphyloma from 34.6 to 39.5 over 4 years.
Figures and Tables
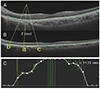 | Figure 1Measurement of Bruch's membrane curvature. (A) Bruch's membrane was marked automatically (green line). (B) The horizontal to vertical pixel ratio changed to 1:1 in images of optical coherent tomography and the radium of a pixel (a) is calculated by making a curve (yellow line) connecting two pixels (b, c) that are 100 pixels away (about 1.4 mm distance). (C) The radius on every pixel of Bruch's membrane was measured and the shortest radius of optical coherent tomography image was called as r.
|
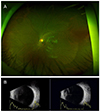 | Figure 2Fundus photo (A) and ultrasonography (B) show that a patient (case II) doesn't have posterior staphyloma. Case II, high myopia without posterior staphyloma.
|
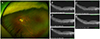 | Figure 3Case II, high myopia with mild posterior staphyloma. Fundus photo (A) shows that case IV likely has mild posterior staphyloma (PS). Series of optical coherent tomography (B-F) were examined in each year from 2015 to 2018. The curvature of Bruch's membrane has become steeper according to aging. PS index has gradually increased by 5.0 over 4 years.
|
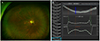 | Figure 4Fundus photo (A) shows posterior staphyloma (PS) of case V. (B) It shows analysis of Bruch's membrane curvature (green line) of Case V. The blue line indicates the point of shortest radius of Bruch's membrane and its ‘r’ was 4.96 mm. The ‘R’ (average of each “r”) was 4.93 mm and PS index is 68.5.
|
 | Figure 5Diagram of posterior staphyloma index based on Table 1. PS = posterior staphyloma.
|
References
1. Ohno-Matsui K, Jonas JB. Posterior staphyloma in pathologic myopia. Prog Retin Eye Res. 2019; 05. https://www.ncbi.nlm.nih.gov/pubmed/30537538. Dec 8, 2018.

2. Numa S, Yamashiro K, Wakazono T, et al. Prevalence of posterior staphyloma and factors associated with its shape in the Japanese population. Sci Rep. 2018; 8:4594.
3. Ohno-Matsui K. Proposed classification of posterior staphylomas based on analyses of eye shape by three-dimensional magnetic resonance imaging and wide-field fundus imaging. Ophthalmology. 2014; 121:1798–1809.
4. Ohno-Matsui K, Alkabes M, Salinas C, et al. Features of posterior staphylomas analyzed in wide-field fundus images in patients with unilateral and bilateral pathologic myopia. Retina. 2017; 37:477–486.
5. Miyake M, Yamashiro K, Akagi-Kurashige Y, et al. Analysis of fundus shape in highly myopic eyes by using curvature maps constructed from optical coherence tomography. PLoS One. 2014; 9:e107923.
6. Wakazono T, Yamashiro K, Miyake M, et al. Association between eye shape and myopic traction maculopathy in high myopia. Ophthalmology. 2016; 123:919–921.
7. Wakazono T, Yamashiro K, Miyake M, et al. Time-course change in eye shape and development of staphyloma in highly myopic eyes. Invest Ophthalmol Vis Sci. 2018; 59:5455–5461.
8. Curtin BJ. The posterior staphyloma of pathologic myopia. Trans Am Ophthalmol Soc. 1977; 75:67–86.
9. Spaid RF. Staphyloma: Part 1. In : Spaide RF, Ohno-Matsui K, Yannuzzi L, editors. Pathologic Myopia. New York: Springer;2014. chap. 12.
10. Hayashi K, Ohno-Matsui K, Shimada N, et al. Long-term pattern of progression of myopic maculopathy: a natural history study. Ophthalmology. 2010; 117:1595–1611. 1611.e1–1611.e4.
11. Ohno-Matsui K, Kawasaki R, Jonas JB, et al. International photographic classification and grading system for myopic maculopathy. Am J Ophthalmol. 2015; 159:877–883.e7.
12. Ohno-Matsui K, Lai TY, Lai CC, Cheung CM. Updates of pathologic myopia. Prog Retin Eye Res. 2016; 52:156–187.
 XML Download