

 PDF
PDF ePub
ePub Citation
 Print
Print


Abstract
Purpose
Methods
Results
Figures and Tables
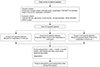 | Figure 1Flow diagram of the study. Their medical records were retrospectively analyzed. 120 eyes were divided into three groups: Bifocal intraocular lens (IOL) implantation in both eyes, extended depth of focus (EDOF) IOL implantation in both eyes and Bifocal & EDOF IOL implantation in each eye. In these three groups, distant, intermediate, and near visual acuity, spherical equivalent, and astigmatism were examined at preoperative and postoperative time points.
|
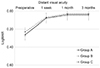 | Figure 2Comparison of postoperative distant uncorrected visual acuity (logMAR). Distant uncorrected visual acuity was improved with significant difference, but there were no significant differences among groups at 3 months postoperatively. Group A means bifocal intraocular lens implantation in both eyes, Group B means extended depth of focus intraocular lens implantation in both eyes, Group C means bifocal and extended depth o f focus intraocu lar lens im plantation in each eye. LogMAR = logarithm of minimal angle of resolution.
|
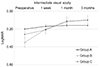 | Figure 3Comparison of postoperative intermediate uncorrected visual acuity (logMAR). Group B and C showed significant improvement compared with group A. There was no significantly difference between group B and C. Group A means bifocal intraocular lens implantation in both eyes, Group B means extended depth of focus intraocular lens implantation in both eyes, Group C means bifocal and extended depth of focus intraocular lens implantation in each eye. LogMAR = logarithm of minimal angle of resolution.
|
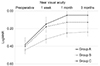 | Figure 4Comparison of postoperative near uncorrected visual acuity (logMAR). Group A showed the highest improvement and group B showed the lowest improvement. There were significantly differences among groups. Group A means bifocal intraocular lens implantation in both eyes, Group B means extended depth of focus intraocular lens implantation in both eyes, Group C means bifocal and extended depth of focus intraocular lens implantation in each eye. LogMAR = logarithm of minimal angle of resolution.
|
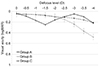 | Figure 5Binocular visual acuity at various defocus levels. Group A is bifocal intraocular lens implantation in both eyes, Group B is extended depth of focus intraocular lens implantation in both eyes, Group C is bifocal and extended depth of focus intraocular lens implantation in each eye. D = diopter.
|
Table 1
Demographics of the study groups
Values are presented as mean ± standard deviation or number. Group A is bifocal intraocular lens implantation in both eyes, Group B is extended depth of focus intraocular lens implantation in both eyes, Group C is bifocal and extended depth of focus intraocular lens implantation in each eye.
logMAR = logarithm of minimal angle of resolution; D = diopter; IOP = intraocular pressure.
*Student t-test.
![]()
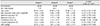
Table 2
Postoperative binocular uncorrected visual acuity
Values are presented as mean ± standard deviation. Group A is bifocal intraocular lens implantation in both eyes, Group B is extended depth of focus intraocular lens implantation in both eyes, Group C is bifocal and extended depth of focus intraocular lens implantation in each eye. LogMAR = logarithm of minimal angle of resolution; D = distant visual acuity; I = intermediate visual acuity; N = near visual acuity.
*Student t-test.
![]()
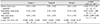
Table 3
Postoperative refractive errors in the study groups

Values are presented as mean ± standard deviation. Group A is bifocal intraocular lens implantation in both eyes, Group B is extended depth of focus intraocular lens implantation in both eyes, Group C is bifocal and extended depth of focus intraocular lens implantation in each eye.
D = diopter.
*Student t-test.
![]()

 XML Download