

 PDF
PDF ePub
ePub Citation
 Print
Print


INTRODUCTION
Radiographic evaluation is the standard method for estimating skeletal age assessment (1). Hand radiography is the most widely used approach for skeletal age determinations, and the Risser index is commonly utilized in the diagnosis, proper description, and management of patients with scoliosis. The Risser classification is used to grade skeletal maturity base on the extent of ossification and fusion of the iliac crest apophyses. Radiologists can suggest a residual growth potential of the spine in idiopathic scoliosis by using the Risser sign (2345). Several other methods of bone age assessment, including ultrasonography, computerized tomography (CT) and magnetic resonance imaging (MRI) were developed (6).
Several well-established secondary ossification centers of the pelvis and the proximal femur include the iliac crest, anterior superior iliac spine, anterior inferior iliac spine, posterior superior iliac spine, symphysis pubis, ischial tuberosity, femoral head, greater trochanter, and lesser trochanter (78). To our knowledge, studies or data on morphologic and radiographic evaluations of patterns in the triradiate cartilage (TRC) of the acetabulum, especially the timing of appearance, are not available or scarce at best. There have been several studies of the closure age of the acetabular TRC (9) and ossification patterns on the posterior acetabula wall (PA) (10). The TRC is known to close at the age of 12 in girls and 14 in boys (11).
Although pelvic fractures are rare in children (12), owing to complicated bony anatomy and having multiple secondary ossification centers in pediatric patients, there are limitations in confirming a diagnosis radiographically on the pelvic bone. We may encounter a variety of pelvic CT images in pediatric patients, undergoing a body CT examination, including the pelvis, who are being evaluated not only for a suspected pelvic trauma but also other medical problems.
With respect to age and gender distribution, TRC and PA of pediatric patients have various morphological features in CT scans. Radiologists occasionally get confused normal secondary ossification with fracture(s) due to mimicking fracture lines and irregular appearance. Comprehensive understanding of the developmental spectrum of secondary ossification centers facilitates radiologists to make an accurate radiologic diagnosis of the pelvic bone, in patients with a suspected fracture or other medical issues.
The aim of this study is to evaluate the currently unknown ossification patterns as well as the time and order of appearance of ossification centers of the TRC. This investigation also attempts to determine which cartilage is primarily closed between the TRC and the PA wall throughout childhood and adolescence and in order not to confuse normal ossification process for pelvic fractures
MATERIALS AND METHODS
Pediatric abdomen, pelvis and hip CT scans may exhibit the status of the bony acetabulum. All existing Picture Archiving and Communication System records from the time of system integration (2005) were reviewed for abdomen, hip and pelvis CT studies in patients with an age of 1 to 16 years. CT examinations were performed using one of three multidetector row computed tomography (MDCT) scanners (Somatom Sensation instrument by Siemens, Erlangen, Germany; GE Lightspeed Ultra instrument by General Electric Healthcare, Milwaukee, WI, USA; Philips Brilliance instrument by Philips Medical Systems, Best, the Netherlands). Contiguous axial images were obtained every 3 or 5 mm. Using raw data, the coronal and sagittal Multi-Planar Reformation images were reconstructed on a workstation. A total 1446 abdomen, hip and pelvis CT examinations were analyzed, and their clinical records were also rechecked. One hundred twenty-two patients were excluded for the reason of diagnosis that might have contributed to physeal and bony growth of the pelvic bone, such as crohn's disease, growth disorders, endocrinological disorders, metabolic bone disease, or for the reason of a preexisting congenital pelvic bone anomaly or inadequate radiographic quality. This retrospective study included a total of 1324 CT scans from healthy prepubertal Korean children (710 boys and 614 girls) with an age of 6–16 years. Bone age was assessed by the consensus reached by two observers-a specialist and a resident of radiology, evaluating largely the TRC and the PA for the status of skeletal maturation.
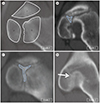
The TRC has been described as having three flanges: 1) the anterior flange is situated between the ilium and pubis, and is slanted superiorly, 2) the posterior flange stands between the ilium and the ischium, and is horizontally positioned, and 3) the vertical flange lies in the area between the ischium and the pubis (13). The horizontally-oriented posterior flange and vertical flange are noted in the axial and sagittal CT scans, and the grading of the TRC and the PA were elaborated. The TRC was divided into four grades depending on the extent of ossification for each side [right-TRC (TR) and left-TRC (TL)]: TR0, TR1, TR2, TR3 and TL0, TL1, TL2, TL3 (Fig. 1). Grade 1 shows no ossification in the center of the three flanges of the TRC of the acetabulum. Grade 2 is defined as the beginning of ossification in the center of the three flanges. Grade 3 represents the extension of the three flanges to the ileum, the pubis and the ischium. Grade 4 is characterized by a mature and complete fusion of the three flanges. The PA was divided into three grades according to the extent of ossification for both [right-PA (PR), left-PA (PL)]: PR0, PR1, PR2 and PL0, PL1, PL2) (Fig. 2). Grade 0 exhibits an entirely cartilaginous posterior wall and an invisible ossification center surrounding the posterior column. Grade 1 represents the appearance of irregular ossification behind the posterior wall. Grade 2 is defined by the entirely osseous posterior wall that has been fused to the posterior column.
Each descriptive data on the progression of ossification and the patterns between two genders were also compared, while the basic descriptive statistics were reported. Interobserver agreements were assessed using calculations weighted kappa (κ) statistics by utilizing the statistical software package SPSS version 25 (IBM Corp., Armonk, NY, USA). Interobserver agreement was assessed by using kappa (κ) values. A κ value > 0.8 is consistent with excellent agreement; 0.61–0.8, good agreement; 0.41–0.6, moderate agreement; 0.21–0.4, fair agreement; and < 0.2, poor agreement. The descriptions of interobserver agreement include κ for the interpretation of CT scans. Approximate 95% confidence intervals (CIs) were calculated from κ ± 2 χ standard error.
This study was approved by the Institutional Review Board (IRB) of Kangwon National University Hospital (IRB No. 2017-02-008).
RESULTS
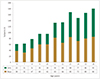
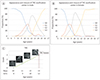
The overall distribution of patient age and gender is shown in Fig. 3. Largely equivalent numbers of boys and girls were included in each age group. The appearance and closure of secondary ossification of the TRC and the PA for boys and girls are delineated in Figs. 4, 5.
Ossification centers of the TRC in boys first appeared in the center of the three flanges (Grade 1) at the age of 11 years, and grew into three flanges (Grade 2) at age 12, and led to a complete bony fusion (Grade 3) at age 14. Regarding the PA, the ossification began to appear (Grade 1) at the age of 12 years and completed fused (Grade 2) at age 13.
TRC maturation of the girls occurred exactly two years earlier than that of the boys, revealing Grade 1 at the age of 9 years; Grade 2, age 10; and Grade 3, age 12. As for PA maturation of the girls, Grade 1 was seen at age 10, and Grade 2 at age 11.5.
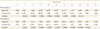
There were statistically significant differences in ossification of either the TRC or the PA between the boys and the girls after the age of 11 years (Table 1). There was a difference in TRC ossification between males and females over the age of 10 years. There was a difference in PA ossification between two genders after the age of 9 years.
TRC and PA fusion did not commence or end simultaneously, while the TRC fused within 1 year after the closure of the PA. The age range of ossification of the PA was relatively narrower than that of the TRC. There was no asymmetry between the right and left side for both TRC and PA. Weighted kappa estimations for the examined parameters, between the two radiologists, showed an excellent correlation (κ = 0.9751, 95% CI = 0.9611–0.989). There was largely no difference in recordings between the resident and the senior radiologist in pediatrics.
DISCUSSION
Radiographic analysis of secondary ossification has relied on 2-dimensional (D) imagery including X-ray in the past. However, advance images from equipment such as a conventional CT or a 3D surface-rendered MDCT are widely used for evaluation in pathology, bony anatomy and researches of skeletal development (14151617). These advanced imaging techniques provide a better access to the imagery of bony structures and more precise information than plain radiography can deliver.
The presumption in this study is that the knowledge of the appearance and patterns of ossification is essential for accurate radiologic interpretations. The pelvis of a child arises from three primary ossification centers: the ilium, ischium, and pubis. These three centers meet at the TRC and fused, while the acetabulum contains the shared physes of the ilium, ischium and pubis that merge to become the TRC.
Several researches suggest that the TRC closure occurs at around the age of 13 to 16 years (9). Some of the records of these studies were too old, showed variable ranges, and did not propose comparisons with respect to gender difference. Our findings of gender and age analysis parallel earlier researches and concur with known general skeletal development (18). Fortunately, the patterns of closure time for the boys and the girls were similar in this study. However, the suggestion of ossification pattern and appearance time, undescribed previously, of the TRC is unique to this investigation. The TRC of the boys began ossifying at the age of 10 years and closed completely at age 14, and the PA of the boys started to ossify at age 11, and completed fusion at age 13. The age of ossification center appearance or complete fusion for both TRC and PA of the girls was exactly two years earlier than that of the boys. Understanding the sequence of appearance and fusion of the ossification centers is quite challenging to radiologists.
Understanding the location, age of appearance and fusion of the secondary ossification centers are important in differentiating normal development from true fractures. Problems often arise in the radiologic evaluation of the pediatric pelvis because variations in the appearance of normal ossification are confused with fracture caused by trauma. Minor irregularities in the outline of the acetabulum on CT can be misunderstanded fracture. However, the awareness of these ossification centers helps clinicians in radiologic discipline not to be confused with pathologic conditions such as pelvic bone fractures or avulsion injury. Furthermore, such a method can facilitate radiologists in the assessment of skeletal age from the TRC and PA scans of the CT. There are several strengths and weaknesses in this study. A large number of subjects, over a thousand, in this study is strength, unlike most other previous studies. To our knowledge, the time of appearance of secondary ossification centers of the TRC could not be accurately determined before. This investigation is unique in its ability to present the spectra of age range, including the appearance and closure of the TRC and the PA, as well as in providing comparisons between two genders. Owing to the significance of interobserver variations for bone age assessment, interobserver variability was included. In the analysis of pelvic CT images, several planes including axial-, coronal-, and sagittal plane were incorporated.
The limitations of this study are as follows: radiographic images were retrospectively reviewed and analyzed utilizing only CT scans, and age groups less than 6 years old were not included in the study. Our study group contains only one ethnicity-Korean children and adolescence. Clinical measures of skeletal maturity, such as genetic differences, diet, nutritional intake and peak height velocity are also important factors in bone growth patterns. However, these factors were not considered and were not compared with respect to bone age. This investigation did not seek after the aspect of whether TRC fusion affects PA fusion or not, and did not imply the utilization of CT scans for the assessment of bone age in children.
Owing to radiation exposure concerns such as practice of As Low As Reasonably Achievable principle of CT scans in children, it is not suitable to utilize CT scans as the primary modality just for the assessment of bone age. Owing to a radiation hazard, this study limited the examination of the range of bone age, via the TRC and the PA, to children at the ages of 9–14 years. However, if a physician should wish to know the bone age of a pediatric patient with body CT scans already available, we could propose utilizing the CT scans, instead of taking new radiographs of the hands.
Although there are many methods available for bone age assessment, exposed CT scans of secondary ossification centers will be used in clinical settings that require evaluations of skeletal maturity and pediatric pathology in the future. The knowledge of skeletal maturity is imperative in the management of orthopedic pathology in prepubertal children. While bone age is an effective indicator for the diagnosis and treatment of various diseases, new studies of the correlation between secondary ossification and bone age would be challenging for radiologists and orthopedic surgeons. The ossification pattern and timing of the TRC and the PA in interpreting body scans are very useful for radiologists and many other clinicians, in order not to be confused with distinguishing normal ossification processes from pelvic fractures.
In conclusion, this study presents the spectra and patterns for the appearance and closure of the secondary ossification of the TRC and the PA with age-dependent gender data from 3D CT imaging. The appearance and closure of ossification centers of the TRC and the PA show predictable patterns of development, appearance and merger, which occur rather earlier in females than in males. The consideration is that the data on open and closed timing of the TRC and the PA in this study should prove to be a valuable radiographic indicator in the assessment of bone age.


 XML Download