Abstract
Purpose
To investigate the correlation of the strain elasticity of breast cancer with histologic features, immunohistochemical markers and molecular subtypes that are known to be factors related to prognosis.
Materials and Methods
B-mode ultrasound and strain elastography were performed in 123 patients (mean age, 53.4; range, 28–82) with invasive ductal carcinoma (IDC) (mean size, 1.54 cm; range, 0.4–7.0 cm). Histologic grade, lymph node (LN) status, lymphovascular invasion, immunohistochemical biomarkers [estrogen receptor, progesterone receptor, human epidermal growth factor receptor 2 (HER2), CK5/6, epidermal growth factor receptor, and Ki-67] and molecular subtypes were determined from surgical pathology reports. The relationships between these factors and elasticity scores were evaluated.
Results
LN involvement was associated with a higher elasticity score which was statistically significant (p = 0.042). The tumor size, lymphovascular invasion, histologic grades, immunohistochemical markers and molecular subtypes had no significant correlation with the elasticity score (p > 0.05 for all). However, the IDCs with larger size and a positive lymphovascular invasion tended to have higher elasticity scores. Furthermore, higher histologic grade cancers and the HER2 overexpression-type tended to have lower elasticity scores.
References
1. Itoh A, Ueno E, Tohno E, Kamma H, Takahashi H, Shiina T, et al. Breast disease: clinical application of US elastography for diagnosis.Radiology. 2006; 239:341–350.
2. Hiltawsky KM, Krüger M, Starke C, Heuser L, Ermert H, Jensen A. Freehand ultrasound elastography of breast lesions: clinical results.Ultrasound Med Biol. 2001; 27:1461–1469.
3. Hall TJ, Zhu Y, Spalding CS. In vivo real-time freehand palpation imaging.Ultrasound Med Biol. 2003; 29:427–435.
4. Krouskop TA, Younes PS, Srinivasan S, Wheeler T, Ophir J. Differences in the compressive stress-strain response of infiltrating ductal carcinomas with and without lobular features–implications for mammography and elastography.Ultrason Imaging. 2003; 25:162–170.
5. Parajuly SS, Lan PY, Yan L, Gang YZ, Lin L. Breast elastography: a hospital-based preliminary study in China. Asian Pac J Cancer Prev. 2010; 11:809–814.
6. Leong LC, Sim LS, Lee YS, Ng FC, Wan CM, Fook-Chong SM, et al. A prospective study to compare the diagnostic performance of breast elastography versus conventional breast ultrasound.Clin Radiol. 2010; 65:887–894.
7. Sarvazyan AP, Rudenko OV, Swanson SD, Fowlkes JB, Emelianov SY. Shear wave elasticity imaging: a new ultrasonic technology of medical diagnostics.Ultrasound Med Biol. 1998; 24:1419–1435.
8. Nightingale K, McAleavey S, Trahey G. Shear-wave generation using acoustic radiation force: in vivo and ex vivo results.Ultrasound Med Biol. 2003; 29:1715–1723.
9. Bercoff J, Tanter M, Fink M. Supersonic shear imaging: a new technique for soft tissue elasticity mapping. IEEE Trans Ultrason Ferroelectr Freq Control. 2004; 51:396–409.

10. Sarvazyan AP, Skovoroda AR, Emelianov SY, Fowlkes JB, Pipe JG, Adler RS, et al. Biophysical bases of elasticity imaging. In. Jones JP, editor. Acoustical imaging. vol. 21. Boston: Springer;2006. p. 223–240.

11. Chang JM, Won JK, Lee KB, Park IA, Yi A, Moon WK. Comparison of shear-wave and strain ultrasound elastography in the differentiation of benign and malignant breast lesions. AJR Am J Roentgenol. 2013; 201:W347–W356.

12. Carter CL, Allen C, Henson DE. Relation of tumor size, lymph node status, and survival in 24,740 breast cancer cases.Cancer. 1989; 63:181–187.
13. Elston CW, Ellis IO. Pathological prognostic factors in breast cancer. I. The value of histological grade in breast cancer: experience from a large study with longterm follow-up.Histopathology. 1991; 19:403–410.
14. Rakha EA, Martin S, Lee AH, Morgan D, Pharoah PD, Hodi Z, et al. The prognostic significance of lymphovascular invasion in invasive breast carcinoma. Cancer. 2012; 118:3670–3680.

15. Iorfida M, Maiorano E, Orvieto E, Maisonneuve P, Bottiglieri L, Rotmensz N, et al. Invasive lobular breast cancer: subtypes and outcome. Breast Cancer Res Treat. 2012; 133:713–723.

16. Tang P, Skinner KA, Hicks DG. Molecular classification of breast carcinomas by immunohistochemical analysis: are we ready?Diagn Mol Pathol. 2009; 18:125–132.
17. Hugh J, Hanson J, Cheang MC, Nielsen TO, Perou CM, Dumontet C, et al. Breast cancer subtypes and response to docetaxel in node-positive breast cancer: use of an immunohistochemical definition in the BCIRG 001 trial.J Clin Oncol. 2009; 27:1168–1176.
18. Park S, Koo JS, Kim MS, Park HS, Lee JS, Lee JS, et al. Characteristics and outcomes according to molecular subtypes of breast cancer as classified by a panel of four biomarkers using immunohistochemistry. Breast. 2012; 21:50–57.

19. Cheang MC, Chia SK, Voduc D, Gao D, Leung S, Snider J, et al. Ki67 index, HER2 status, and prognosis of patients with luminal B breast cancer. J Natl Cancer Inst. 2009; 101:736–750.

20. Onitilo AA, Engel JM, Greenlee RT, Mukesh BN. Breast cancer subtypes based on ER/PR and Her2 expression: comparison of clinicopathologic features and survival.Clin Med Res. 2009; 7:4–13.
21. Shao W, Brown M. Advances in estrogen receptor biology: prospects for improvements in targeted breast cancer therapy.Breast Cancer Res. 2004; 6:39–52.
22. Rakha EA, Ellis IO. Triple-negative/basal-like breast cancer: review. Pathology. 2009; 41:40–47.

23. Rakha EA, El-Sayed ME, Green AR, Paish EC, Lee AH, Ellis IO. Breast carcinoma with basal differentiation: a proposal for pathology definition based on basal cytokeratin expression.Histopathology. 2007; 50:434–438.
24. Kim JY, Shin JK, Lee SH. The breast tumor strain ratio is a predictive parameter for axillary lymph node metastasis in patients with invasive breast cancer. AJR Am J Roentgenol. 2015; 205:W630–W638.

25. Soyder A, Tas¸kin F, Ömürlü IK, Özbas¸ S. Correlation of tumoral prognostic factors by sonoelastography score in patients to be operated due to breast cancer. Indian J Surg. 2015; 77:206–211.

26. Evans A, Whelehan P, Thomson K, McLean D, Brauer K, Purdie C, et al. Invasive breast cancer: relationship between shear-wave elastographic findings and histologic prognostic factors. Radiology. 2012; 263:673–677.

27. Choi WJ, Kim HH, Cha JH, Shin HJ, Kim H, Chae EY, et al. Predicting prognostic factors of breast cancer using shear wave elastography.Ultrasound Med Biol. 2014; 40:269–274.
28. Chang JM, Park IA, Lee SH, Kim WH, Bae MS, Koo HR, et al. Stiffness of tumours measured by shear-wave elastography correlated with subtypes of breast cancer.Eur Radiol. 2013; 23:2450–2458.
29. Youk JH, Gweon HM, Son EJ, Kim JA, Jeong J. Shear-wave elastography of invasive breast cancer: correlation between quantitative mean elasticity value and immunohistochemical profile.Breast Cancer Res Treat. 2013; 138:119–126.
30. Au FW, Ghai S, Lu FI, Moshonov H, Crystal P. Quantitative shear wave elastography: correlation with prognostic histologic features and immunohistochemical biomarkers of breast cancer.Acad Radiol. 2015; 22:269–277.
31. Levental KR, Yu H, Kass L, Lakins JN, Egeblad M, Erler JT, et al. Matrix crosslinking forces tumor progression by enhancing integrin signaling. Cell. 2009; 139:891–906.

32. Chang JM, Moon WK, Cho N, Yi A, Koo HR, Han W, et al Clinical application of shear wave elastography (SWE) in the diagnosis of benign and malignant breast diseases. Breast Cancer Res Treat. 2011; 129:89–97.
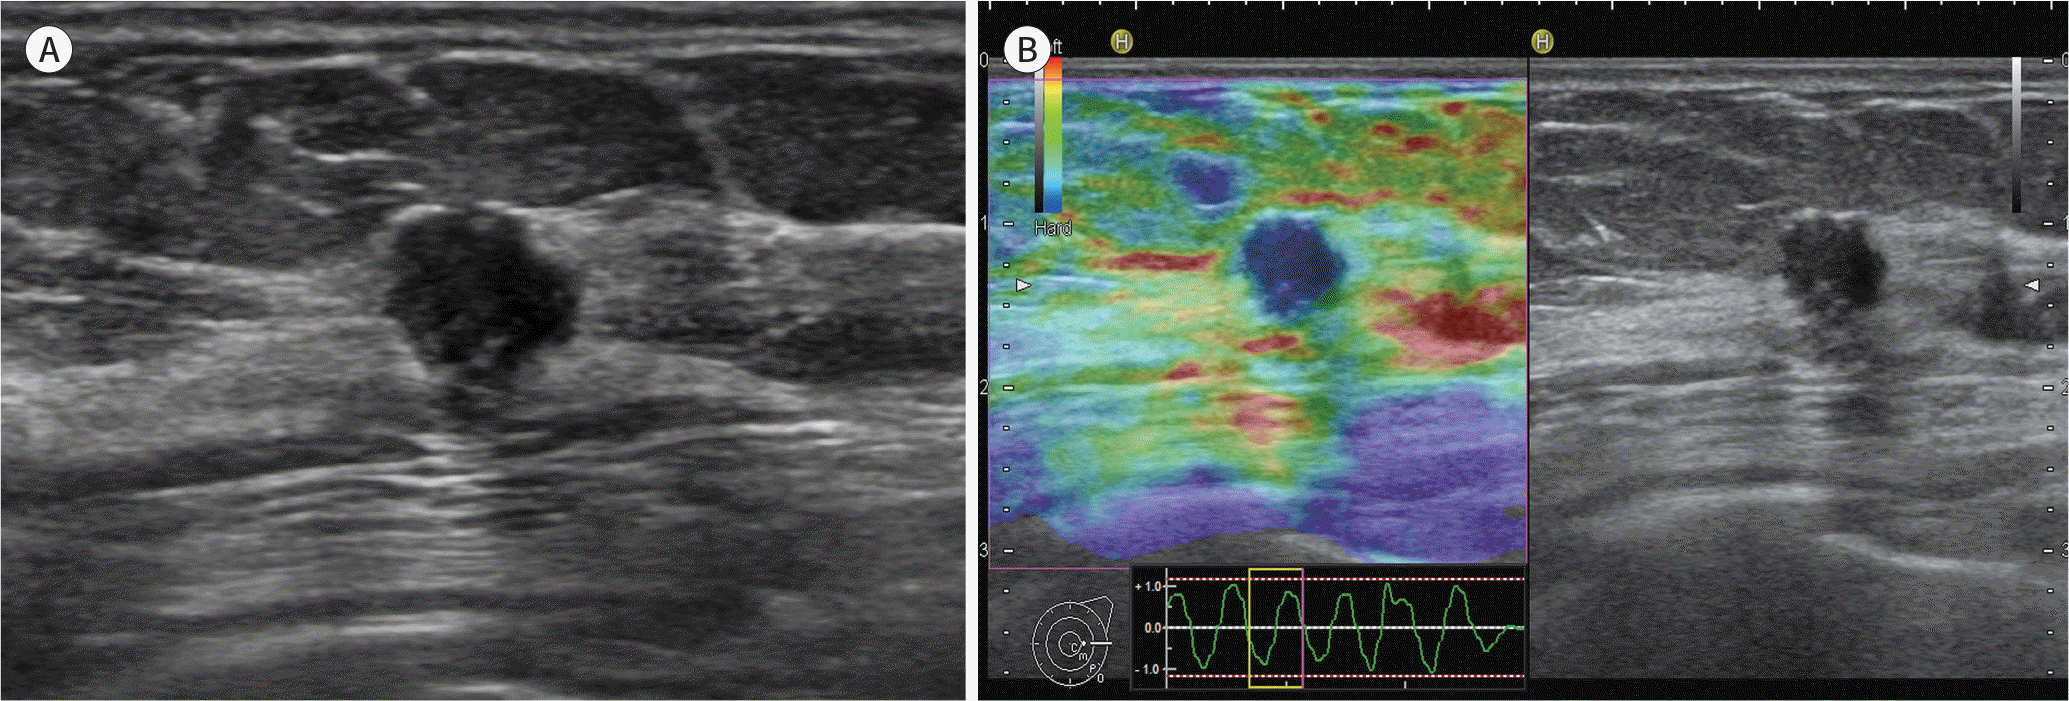
Fig. 1.
A 57-year-old woman diagnosed with an invasive ductal carcinoma (1 cm in size, T1/N1, histologic grade 2) in the left breast. A. B-mode ultrasound shows a hypoechoic mass with an irregular shape and a spiculated margin. B. Ultrasound elastography shows a mass with a higher elasticity score (score 4).

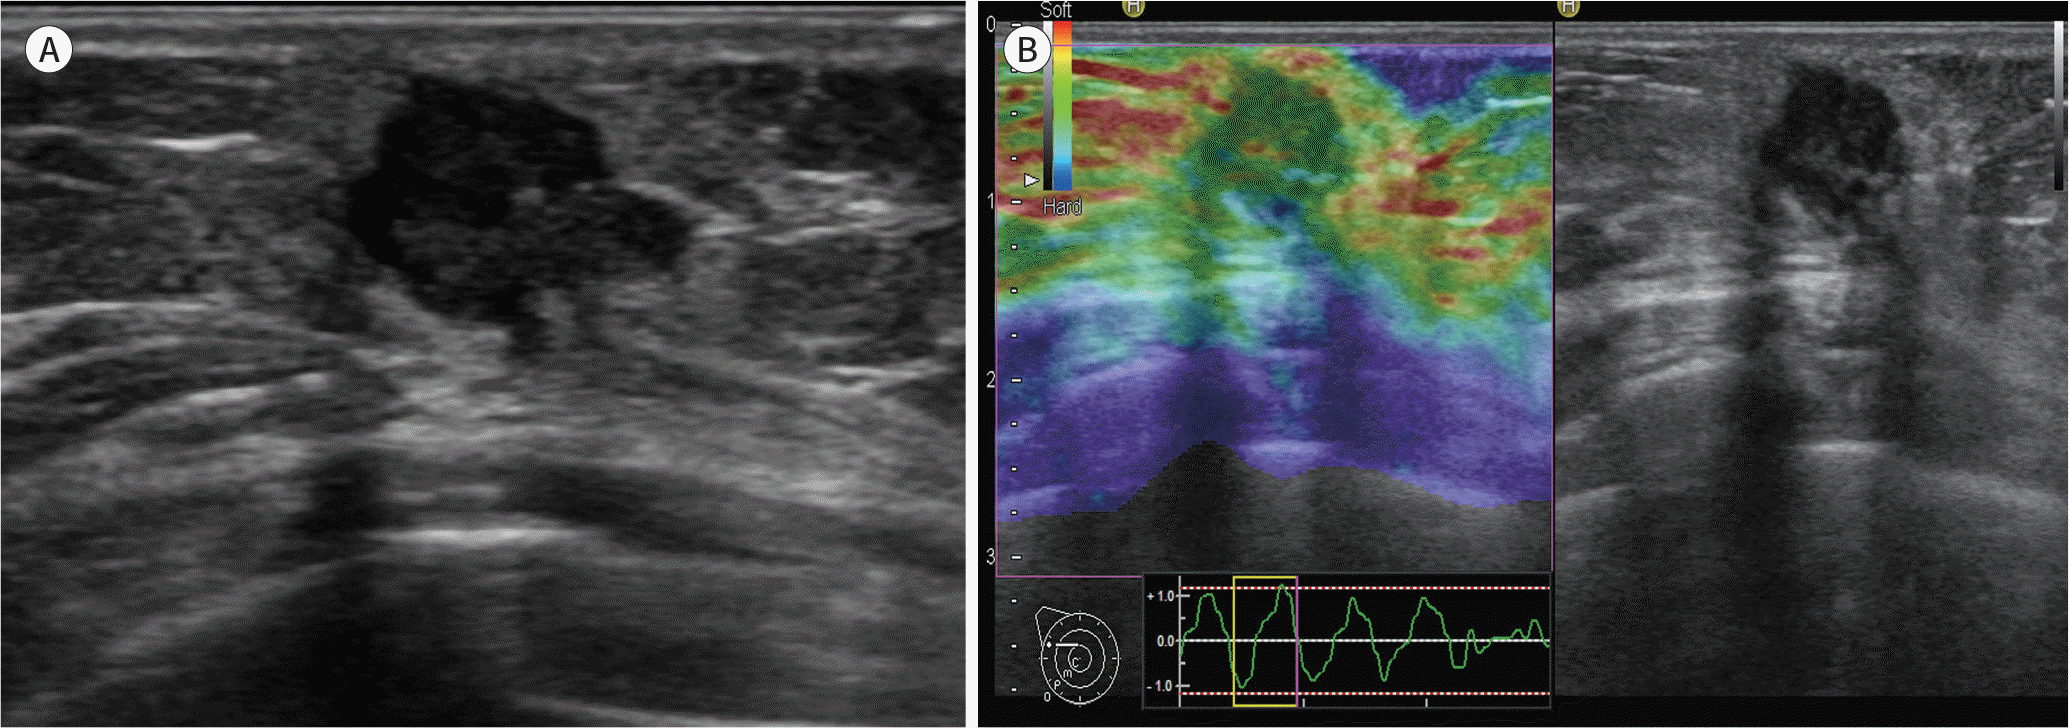
Fig. 2.
A 56-year-old woman diagnosed with an invasive ductal carcinoma (1.5 cm in size, T1/N0, histologic grade 3) in the right breast. A. B-mode ultrasound shows a hypoechoic mass with an irregular shape, an angular margin, and posterior shadowing. B. Ultrasound elastography shows a mass with a lower elasticity score (score 1).

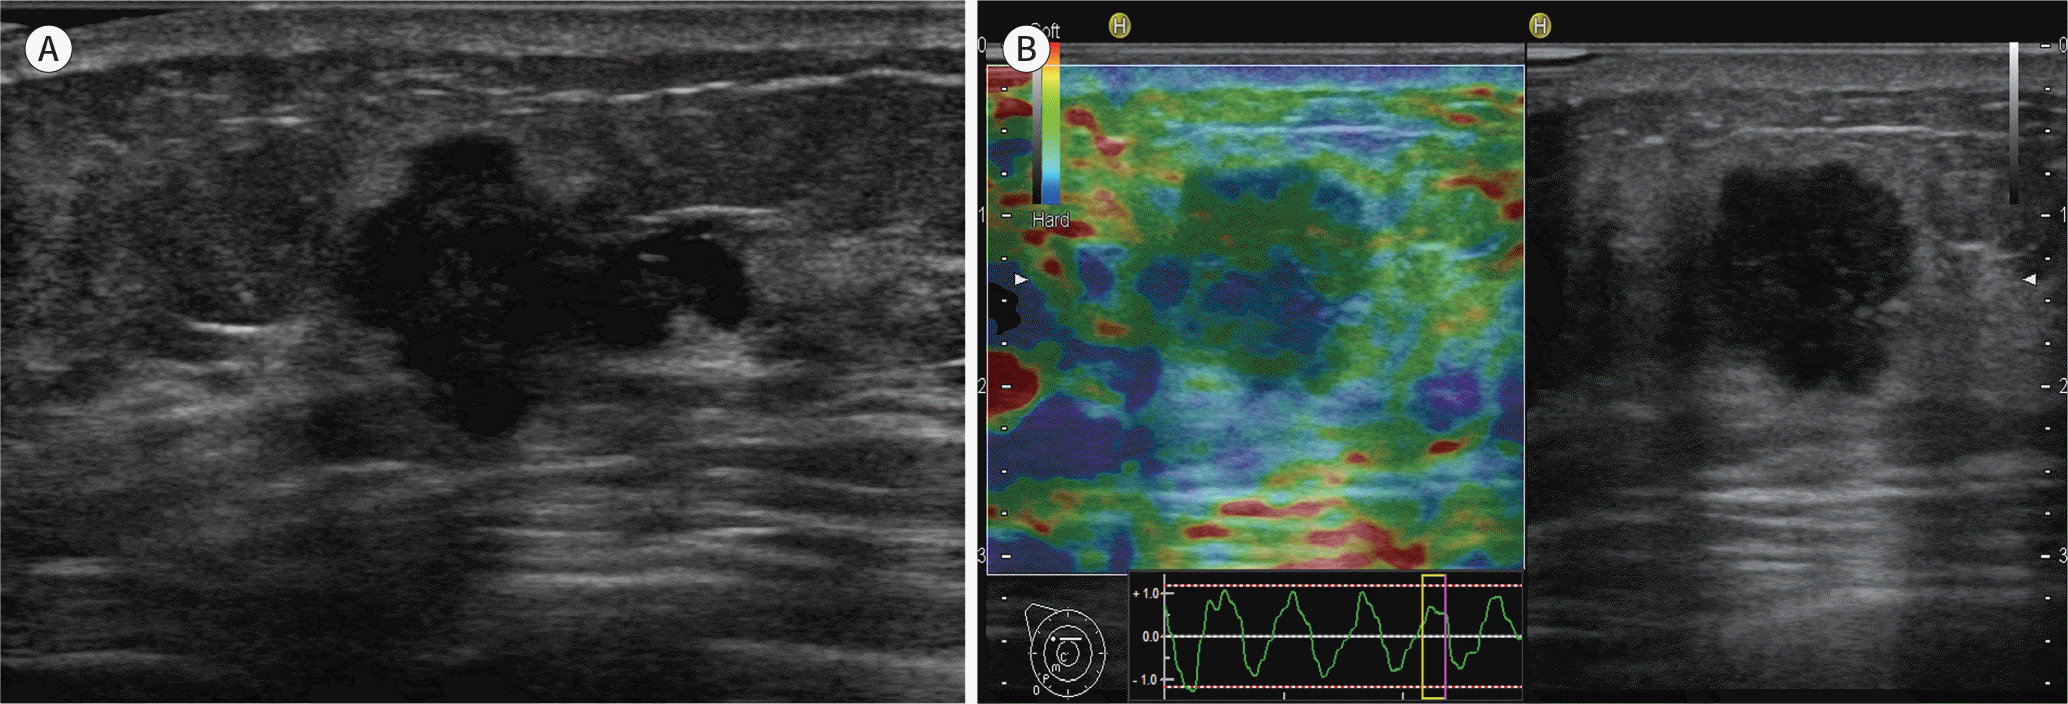
Fig. 3.
A 41-year-old woman diagnosed with an invasive ductal carcinoma (2.8 cm in size, T2/N3, histologic grade 3) in the right breast. A. B-mode ultrasound shows a hypoechoic lesion with an irregular shape and angular margin. B. Ultrasound elastography shows a mass with a lower elasticity score (score 2).

Table 1.
Correlation of Pathologic Features and Presence of Hormone Receptors with the Elasticity Scores
| Elasticity Score | p-Value | |||||||
|---|---|---|---|---|---|---|---|---|
| Score 1 (n = 10) | Score 2 (n = 26) | Score 3 (n = 55) | Score 4 (n = 19) | Score 5 (n = 13) | Mean | 5-Score | 3-Subgroups∗ | |
| Size, cm | 0.226 | 0.664 | ||||||
| < 1 (n = 37) | 7 (18.9) | 6 (16.2) | 15 (40.5) | 5 (13.5) | 4 (10.8) | 2.81 | ||
| 1–2 (n = 53) | 3 (5.7) | 11 (20.0) | 27 (50.9) | 7 (13.2) | 5 (9.4) | 3.0 | ||
| ≥ 2 (n = 33) | 0 (0) | 9 (27.3) | 13 (39.4) | 7 (21.2) | 4 (12.1) | 3.18 | ||
| Histologic grade | 0.812 | 0.590 | ||||||
| Grade 1 (n = 29) | 3 (10.3) | 5 (17.2) | 12 (41.4) | 5 (17.2) | 4 (13.8) | 3.07 | ||
| Grade 2 (n = 69) | 6 (8.7) | 13 (18.8) | 31 (44.9) | 11 (15.9) | 8 (11.6) | 3.03 | ||
| Grade 3 (n = 23) | 1 (4.3) | 8 (34.8) | 11 (47.8) | 2 (8.7) | 1 (4.3) | 2.74 | ||
| Lymph node | 0.093 | 0.042 | ||||||
| Positive (n = 27) | 0 (0.0) | 5 (18.5) | 10 (37.0) | 7 (25.9) | 5 (18.5) | 3.44 | ||
| Negative (n = 96) | 10 (10.4) | 21 (21.9) | 45 (46.9) | 12 (12.5) | 8 (8.3) | 2.86 | ||
| Lymphovascular invasion | 0.387 | 0.816 | ||||||
| Positive (n = 31) | 3 (9.7) | 5 (16.1) | 14 (45.2) | 3 (9.7) | 6 (19.4) | 3.13 | ||
| Negative (n = 91) | 7 (7.7) | 21 (23.1) | 41 (45.1) | 15 (16.5) | 7 (7.7) | 2.93 | ||
| Estrogen receptor | 0.646 | 0.301 | ||||||
| Positive (n = 97) | 7 (7.2) | 19 (19.6) | 43 (44.3) | 17 (17.5) | 11 (11.3) | 3.06 | ||
| Negative (n = 26) | 3 (11.5) | 7 (26.9) | 12 (46.2) | 2 (7.7) | 2 (7.7) | 2.73 | ||
| Progesterone receptor | 0.733 | 0.820 | ||||||
| Positive (n = 86) | 8 (9.3) | 18 (20.9) | 39 (45.3) | 14 (16.3) | 7 (8.1) | 2.93 | ||
| Negative (n = 37) | 2 (5.4) | 8 (21.6) | 16 (43.2) | 5 (13.5) | 6 (16.2) | 3.14 | ||
| HER-2 | 0.436 | 0.704 | ||||||
| Positive (n = 33) | 1 (3.0) | 9 (27.3) | 16 (48.5) | 3 (9.1) | 4 (12.1) | 3.0 | ||
| Negative (n = 88) | 9 (10.2) | 17 (19.3) | 37 (42.0) | 16 (18.2) | 9 (10.2) | 2.99 | ||
| CK5/6 | 0.473 | 0.698 | ||||||
| Positive (n = 16) | 2 (12.5) | 4 (25.0) | 6 (37.5) | 1 (6.3) | 3 (18.8) | 2.94 | ||
| Negative (n = 105) | 8 (7.6) | 22 (21.0) | 49 (46.7) | 17 (16.2) | 9 (8.6) | 2.97 | ||
| EGFR | 0.191 | 0.889 | ||||||
| Positive (n = 18) | 4 (22.2) | 2 (11.1) | 8 (44.4) | 2 (11.1) | 2 (11.1) | 2.78 | ||
| Positive (n = 18) Negative (n = 96) | 4 (22.2) 5 (5.2) | 2 (11.1) 22 (22.9) | 8 (44.4) 44 (45.8) | 2 (11.1) 15 (15.6) | 2 (11.1) 10 (10.4) | 2.78 3.03 | ||
| Negative (n = 96) Ki-67 | 5 (5.2) | 22 (22.9) | 44 (45.8) | 15 (15.6) | 10 (10.4) | 3.03 | 0.458 | 0.306 |
| Positive (n = 56) | 4 (7.1) | 16 (28.6) | 24 (42.9) | 7 (12.5) | 5 (8.9) | 2.88 | ||
| Positive (n = 56) Negative (n = 67) | 4 (7.1) 6 (9.0) | 16 (28.6) 10 (14.9) | 24 (42.9) 31 (46.3) | 7 (12.5) 12 (17.9) | 5 (8.9) 8 (11.9) | 2.88 3.09 | ||
∗ p-value obtained by dividing the five elasticity scores into three groups [i.e., low (score 1 and 2), intermediate (score 3), and high elasticity (score 4 and 5)] and comparing the three groups with respect to the variables.
CK5/6 = cytokeratin 5/6, EGFR = epidermal growth factor receptor, HER2 = human epidermal growth factor receptor 2
Table 2.
Correlation of Breast Cancer Subtypes with the Elasticity Scores
| Elasticity Score | p-Value | |||||||
|---|---|---|---|---|---|---|---|---|
| Score 1 | Score 2 | Score 3 | Score 4 | Score 5 | Mean | 5-Score | 3-Subgroup∗ | |
| Luminal (n = 101) | 8 (7.9) | 19 (18.8) | 46 (45.5) | 17 (16.8) | 11 (10.9) | 3.04 | 0.351 | 0.156 |
| HER2 overexpression (n = 10) | 0 (0) | 4 (40.0) | 6 (60.0) | 0 (0.0) | 0 (0.0) | 2.60 | ||
| Triple negative (n = 12) | 2 (16.7) | 3 (25.0) | 3 (25.0) | 2 (16.7) | 2 (16.7) | 2.92 | ||


 PDF
PDF ePub
ePub Citation
 Print
Print


 XML Download