

 PDF
PDF Citation
 Print
Print


Abbreviations
BBzP
butyl-benzyl phthalate
BMI
body mass index
CI
confidence interval
DBP
di-n-butyl phthalate
DEHP
di-(2-ethyl-5-carboxypentyl) phthalate
EDC
endocrine disrupting chemical
GM
geometric mean
HMW
high molecular weight
KoNEHS
Korean National Environmental Health Survey
LOD
limit of detection
MBzP
mono-benzyl phthalate
MCNP
mono-(carboxylnonyl) phthalate
MECPP
mono-(2-ethyl-5-carboxypentyl) phthalate
MEHHP
mono-(2-ethyl-5-hydroxyhexyl) phthalate
MEHP
mono-(2-ethylhexyl) phthalate
MEOHP
mono-(2-ethyl-5-oxohexyl) phthalate
MEP
mono-ethyl phthalate
MnBP
mono-n-butyl phthalate
NHANES
National Health and Nutrition Examination Survey
OR
odds ratio
PPARs
peroxisome proliferator-activated receptors
TSH
thyroid-stimulating hormone
T4
thyroxine
BACKGROUND
Obesity is known to increase the risk of various chronic diseases, such as hypertension, diabetes, coronary heart disease, and nonalcoholic fatty liver disease [1]. A prospective cohort study on American adults reported on the association between obesity and the mortality of cancer, in which men with higher body mass index (BMI) showed higher risk of mortality due to gastric and prostate cancer and women with higher BMI showed higher risk of mortality due to breast, uterine, cervical, and ovarian cancer [23]. When compared to the prevalence of obesity (BMI > 30 kg/m2) among Korean adults (≥ 19 years) in 1998 vs. 2014, the value has increased from 1.7% to 5.3% on men, 3.0% to 4.3% on women according to Korea National Health and Nutritional Examination Survey by Korean Ministry of Health and Welfare [4].
It is well known that alterations in the endocrine system are associated with the risk of obesity. The endocrine system (i.e., pituitary gland, thyroid gland, pancreas, adrenal gland, and gonads) produces and secretes hormones inside the human body, which play a role in maintaining homeostasis, metabolism, and physical growth and development [5]. Previous studies reported on the hormonal changes caused by over-nutrition or lack of exercise. However, recent studies began to report a result that an endocrine disrupting chemical (EDC) called obesogen can enter the human body and disrupt the actions of endocrine hormones [6]. It was also argued that hormonal changes caused by chemicals cause imbalance in weight control by affecting lipid homeostasis and adipogenesis in the adipose tissue, thereby increasing the risk of obesity [7].
Phthalate is one of the well-known EDCs, and is commonly used as a plasticizer in processing plastic products. Phthalates are divided into 2 groups depending on the molecular weight. Low molecular weight phthalates are di-ethyl phthalate, di-methyl phthalate, and di-n-butyl phthalate (DBP). These are generally used in solvents, adhesives, cosmetics or personal hygiene products. On the other hand, high molecular weight (HMW) phthalates include di-(2-ethyl-5-carboxypentyl) phthalate (DEHP) and butyl-benzyl phthalate (BBzP). These compounds are usually used in polyvinyl chloride-based products such as children's toys or food package bags due to their flexibility, durability, and heat resistance [8]. The physicochemical properties of phthalates include high boiling point and low volatility. Consequently, they do not form chemical bonds with plastic materials and are easily released into the environment, being exposed to humans through the respiratory system and skin [9]. It has been recently reported that phthalates act as hormone analogs causing endocrine disruption, which not only disrupts sex hormones and thyroid hormone, but affects obesity [1011].
Among previous studies, Buser et al. [12] reported that DEHP metabolites mono-(2-ethyl-5-carboxypentyl) phthalate (MECPP), mono-(2-ethyl-5-hydroxyhexyl) phthalate (MEHHP), mono-(2-ethylhexyl) phthalate (MEHP), and mono-benzyl phthalate (MBzP) had statistically significantly positive associations with obesity among adults. Yaghjyan et al. [13] conducted a study on female adults in which mono-butyl phthalate and MEHP were positively associated with obesity. However, Hatch et al. [14] reported that mono-n-butyl phthalate (MnBP) and MEHP showed statistically significantly negative association with obesity in adults aged 60–80 years.
Epidemiological studies on the associations between phthalate metabolites and obesity are limited, particularly in study on adult Korean population using large-scale data. Thus, the objective of the present study was to investigate the associations between urinary phthalate metabolites and obesity among Korean adult population using sample data representative of Korea.
METHODS
Study population
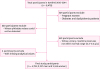
The present study used data from the second Korean National Environmental Health Survey (KoNEHS) 2012–2014. The purpose of KoNEHS is to investigate nationwide changes in the exposure levels of hazardous materials and continuously analyze the factors that affect these changes in order to generate data for establishing environmental health policies. The second KoNEHS covered a 3-year period from 2012 to 2014 and the survey population consisted of 6,478 adults (≥ 19 years) from 400 enumeration districts. The survey included questionnaires on environmental exposure, 19 types of clinical tests, and distribution levels of 21 types of environmentally hazardous materials in blood and urine specimens, including phthalate metabolites. For the present study, we collected data for urinary phthalate metabolites and BMI measurements including the height and weight of 4,752 adults (≥ 19 years). We discarded 821 individuals with medical conditions directly associated with obesity, including pregnant women and diabetes and dyslipidemia patients. In addition, 220 individuals, whose phthalate values could not be detected and 681 individuals whose urinary creatinine level was not within normal range (0.3–3.0 g/L) were also excluded. Those with missing analytical values were excluded for the final analysis. Taken together, 2,197 men and 2,555 women were selected as the study population (Fig. 1).
Measurement of urinary phthalate metabolites
Five urinary phthalate metabolites were analyzed: Metabolites of DEHP—i.e., MECPP, MEHHP and mono-(2-ethyl-5-oxohexyl) phthalate (MEOHP)—a metabolite of BBzP called MBzP, and a metabolite of DBP called MnBP. The DEHP metabolites levels were calculated by adding the concentrations of MEHHP, MEOHP, and MECPP [15]. To standardize for the renal function and urine dilution, MECPP, MEOHP, MEHHP, MBzP, and MnBP concentrations were determined by calibrating with urine creatinine concentration. Spot urine samples were collected from the study participants, stored immediately at 0–4°C, and frozen at −20°C until analysis. With respect to the analytical method, urinary phthalate metabolite samples were hydrolyzed with β-glucuronidase/aryl sulfatase enzyme and extracted with ethyl acetate for analysis by ultra-performance liquid chromatography mass spectrometry. The concentration values of the samples were derived from the calibration curve constructed by standard addition method. Analytical results below the limit of detection (LOD) were substituted with a value of the LOD divided by the square root of 2 before statistical analysis. LOD of phthalate metabolites were 0.34 μg/L for MECPP, 0.26 μg/L for MEOHP, 0.28 μg/L for MEHHP, 0.44 μg/L for MnBP, and 0.27 μg/L for MBzP.
Obesity index: BMI
The value of BMI was calculated from the weight divided by height squared (kg/m2). The adult population (aged ≥ 19 years) was classified as having normal/underweight, overweight, and obese with BMI measures of < 25 kg/m2, 25 ≤ 30 kg/m2, and ≥ 30 kg/m2, respectively.
Covariates
Information on the following variables was extracted from the KoNEHS questionnaires: sex, age, marital status, household income, education, physical activity, alcohol consumption, and smoking. The study participant's socio-demographic variables and health behavior-related variables were classified in the following manner. With respect to age, the study group was classified into units of 10 years starting from the age of 19. With respect to the household income, the study group was categorized into four groups according to the quartile. Categories according to the marital status were single (including divorced/widowed/separated) and married. Categories according to the level of educational attainment were less than high school, graduated from high school, and graduated from junior college and over. Categories according to alcohol consumption were non-drinker (participants who never drank or quit drinking), light drinker (participants who drank less than the heavy drinker), and heavy drinker (a drinker as drinking more than twice per week and having 7 or more glasses for men (5 glasses for women). Categories based on smoking were smoker (participants currently smoking) and non-smoker (those who never smoked or quit smoking). Categories based on exercise status were exercise group (participants who exercised ≥ 3 times a week for ≥ 20 minutes and sweat during exercise) and into the non-exercise group (the rest of the participants).
Statistical analysis
For all statistical analyses, sample data were weighted in the dataset. The weighted percentage/standard error of each variable was calculated to determine the general characteristics of the study population. We performed χ2 tests to investigate the differences in BMI categories according to the general characteristics. Prior to conducting data analysis, the values of phthalate metabolites were log-transformed due to the right skewed pattern of distribution of metabolites. Geometric means (GMs) of urinary phthalate metabolites were calculated according to BMI categories. ANOVA was applied to compare the GM of phthalate metabolites in relation to BMI status. Urinary phthalate metabolites were categorized by quartile distribution. The lowest quartile referred to the reference group. Logistic regression was performed to determine odds ratios (ORs) and 95% confidence intervals (CIs) as a cross-sectional measure of association between phthalate metabolites and BMI categories. Model 1 was adjusted for age, sex, education, marital status, and household income. Model 2 was adjusted for more covariates, physical activity, smoking, and alcohol consumption. Given that the pathophysiology of BMI may differ by sex, similar statistical modeling was performed separately in men and women. To explore potential differences by age and sex, we evaluated the association between phthalates and BMI stratified by < 50 years vs. ≥ 50 years for men and women separately. The logic behind using the value of 50 was that it has been widely accepted as the end of women's reproductive age [1617]. SAS version 9.4 for windows (SAS Institute Inc., Cary, NC, USA) was used to perform statistical analysis.
RESULTS
The weighted distribution of demographic and socioeconomic profiles from total sample (n = 4,752) was analyzed by gender (Table 1). It was found that the percentage of those who were classified overweight and obese was found to be 35.99% and 6.97% among men and 24.19% and 4.78% among women, respectively. The percentage of light- and heavy drinker for male was 15.15% and 29.94% while 16.87% and 10.75% for female, respectively. The χ2 tests were performed on BMI with several independent variables, including age, gender, marital status, household income, education, smoking, exercise and drinking behavior (Table 2). With respect to age, the percentage of those with overweight increased with increase in age. Higher income and education levels tended to show lower percentages of overweight or obese participants, while current smokers and heavy drinkers were observed to show higher percentages of overweight or obese participants.
Table 1
Demographic distributions of the study subjects according to characteristics
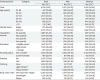
*Weighted percentages after accounting for the sampling design; †Non-smoker: never smoked or quit smoking; ‡Exercise: exercising ≥ 3 times a week for ≥ 20 minutes with sweating; §Light drinker: drinking less than heavy drinker; ‖Heavy drinker: drinking ≥ 2 times a week and ≥ 7 glasses for men (5 glasses for women).
Table 2
Weighted percentages of body mass index groups by characteristics

SE: standard error.
*Weighted percentages after accounting for the sampling design; †Non-smoker: never smoked or quit smoking; ‡Exercise: exercising ≥ 3 times a week for ≥ 20 minutes with sweating; §Light drinker: drinking less than heavy drinker; ‖Heavy drinker: drinking ≥ 3 times a week and ≥ 7 glasses for men (5 glasses for women); ¶p-value by χ2 test; **p-value < 0.01; ††p-value < 0.001.
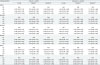
A series of ANOVA was performed to identify differences on the GMs of phthalate metabolites among three BMI groups of normal/underweight, overweight, and obese group (Table 3). The GMs of phthalate metabolites showed higher concentrations among women than in men. Overall pattern was observed such that the overweight and obese groups had lower MnBP concentration than normal/underweight group among men. Among female group, phthalate concentrations in overweight group are greater than those in normal/underweight and obese groups. A series of logistic regression analysis was conducted to examine the associations between phthalate metabolites and obesity with stratification by sex (Table 4). A statistically significantly higher OR for obesity was found for urinary DEHP and MEHHP concentrations for the fourth quartile compared to the lowest quartile in women after adjusting several related covariates (OR:1.52, 95% CI: 1.04–2.21 and OR: 1.72, 95% CI: 1.19–2.49, respectively). We found statistically significantly lower OR for urinary MnBP concentrations for the fourth quartile compared to the lowest quartile in men after adjusting several related covariates (OR: 0.71, 95% CI: 0.50–0.99). We did not find significant associations between other phthalate metabolites and obesity. Logistic regression was performed to examine the associations between phthalate metabolites and obesity with stratification by sex and age after adjusting several related covariates (Table 5). Among women aged ≥ 50 years, urinary DEHP, MEHHP, and MEOHP were found to have a significantly higher ORs for the fourth quartile compared to the lowest quartile (OR: 2.04, 95% CI: 1.31–3.18; OR: 1.94, 95% CI: 1.28–2.94; and OR: 1.88, 95% CI: 1.21–2.94, respectively) and urinary MBzP concentration was found to have a significantly higher OR for the third quartile compared to the lowest quartile (OR: 1.45, 95% CI: 1.02–2.05). However, we did not find significant associations between urinary phthalate metabolites and obesity in men aged ≥ 50 years.
Table 3
Geometric mean of urinary phthalate metabolites (μg/g creatinine) by categories of body mass index

SE: standard error; DEHP: di-(2-ethyl-5-carboxypentyl) phthalate; MEHHP: mono-(2-ethyl-5-hydroxyhexyl) phthalate; MEOHP: mono-(2-ethyl-5-oxohexyl) phthalate; MECPP: mono-(2-ethyl-5-carboxypentyl) phthalate; MBzP: mono-benzyl phthalate; MnBP: mono-n-butyl phthalate.
*,†,‡,§Turkey multiple comparison test; ‖p-value by ANOVA; ¶p-value < 0.05; **p-value < 0.01; ††p-value < 0.001.
Table 4
Odds ratios and 95% confidence intervals for obesity (body mass index > 30 kg/m2) according to urinary phthalate metabolites in men and women
DEHP: di-(2-ethyl-5-carboxypentyl) phthalate; MEHHP: mono-(2-ethyl-5-hydroxyhexyl) phthalate; MEOHP: mono-(2-ethyl-5-oxohexyl) phthalate; MECPP: mono-(2-ethyl-5-carboxypentyl) phthalate; MBzP: mono-benzyl phthalate; MnBP: mono-n-butyl phthalate; Ref: reference.
*Adjusted for age, education, marital status, and household income; †Adjusted for age, education, marital status, household income, exercise, smoking, and alcohol consumption.
Table 5
Adjusted OR and 95% confidence intervals for obesity (body mass index > 30 kg/m2) according to urinary phthalate metabolites stratified by age and sex
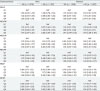
ORs adjusted for education, marital status, household income, exercise, smoking, and alcohol consumption.
OR, odds ratio; DEHP: di-(2-ethyl-5-carboxypentyl) phthalate; MEHHP: mono-(2-ethyl-5-hydroxyhexyl) phthalate; MEOHP: mono-(2-ethyl-5-oxohexyl) phthalate; MECPP: mono-(2-ethyl-5-carboxypentyl) phthalate; MBzP: mono-benzyl phthalate; MnBP: mono-n-butyl phthalate; Ref: reference.
DISCUSSION
The present study examined the association of phthalate metabolites and obesity. To do this, data collected from a total of 4,752 adults were analyzed for the measures of MEHHP, MEOHP, MECPP, MBzP, and MnBP stratified with men and women. The results indicated that DEHP and its metabolite MEHHP were found to be significantly positively associated with obesity among women. In the case of men, however, the only measure of MnBP was found to be negatively associated with obesity. A closer examination of the association of phthalate metabolites and obesity coupled with sex and age revealed that DEHP and its metabolites (MEHHP and MEOHP) and MBzP were significantly associated with obesity among women aged ≥ 50 years. Meanwhile, there were no associations with obesity among men aged ≥ 50 years.
So far, epidemiological studies on the associations between phthalate metabolites and obesity among adults have been very few. Due to limited data availability, studies on the associations between phthalates and obesity by gender and age are inconsistent. Hatch et al. [14] used 1999–2002 the National Health and Nutrition Examination Survey (NHANES) data to analyze the associations between 6 different phthalate metabolites and BMI among 4,369 subjects aged 6–80 years. In the results, mono-ethyl phthalate (MEP), MBzP, and MEHHP showed positive correlations with BMI among men aged 20–59 years. On the other hand, only MEP showed statistically significantly positive correlation among women. Among men aged 60–80 years, only MEP showed statistically significantly positive correlation, whereas other phthalate metabolites, including MnBP, showed inverse correlations among both men and women [14]. In the present study, MnBP and BMI showed negative association among men. Buser et al. [12] used 2007–2010 NHANES data to analyze the associations between phthalate metabolites and BMI based on sex and age. Among all adults, HMW phthalate metabolites—MECPP, MEHHP, MEOHP, MEHP, MBzP, mono-(carboxylnonyl) phthalate (MCNP), and mono-(carboxyoctyl) phthalate (MCOP)—showed statistically significantly high OR for obesity [12]. When stratified by sex, positive associations between obesity and MECPP, MEHHP, and MCOP were maintained among women, but positive associations between obesity and only MCNP were maintained among men. When stratified by age, positive correlations between obesity and HMW phthalate and DEHP were maintained only in men aged ≥ 60 years [12]. Compared to the findings in the present study, positive associations between DEHP metabolites and obesity were consistent when considering all women, but inconsistent when stratified by sex.
The findings of the present study showed differences in the association between phthalates and obesity based on sex and age. Previous studies reported that phthalates may affect obesity through varied mechanisms based on sex and age. Although the mechanism of association between phthalates and obesity is unclear, it is known through previous studies that phthalates affect obesity by altering lipid metabolism and adipogenesis of adipocytes through their involvement with sex hormones (testosterone, estrogen) and nuclear transcription factors, such as peroxisome proliferator-activated receptors (PPARs) [18].
It has been reported that change in sex hormone (estrogen) levels, is associated with obesity in women [19]. Lovejoy et al. [20] reported that abdominal obesity increased in postmenopausal women with serum estrogen deficiency, while Salpeter et al. [21] reported that abdominal obesity decreased when menopausal women were treated with hormone replacement therapy. Previous studies reported that phthalates have anti-estrogenic mechanisms that lower estrogen level. Lovekamp-Swan and Davis [22] showed the action of DEHP metabolites on the female reproductive system through in vivo and in vitro experiments. It was reported that DEHP metabolites suppress estradiol level by inhibiting aromatase transcription in granulosa cells through receptor-mediated signaling pathway [22]. In the present study, positive association between concentrations of DEHP metabolites and BMI were found as age increased among women, possibly due to decrease in estrogen levels with aging and additional anti-estrogenic action by phthalates.
Various studies have reported that DEHP metabolites can increase the risk of obesity by acting as ligands of PPARs. PPARs are comprised of three isotypes—PPARα, PPARβ(δ), and PPARγ—which are transcription factors belonging to the nuclear receptor superfamily [2324]. Previous studies reported that phthalate metabolites can increase adipogenesis by influencing PPARγ. Feige et al. [25] reported on the involvement of phthalates in molecular mechanisms of PPARγ through molecular and cellular assays. Additionally, the association between phthalates and PPARγ was identified through the MEHP induced expression of PPARγ target genes [25]. Hao et al. [26] conducted an in vitro experiment and reported that phthalates not only induced the target genes needed for PPARγ expression and adipogenesis but played an important role in in vivo adipogenesis and the lipogenic pathway. Another possible mechanism is that phthalate metabolites increase the risk of obesity by affecting the thyroid hormone. Knudsen et al. [27] used 1997–1998 Danish large-scale cross-sectional study data to analyze a study group of 4,082 adults aged 18 years or older. Among the thyroid hormones, serum thyroid-stimulating hormone (TSH) showed a positive association with BMI, whereas serum free thyroxine (T4) showed a negative correlation. Based on this, it was stated that thyroid function is associated with increased risk of obesity even in normal thyroid functional status [27]. Park et al. [15] used the same data as the present study in investigating the associations between phthalates and serum thyroid hormones among Korean adults and reported that increase in concentrations of phthalate metabolites showed increase in serum TSH and decrease in total T4.
Unlike women, men showed negative association between MnBP and BMI. Among men, sex hormone testosterone is known to have a negative association with body fat accumulation [28]. Moreover, phthalates have been reported to lower the levels of reproductive hormones, such as testosterone and estrogen, through anti-androgenic action [2930]. Additionally, other studies have suggested associations between phthalate metabolites and sex hormone ratios among men. Meeker et al. [31] selected 425 men treated at an US infertility clinic and reported that levels of DEHP metabolite and testosterone and estradiol levels were inversely associated. Hatch et al. [14] reported that the negative association between phthalate concentration and obesity could be explained by the results based on sex hormone ratios. However, additional studies are needed since the biomolecular mechanism has not yet been clearly identified.
The present study had some limitations. First, because the study was a cross-sectional study, caution should be taken with respect to the directionality of the associations between phthalates and obesity when analyzing the causality. Next, spot urine samples were analyzed for exposure to phthalates. Because the biological half-life of phthalates is only few hours, most of the metabolites are excreted in urine within 24 hours. For example, Shoaff et al. [32] pointed out the nature of the short half-life of phthalate metabolites and difficulties for assessment. However, a previous study reported that spot urine samples can be used to moderately predict the exposure to phthalates for 3 months [33]. Lastly, the present study included confounding variables, but caloric intake that was used in previous studies was not considered as a potential confounder. Despite these limitations, the significance of the present study is that the associations between phthalates and obesity among Korean adults, using large-scale sample data from nationally representative bio-monitoring survey, has been investigated.
CONCLUSIONS
In the present study, we found differences in the associations between urinary phthalate metabolites and obesity based on sex and age. Women showed a significantly positive association between DEHP metabolites and BMI with increase in age, whereas men showed a significantly negative association between MnBP and BMI. Additional studies are necessary to confirm these findings.
 XML Download