

 PDF
PDF ePub
ePub Citation
 Print
Print


INTRODUCTION
The accurate evaluation of cardiac function plays a central role in diagnosing cardiovascular diseases, initiating specific therapeutic interventions, monitoring treatment, and determining the prognosis of a variety of cardiovascular conditions. Among the various imaging modalities, echocardiography is the first and is the most commonly used diagnostic method in cardiology field. It can provide valuable information about the anatomy and function of the heart.1)2) Left ventricular ejection fraction (LVEF) is the most commonly used echocardiographic parameter. It provides objective information about left ventricular (LV) systolic function, and it has been used as a powerful prognostic indicator for various cardiovascular diseases. LVEF has been used to diagnose and classify heart failure (HF),3)4) determine the suitability of device therapy,3)5) decide interventions for valvular heart diseases (VHDs),6)7) determine the need for specific medications,3)5) and predict prognosis.8) However, LVEF is a global volumetric parameter with ventricular load-dependence and had limitations such as significant inter- and intraobserver variability and geometric assumptions.9) Moreover, LVEF does not represent intrinsic myocardial properties.
Strain is a dimensionless index of a change in length between 2 points before and after movement. Myocardial strain can be measured using echocardiography with technical improvements. Strain echocardiography was introduced to the clinical field about 20 years ago, making it a relatively new echocardiographic modality that can measure myocardial deformation. Unlike LVEF, myocardial strain, as calculated by strain echocardiography, can afford indices of regional and global myocardial systolic function noninvasively and objectively.10) Strain echocardiography has been used to diagnose subclinical disease states,11)12) monitor changes in myocardial function with specific therapies,13) differentiate cardiomyopathies,14) and predict the prognosis of several cardiovascular diseases independently of LVEF.15)16)
This review discusses the basic concept, measurement, and clinical utility of 2-dimensional strain echocardiography (2DSTE).
WHAT IS MYOCARDIAL STRAIN?
Myocardial strain is a dimensionless measurement of myocardial deformation calculated as the change between the original length and the final length after contraction divided by the original length and presented as a percentage.17)18) After the contraction, the final length is shorter than the original length, so a negative strain value represents shortening, and a positive strain value indicates lengthening. The strain rate is the change in velocity between 2 points divided by the distance between the points and is represented as s−1.
A strain analysis produces the peak strain, peak systolic strain rate, early diastolic strain rate, and late diastolic strain rate. Peak strain is the maximum strain value in the strain curve. Peak systolic strain is the maximum strain value during the ventricular ejection time. The global value is calculated using the average of all segments of strain measurement. Because the global longitudinal strain (GLS) value is negative, the absolute value |x| is used in this review (except tables) for a simpler interpretation. Systolic movement after systole causes post-systolic strain. The presence of post-systolic strain indicates the possibility of myocardial ischemia. LV dyssynchrony can be assessed using the standard-deviation of the time to peak systolic strain in multiple LV segments.
MEASUREMENT OF MYOCARDIAL STRAIN BY ECHOCARDIOGRAPHY
Myocardial strain can be measured using Doppler tissue imaging (DTI) echocardiography and 2DSTE.
The DTI echocardiographic modality can produce the strain and strain rate using the myocardial velocities. Because angle dependency and regional strain, not global strain, are the major limitations of the DTI methods,17) this modality has seen limited clinical use.
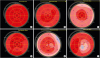
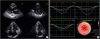
2DSTE, on the other hand, tracks ultrasonic speckles within myocardial tissue to produce regional and global myocardial strain values from 2-dimensional echocardiographic images.19) 2DSTE can produce longitudinal strain, which assesses the apex to base deformation (usually measured from apical views), and radial or circumferential strain calculated from parasternal short-axis views (Figure 1). Although 2DSTE can be affected by afterload, it can give strain values angle-independently with low inter- and intraobserver variability. In 1 study comparing the strain-analyzing algorithms of 9 different vendors, the interobserver relative mean error in measuring the GLS of the LV (LVGLS) ranged from 5.4 to 8.6%, and interobserver mean error ranged from 4.9% to 7.3%.20) These variabilities were superior or at least comparable to those of LVEF measurements (10.1% and 7.9%, respectively).20) Thus, 2DSTE has been adopted in many echocardiographic machines and echocardiographic laboratories.19) 2DSTE uses 2-dimensional images with an optimal frame rate of about 60 frames per second. Several analysis algorithms are available to measure myocardial strain using 2DSTE. EchoPAC PC software (GE Medical Systems, Milwaukee, WI, USA), velocity vector imaging (VVI, Siemens Medical Solutions, Mountain View, CA, USA), and Tomtec software (Image Arena 4.6; TOMTEC Imaging Systems, Munich, Germany) are the most commonly used 2DSTE algorithms (Figure 2).21) After tracing the endocardial border on an end-diastolic frame, the software automatically tracks the contour on subsequent frames. The region of interest is determined automatically and can be adjusted to fit the thickness of the myocardium. The software can provide global and regional myocardial strain values automatically after tracing, and some algorithms provide bull's eye mapping values for the 17 segments (Figure 3).
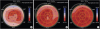
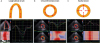 | Figure 1Multidimensional strain measurement analysis by 2DSTE in a healthy individual. Arrows denote the direction of movements. Myocardial shortening shows in the longitudinal (A), circumferential (B), and radial directions (C). Myocardial contraction in the longitudinal and circumferential directions during the systolic period represents a negative strain value, and thickening and lengthening in the radial direction shows a positive strain value.2DSTE = 2-dimensional strain echocardiography.
|
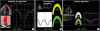 | Figure 2A demonstration of 3 different algorithms in a healthy individual. (A) EchoPAC PC software (GE Medical Systems, Milwaukee, WI, USA), (B) VVI (Siemens Medical Solutions, Mountain View, CA, USA), and (C) Tomtec software (Image Arena 4.6; TOMTEC Imaging Systems, Munich, Germany) are the 3 most commonly used algorithms in 2-dimensional speckle tracking echocardiography. Note the vendor differences in the measurement of GLS.GLS = global longitudinal strain; VVI = velocity vector imaging.
|
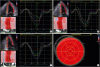 | Figure 3Demonstration of a 2-dimensional strain analysis with GE EchoPAC PC software. After tracing of the endocardial border, the software provides global and regional myocardial strain values automatically in apical 4 chamber (A), apical 2 chamber (B), and apical 3 chamber views (C). The GE EchoPAC algorithm can provide bull's eye maps of regional longitudinal strain values (D).
|
Because vendor differences occur in the measurement of myocardial strain (Figure 2), clinicians should know the analytic method and vendor when interpreting previously published studies. Farsalinos et al.20) compared longitudinal strain measurements among 7 echocardiographic machines and 9 measurement software programs. The reference LVGLS values in 62 volunteers ranged from 18.0% to 21.5%, with absolute differences between vendors of up to 3.7%. Among the 9 vendors, the General Electric (GE) strain was higher than the Philips (Andover, MA, USA) strain. Therefore, researchers should use the same echocardiographic machines and algorithms before and after procedures or treatments they want to test in prospective researches. In retrospective studies comparing the strain change in stored echocardiographic images, researchers can use vendor-independent algorithms. The GE EchoPAC PC software is a vendor-specific algorithm that can measure myocardial strain only from images acquired by GE echocardiographic machines. However, VVI and Tomtec software are vendor-independent and can analyze echocardiographic images from any echocardiographic machine.
MYOCARDIAL STRAIN IN TREATMENT GUIDELINES AND CLINICAL PRACTICE
Because strain echocardiography can detect subclinical myocardial damage22) and objectively compare subtle changes before and after treatment,13) it has been incorporated into current clinical guidelines.23)24) The guidelines for cardio-oncology suggest that a reduction in LVGLS>15% from baseline could suggest the risk of chemotherapeutic-agent-associated cardiotoxicity.23)24) The guidelines recommend the use of same imaging modality that produces high-quality radiation-free imaging for continued screening throughout the treatment pathway. If clinicians want to use strain echocardiography to screen for cardiotoxicity, they should use the same echocardiographic machine and analyzing algorithm in the acquisition and analysis of echocardiographic images.
LVGLS can be used as a marker of systolic LV function in clinical practice. However, the use of strain echocardiography in current clinical practice was still low in 1 survey performed in 2017.25) Although most of the study participants (97%) were aware of strain echocardiography, only 58% of them performed strain echocardiography in their clinical practice or research in Korea. The diversity of strain measurements and lack of normal reference values for myocardial strain are 2 common reasons for not using strain echocardiography in the clinic. Because many study participants had a favorable view of it, the use of strain echocardiography is expected to increase over time.
CLINICAL USE OF STRAIN ECHOCARDIOGRAPHY
Strain echocardiography of the left ventricle
LV is the most common indication of the strain echocardiography, and LVGLS is the most commonly used strain value. It was calculated as the mean GLS value of the apical 4-, 3-, and 2-chamber views.
Normal reference value for the left ventricular global longitudinal strain
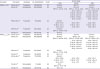
The identification of disease states requires a normal reference value. The normal LVGLS values vary according to the characteristics of the participants and the echocardiographic vendor.26)27) A proposed peak GLS value of 20% was proposed as a reference value for a healthy person.16) Table 1 summarizes the normal reference values for the LV.27)28)29)30)31) In this table, negative values mean systolic shortening, and lower values mean better systolic function. In 1 study of normal Korean adults, the mean LVGLS value was 20.4±2.2%, and females had significantly higher LVGLS than males (21.2±2.2% vs. 19.5±1.9%, p<0.001).27) A meta-analysis of 2,597 subjects from 24 studies reported a normal LVGLS value of 19.7% (95% confidence interval [CI], 20.4% to 18.9%).28) The mean value of normal global circumferential strain (GCS) was 23.3% (95% CI, 24.6% to 22.1%), and the mean global radial strain was 47.3% (95% CI, 43.6% to 51.0%).28) Generally, LVGLS decreases with age.16)
Table 1
Normal reference values for LVGLS by sex and vendor
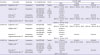
| Parameter | First author | Study type | No. (male/female) | Vendor | Normal range | ||
|---|---|---|---|---|---|---|---|
| Total | Female | Male | |||||
| LVGLS (%) | Sugimoto et al.29) | Prospective | 549 (227/322) | Tomtec | −22.5±2.7 (95% CI, −27.7 to −17.2) | −23.0±2.7 (95% CI, −28.2 to −17.8) | −21.7±2.5 (95% CI, −26.7 to −16.7) |
| Takigiku et al.30) | Prospective | 333 (208/125) | GE | −21.3±2.1 | |||
| 330 (195/135) | Philips | −18.9±2.5 | |||||
| 337 (235/102) | Toshiba | −19.9±2.4 | |||||
| Mora et al.31) | Prospective | 90 (52/38) | GE | −21.1±2.1 | −21.7±2.1 | −20.7±2.0 | |
| Park et al.27) | Retrospective | 501 (236/265) | GE | −20.4±2.2 (95% CI, −25.4 to −16.7) | −21.2±2.2 (95% CI, −26.8 to −17.5) | −19.5±1.9 (95% CI, −23.6 to −16.1) | |
| Yingchoncharoen et al.28) | Meta-analysis | 2,597 | −19.7 (95% CI, −20.4 to −18.9) | ||||
| LVGCS (%) | Sugimoto et al.29) | Prospective | 549 (227/322) | Tomtec | −31.9±4.5 (95% CI, −40.6 to −23.1) | −32.2±4.4 (95% CI, −40.7 to −23.6) | −31.4±4.6 (95% CI, −40.5 to −22.3) |
| Takigiku et al.30) | Prospective | 333 (208/125) | GE | −22.8±2.9 | |||
| 330 (195/135) | Philips | −22.2±3.2 | |||||
| 337 (235/102) | Toshiba | −30.5±3.8 | |||||
| Mora et al.31) | Prospective | 90 (52/38) | GE | −21.6±3.9 | −21.3±3.4 | −21.9±4.3 | |
| Yingchoncharoen et al.28) | Meta-analysis | 2,597 | −23.3 (95% CI, −24.6 to −22.1) | ||||
| LVGRS (%) | Sugimoto et al.29) | Prospective | 549 (227/322) | Tomtec | 37.4±8.4 (95% CI, 21.1 to 53.8) | 38.2±8.5 (95% CI, 21.5 to 54.8) | 36.3±8.0 (95% CI, 20.6 to 52.1) |
| Takigiku et al.30) | Prospective | 333 (208/125) | GE | 54.6±12.6 | |||
| 330 (195/135) | Philips | 36.3±8.2 | |||||
| 337 (235/102) | Toshiba | 51.4±8.0 | |||||
| Mora et al.31) | Prospective | 90 (52/38) | GE | 33.5±10.2 | 32.8±10.7 | 34.0±9.9 | |
| Yingchoncharoen et al.28) | Meta-analysis | 2,597 | 47.3 (95% CI, 43.6 to 51.0) | ||||
Data are shown as mean±standard deviation or number. Negative values mean systolic shortening and lower values mean better systolic function in LVGLS.
CI = confidence interval; GE = General Electric; GLS = global longitudinal strain; LVGCS = left ventricular global circumferential strain; LVGLS = left ventricular global longitudinal strain; LVGRS = left ventricular global radial strain.
![]()
Use in ischemic heart diseases
LVGLS can be used to differentiate ischemic heart diseases in patients with acute chest pain. Some software can produce bull's eye maps to show specific ischemia patterns (Figure 4). Patients with significant coronary artery disease (CAD) have significantly lower LVGLS than healthy people.32) The global longitudinal peak systolic strain is significantly lower in patients with CAD than in patients without CAD (17.1±2.5% vs. 18.8±2.6%, p<0.001). Global longitudinal peak systolic strain is an independent predictor of CAD after adjusting for baseline data, exercise tests, and conventional echocardiography (odds ratio [OR], 1.25 per 1% decrease, p=0.016).
 | Figure 4Two-dimensional speckle tracking echocardiography can produce bull's eye maps that show specific ischemia patterns in patients with ischemic heart disease of the LAD (A), the LCX (B), and the RCA (C).LAD = left anterior descending coronary artery; LCX = left circumflex coronary artery; RCA = right coronary artery.
|
In patients with acute myocardial infarction (AMI), LVGLS correlates positively with the extent of infarction size and the peak concentration of cardiac troponin T level.33)34) Regional wall motion assessment with VVI was used to detect significant ischemia in patients with acute chest pain who visited an emergency room.35) Kim et al.35) showed different peak radial strain values among normal motion, hypokinesia, and akinesia (31.74±9.15% for normal, 24.33±6.28% for hypokinesia, 20.30±7.78% for akinesia, p<0.01).
LVGLS plays a valuable role in determining prognosis. LVGLS assessed after reperfusion in AMI patients was a good prognostic marker for LV remodeling and adverse clinical events.36)37)38) Mechanical dispersion, assessed by the standard deviation of time to peak negative strain from 16 myocardial segments, was a good predictor of ventricular arrhythmias and sudden cardiac death in a prospective multicenter trial.39) Longer mechanical dispersion values reflect more heterogeneous myocardial contractions with increased regional dyssynchrony.
Use in valvular heart diseases
The treatment guidelines for VHD recommend surgical or procedural correction for VHD patients with symptoms and a failing LV.6)7) Prompt intervention can reduce further deterioration of myocardial function and enhance patient survival. However, the determination of optimal timing is difficult in asymptomatic patients with moderate to severe VHD. LVGLS can detect subclinical myocardial dysfunction before an overt reduction in LVEF and can thus be used as a marker to determine intervention time. Therefore, myocardial strain can be used to estimate myocardial performance and determine the optimal timing for surgical or procedural correction.
LVGLS can detect subclinical LV dysfunction in patients with aortic stenosis (AS). Patients with severe AS and LVEF in the normal range had decreased LVGLS compared with controls. Decreased LVGLS was also associated with an increased LV mass index and myocardial dysfunction.40) LVGLS was a significant predictor of death and aortic valve (AV) replacement in asymptomatic patients with severe AS and normal LVEF (hazard ratio [HR], 1.14 for 1% of LVGLS; 95% CI, 1.01 to 1.28; p=0.037).41) An LVGLS <15.0% was associated with significant excess mortality after adjustment for the Society of Thoracic Surgeons (STS) predicted risk of morbidity and mortality score, transaortic peak pressure gradient, AV calcification, and valvulo-arterial impedance. In asymptomatic patients with moderate to severe AS, an LVGLS of 15.9% could be used as a reference value in the prediction of adverse events, and patients with LVGLS <15.9% had a poor prognosis.42) Preserved LVGLS (>17.0%) was a positive prognostic marker in patients with paradoxical low-flow, low-gradient severe AS.43)
In patients with severe mitral regurgitation (MR), LVGLS can provide prognostic information. Decreased resting LVGLS (<18.0%) before surgical mitral valve (MV) repair was associated with post-operative LV dysfunction in patients with severe MR, regardless of baseline LVEF.44) Another study with moderate-to-severe primary MR showed that decreased LVGLS (<19.9%) was significantly and independently associated with long-term LV systolic dysfunction after MV repair.45) Mentias et al.46) also showed that reduced exercise capacity and decreased resting LVGLS (<21.0%) were associated with mortality, adding prognostic value to other parameters indicating a negative prognosis such as STS score, LV end-systolic dimension, and an effective MR orifice.
Use in heart failure
Myocardial strain is a systolic parameter that can be used to diagnose and treat HF. LVGLS is reduced in patients with HF regardless of their LVEF, and it has demonstrated better prognostic value than LVEF in a large cohort of patients with acute HF and echocardiographic studies.47)
HF patients with reduced ejection fraction (HFrEF), especially those with dilated cardiomyopathy, have reduced GCS, suggesting impaired myocardial thickening. Cho et al.48) found that LVGCS was a more-powerful predictor than LVEF of adverse cardiac events in 201 HFrEF patients (HR, 1.15 per 1% decrease of LVGCS; 95% CI, 1.04 to 1.28; p=0.006).
In HF patients with preserved ejection fraction (HFpEF), diastolic dysfunction is considered a key pathophysiologic finding. LVGLS can detect systolic myocardial dysfunction in patients with HFpEF. Park et al.47) found decreased LVGLS values in about 84% of patients with HFpEF, and decreased LVGLS was associated with increased all-cause mortality, even in patients with HFpEF. Impaired systolic performance, as assessed by an LVGLS <15.8%, was found in 52% of study patients with HFpEF, and it was a significant prognostic marker of adverse clinical outcomes, including cardiovascular death, HF hospitalization, or aborted cardiac arrest in the Treatment of Preserved Cardiac Function Heart Failure With an Aldosterone Antagonist trial.49)
LVGLS is regarded as the most sensitive marker of subclinical myocardial dysfunction, even in asymptomatic patients who have not developed overt cardiomyopathy. In a study of 60 asymptomatic diabetic patients with normal LVEF and 25 age-matched healthy volunteers, decreased LVGLS (<17.2%) correlated with the duration of diabetes and could be used to detect subclinical diabetic cardiomyopathy.50) Moreover, LVGLS and subendocardial radial strain were significantly decreased in patients with poorly controlled diabetes.51) LVGLS correlates with the extent of cardiac fibrosis and myocyte hypertrophy in animal models with hypertension, and an abnormal LVGLS value was associated with the diastolic stiffness of the chamber.52)
Use in cardio-oncology
HF can result from certain cancer therapies. Cardiotoxicity from anticancer chemotherapy is a leading cause of morbidity and mortality in cancer survivors.23)53) Because the discontinuation of cardiotoxic drugs and prompt HF management can reduce further deterioration of cardiac function in patients undergoing anticancer treatment, the early detection of cardiotoxicity is important. Echocardiography is the most commonly used imaging study in the screening and diagnosis of cardiotoxicity, and LVEF is the gold standard in determining cardiotoxicity. Therefore, LVEF should be assessed before and periodically during treatments for the early detection of cardiac dysfunction.23) Cardiotoxicity is diagnosed when the follow-up LVEF falls below 50%, or when the LVEF decreases by >10% compared to the baseline value.
However, LVEF is a volumetric parameter that does not show myocardial properties. LVGLS has been introduced to screen for and detect cardiotoxicity. Baseline LVGLS can be an effective measurement for discovering patients at high risk for cardiac events. An LVGLS <17.5% was associated with a 6-fold increase in cardiac events after anthracycline-based chemotherapy (p<0.001).54) Follow-up LVGLS was the most reliable marker of myocardial dysfunction, even in patients with normal LVEF. Although no absolute LVGLS value has been set for the detection of cardiotoxicity, a cut-off value of 17.5% to 19.0% can be used.24)55)56) The other indicator is a reduction in LVGLS >15% from the baseline value.23)24) Thus, the use of LVGLS seems to be increased over time in the cardio-oncology fields. For the best comparison of LVGLS values, LVGLS should be measured each time using the same echocardiographic machine and the same analyzing software.
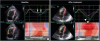
Myocardial strain can be used to determine the effect of a treatment. The use of a beta-blocker can improve cardiac function in patients with anthracycline- and trastuzumab-induced cardiotoxicity.13) The authors showed improved LVGLS in patients treated with beta-blockers (from 17.6±2.3% to 19.8±2.6%, p<0.001). Jung et al. clearly showed that HF medication improved HF symptoms and restored the LVGLS value in a patient with adriamycin-induced cardiotoxicity (Figure 5).57)
 | Figure 5The trend of GLS with treatment of HF in a patient with anthracycline- and trastuzumab-induced cardiotoxicity. GLS was −8.3% at initial presentation (A), improved after 3 months (−13.0%, B), and 6 months of HF management (−17.1%, C) (adapted and modified from Jung MH et al.57) with permission).GLS = global longitudinal strain; HF = heart failure.
|
Use in the differentiation of hypertrophied myocardium
2DSTE can help differentiate pathologic LV hypertrophy from physiologic adaptations (Figure 6). Pathologic LV hypertrophy includes hypertrophic cardiomyopathies and infiltrative cardiomyopathy.
 | Figure 6Representative peak longitudinal strain echocardiographic bull's eye maps from patients with various diseases and a healthy person. (A) Healthy. (B) An athlete with compensatory mild left ventricular hypertrophy and a normal strain plot. (C) Cardiac amyloidosis showing severely reduced strain in the basal and midventricular segments with preservation of the apical segments. (D) Hypertensive heart disease with thickened myocardium. (E) Hypertrophic cardiomyopathy involving the whole ventricle. (F) Apical hypertrophic cardiomyopathy, with reduced strain in the apical segments.
|
Athletes can have a hypertrophied LV, so-called athlete's heart, from intensive and prolonged exercise training,58) and it is difficult to differentiate such a normal adaptation from pathologic changes.59) Butz et al.60) demonstrated that LVGLS can differentiate athlete's heart from pathologic LV hypertrophy. They included 15 hypertrophic cardiomyopathy (HCM) patients, 20 athletes, and 18 normal subjects. LVGLS in the athletes was significantly better than in patients with HCM (15.2±3.6% vs. 8.1±3.8%, p<0.001). Compared with normal populations, athletes have slightly decreased LVGLS values, as shown in previously published data.16)27) However, no study has yet produced a reference value for athletes. In a large cohort including 1,120 trained young athletes, females had better LVGLS than males, and LVGLS decreased as the cardiovascular demand of their sports increased.61)
Patients with HCM usually have reduced LVGLS despite having a normal LVEF.62) LVGLS can detect subclinical myocardial dysfunction in patients with a genetic mutation before the phenotypic expression of HCM.63) LVGLS in HCM patients was significantly lower than that in hypertensive patients, even though both groups had a similar degree of LV hypertrophy.14) The global longitudinal strain rate and early diastolic strain rate of the septum correlated well with the extent of interstitial fibrosis and degree of myocyte hypertrophy and disarray in histologically proven HCM patients.64)
Cardiac amyloidosis is a form of pathologic LV hypertrophy that results from an accumulation of abnormal amyloid proteins in the interstitial spaces of the heart. LVGLS was significantly reduced in cardiac amyloidosis patients.14) Cardiac amyloidosis patients often show a typical strain image pattern, an ‘apical sparing’ or ‘cherry-on-top’ pattern, in the bull's eye maps of GLS analyses (Figure 7).14)65) Because the regional strain values differ significantly between the apex and basal segments, the apical–septal to basal–septal segmental longitudinal strain ratio can be used to diagnose cardiac amyloidosis.66) The relative regional strain ratio (RRSR), a measure of the relative sparing of the apical longitudinal strain, can be used as a prognostic marker, with a high RRSR associated with a higher incidence of poor clinical outcomes in patients with cardiac amyloidosis.67) Reduced LV longitudinal function, as assessed by LVGLS, was an independent prognostic factor of survival in 206 patients with light-chain amyloidosis.68) Fabry disease is an infiltrative disease that has an echocardiographic pattern similar to HCM, and reduced LVGLS was associated with poor myocardial function in patients with Fabry disease.69)
 | Figure 7Typical echocardiography features in a patient with cardiac amyloidosis. Thickened left ventricular wall, up to 14 mm on the conventional echocardiographic study (A). In this representative bull's eye map of longitudinal strain by speckle tracking echocardiography (B), the longitudinal strain of the apex is preserved, in contrast to those of the other midventricular or basal segments, suggesting ‘apical sparing’ or a ‘cherry-on-top’ pattern.GLS = global longitudinal strain.
|
Strain echocardiography of the right ventricle
Strain echocardiography has been also used to measure right ventricular (RV) function.70) Because RV systolic dysfunction is a well-known marker of poor prognosis in many cardiovascular diseases,71)72) the objective assessment of RV function can play an important role in the diagnosis and treatment of pulmonary arterial hypertension (PAH), HF, ischemic heart disease, and other cardiomyopathies. Although many researchers measure RV myocardial strain with the same algorithm of LV strain, there are several limitations including validation with other diagnostic methods, measurement of the RV free wall or total RV (including the interventricular septum), and vendor differences.70)
Unfortunately, no specialized algorithm is available for measuring RV myocardial strain. Therefore, the LV algorithm is used to assess RV myocardial strain. Because the RV has a different anatomy and physiology from the LV, validation studies are needed for this application to the other ventricle. Only longitudinal strain values are used in the measurement of RV myocardial strain; the major difference between RV myocardial strain and LV myocardial strain is the inability to measure circumferential strain and radial strain along with longitudinal strain in the RV.
For validation, several studies have shown a good correlation between GLS of RV (RVGLS) and sonomicrometry, magnetic resonance imaging analyses, and cardiac catheterization data.73)74)75)76)77)78)79)80)81)
Including the interventricular septum in the measurement of RVGLS is another problem. There are 2 kinds of RVGLS measurement; RVGLStotal and RVGLSfree wall (Figure 8). RVGLStotal value includes the strain value of the ventricular septum added to RVGLSfree wall. Debate continues about which parameter better predicts future clinical events.
 | Figure 8A demonstration of the 2 different methods used to measure RV strain. RVGLS can be measured from the RVGLStotal (A) or from the RVGLSfree wall (B).
RV = right ventricular; RVGLS = right ventricular global longitudinal strain.
|
The other problem with RVGLS is the vendor differences. Because echocardiographic machines and analyzing algorithms can produce different values, clinicians should take those factors into account when interpreting study data.
Normal reference value for the right ventricular global longitudinal strain
Because of vendor differences and the possibility of including the interventricular septum in the measurement of RVGLS, we should consider age, sex, echocardiographic machine and analyzing software, and whether the measurement is RVGLStotal or RVGLSfree wall. Table 2 summarizes the normal ranges for RVGLS. In this table, negative values mean systolic shortening, and lower values mean better systolic function.
Table 2
Normal reference values for RVGLS by sex, age, and vendor (adapted and modified from Lee et al.70) with permission)
| Parameter | First author | Study type | No. (male/female) | Vendor | Normal range | ||
|---|---|---|---|---|---|---|---|
| Total | Female | Male | |||||
| RVGLStotal (%) | Muraru et al.82) | Prospective | 276 (123/153) | GE | −25.8±3.0 | −26.7±3.1 | −24.7±2.6 |
| Park et al.83) | Retrospective | 493 (232/261) | GE | −21.5±3.2 (95% CI, −21.8 to −21.2) | −20.7±2.9 (95% CI, −21.0 to −20.3) | −22.3±3.3 (95% CI, −22.7 to −21.9) | |
| <30 yr: −22.8±2.5 | <30 yr: −20.8±2.9 | ||||||
| 31–40 yr: −23.2±3.6 | 31–40 yr: −20.1±2.5 | ||||||
| 41–50 yr: −22.5±3.1 | 41–50 yr: −20.4±3.0 | ||||||
| 51–60 yr: −21.8±3.1 | 51–60 yr: −21.0±3.3 | ||||||
| >60 yr: −21.3±3.7 | >60 yr: −21.0±3.0 | ||||||
| Rimbas et al.84) | Prospective | 70 (34/36) | GE | −24.0±3.5 | |||
| <40 yr: −24±3 | <40 yr: −26±3 | <40 yr: −22±2 | |||||
| 41–60 yr: −24±4 | 41–60 yr: −24±4 | 41–60 yr: −23±4 | |||||
| >61 yr: −24±4 | >61 yr: −25±5 | >61 yr: −23±4 | |||||
| Meris et al.85) | Prospective | 100 (54/46) | GE | −24.2±2.9 (95% CI, −30.0 to −17.7) | |||
| Fine et al.86) | Retrospective | 186 (72/114) | VVI | −20.4±3.2 | |||
| RVGLSfree wall (%) | Muraru et al.82) | Prospective | 276 (123/153) | GE | −30.5±3.9 | −31.6±4.0 | −29.3±3.4 |
| Park et al.83) | Retrospective | 493 (232/261) | GE | −26.4±4.2 (95% CI, −26.8 to −26.0) | −26.0 to −25.1 (95% CI, −27.8 to −26.7) | −25.5±3.8 (95% CI, −26.0 to −25.1) | |
| <30 yr: −28.2±3.8 | <30 yr: −25.8±3.7 | ||||||
| 31–40 yr: −28.5±4.7 | 31–40 yr: −24.7±3.5 | ||||||
| 41–50 yr: −27.3±4.0 | 41–50 yr: −25.3±3.6 | ||||||
| 51–60 yr: −27.1±4.2 | 51–60 yr: −25.9±4.2 | ||||||
| >60 yr: −25.2±4.9 | >60 yr: −26.1±3.8 | ||||||
| Meris et al.85) | Prospective | 100 (54/46) | GE | −28.7±4.1 (95% CI, −37.7 to −19.8) | |||
| Fine et al.87) | Prospective | 116 (49/67) | GE | −26.0 ± 4.0 | |||
| Rimbas et al.84) | Prospective | 70 (34/36) | GE | −28.0±6.0 | |||
| <40 yr: −28±6 | <40 yr: −32±5 | <40 yr: −25±4 | |||||
| 41–60 yr: −27±7 | 41–60 yr: −27±7 | 41–60 yr: −26.5±6 | |||||
| >61 yr: −29±7 | >61 yr: −31±7 | >61 yr: −27±5 | |||||
| Fine et al.87) | Meta-analysis | 7 studies | GE | −27±2 (95% CI, −30 to −24) | |||
| Fine et al.86) | Retrospective | 187 (72/114) | VVI | −21.7 ± 4.2 | |||
Data are shown as mean±standard deviation or number. Negative values mean systolic shortening, and lower values mean better systolic function.
CI = confidence interval; GE = General Electric; GLS = global longitudinal strain; RVGLS = right ventricular global longitudinal strain; VVI = velocity vector imaging.
![]()
Use in pulmonary hypertension
RV function can be deteriorated along with increase of pulmonary arterial pressure in patients with pulmonary hypertension. PAH is usually associated with increased pulmonary vascular resistance and subsequent RV systolic dysfunction. The presence of RV dysfunction in PAH patients has been regarded as a sign of poor prognosis. An RV strain analysis plays an important role in detecting RV dysfunction in patients with PAH.88) In patients with PAH, reduced RVGLStotal demonstrated a good correlation with serum B-type natriuretic peptide concentration and 6-minute walking distance.81)89) RVGLStotal also had good correlations with invasive hemodynamic data obtained during right heart catheterization81)90) and RV ejection fraction by cardiac magnetic resonance imaging data (r=−0.69, p<0.001).77) RVGLStotal≤15.5% was associated with poor event-free survival (HR, 4.906; p=0.001) and increased mortality (HR, 8.842; p=0.005).38) Reduced RVGLSfree wall (≤19.4%) was the best predictor of cardiovascular events in patients with PAH.91) Fine et al.92) reported an increased risk (1.46 higher risk of death per 6.7% decline in RVGLSfree wall) in a prospective cohort of 575 patients (mean age 56±18 years; 63% females).
In patients with idiopathic pulmonary fibrosis, RVGLStotal was significantly lower than in the control group, and reduced RVGLStotal (<12.0%) was a marker of poor long-term prognosis (HR, 4.7; p<0.001).93) RVGLS can detect subtle RV changes in patients with systemic sclerosis who have not developed symptoms.94)
Use in acute pulmonary embolism
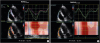
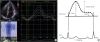
Acute pulmonary embolism (PE) is a form of acute pressure overload in the RV. 2DSTE can quantify and characterize RV systolic dysfunction in acute PE patients (Figure 9). An RV strain analysis can demonstrate decreased midventricular strain in the RV free wall of such patients. Sugiura et al.95) showed decreased midventricular strain and RVGLStotal at the time of diagnosis and a significant improvement in the strain value after treatment. Although the RVGLStotal value was decreased in patients with acute PE, it did not significantly predict adverse long-term clinical events.96) However, decreased RVGLSfree wall (<15.85%) was associated with increased in-hospital events (OR, 1.12; 95% CI, 1.04 to 1.21; p=0.002) in 1 study,97) and midventricular RV strain was associated with unfavorable outcomes, including death, cardiac arrest, and recurrence of acute PE (HR, 2.95; 95% CI, 1.31 to 3.23; p=0.002) in another study.98)
 | Figure 9Demonstration of longitudinal strain in the right ventricle of a patient with acute pulmonary embolism before (A) and after treatment (B). Before treatment, midventricular strain (arrows) decreased, as did the RVGLStotal (A). The midventricular strain (arrowheads) and RVGLStotal improved after treatment.RVGLS = right ventricular global longitudinal strain.
|
Use in heart failure
The presence of RV dysfunction is known to indicate a poor prognosis in HF patients.72) In patients with advanced HF, RV failure is an important prognostic factor for mortality and indicator for advanced management strategies such as the implantation of an LV assist device (LVAD).99) The incidence of RV failure was 9–44% in patients with LVAD implantation.100) Although tricuspid annular plane systolic excursion (TAPSE; a common indicator of RV systolic function) failed to have predictive value, RVGLSfree wall (cutoff value<9.6%) was an independent marker of RV failure after LVAD therapy.101) Cameli et al.102) reported a correlation between RVGLS and the RV stroke work index in 41 patients referred for heart transplantation. The RV stroke work index had a good correlation with RVGLStotal (r=0.75) and RVGLSfree wall (r=0.82), but there was no correlation between TAPSE and tricuspid S′ velocity in these patients.
RVGLSfree wall showed a good correlation with RV myocardial fibrosis, which is a major pathophysiologic process in severe systolic HF (r=0.80, p<0.001).103) RVGLStotal and RVGLSfree wall both showed significant correlation with the symptomatic status of HF patients.104) RVGLStotal can be used as a poor prognostic marker in patients admitted for acute HF.105) Park et al.105) reported that reduced RVGLStotal (<12.0%) was associated with increased total mortality, and patients with biventricular dysfunction (LVGLS<9.0% and RVGLStotal<12.0%) had poorer survival than those without biventricular dysfunction (HR, 1.755; 95% CI, 1.473 to 2.091; p<0.001).
Use in ischemic heart disease
RVGLStotal determined using the GE algorithm correlated significantly with RV ejection fraction determined by cardiac resonance imaging (CMR, r=−0.797, p<0.001), and RVGLS≤15.4% was associated with a lower 1 year event-free survival than an RVGLS>15.4% (93.0% vs. 67.2%, p=0.030) in patients with ischemic cardiomyopathy.78) Impaired RVGLStotal (<15.5%) determined using the VVI algorithm correlated with a significantly lower survival rate and event free survival rate in patients with inferior AMI.71) RVGLStotal better correlated with the RV ejection fraction determined by CMR and had superior power to detect RV dysfunction (defined as an RV ejection fraction <50%) compared with other conventional RV parameters.80)
Use in cardiomyopathy involving the right ventricle
Arrhythmogenic RV cardiomyopathy (ARVC) is a rare disease in which fatty tissue replaces the normal RV myocardium. The reduced RVGLS seen in this condition can result from fatty deposition in the RV free wall. In 1 study with 14 patients with ARVC and 56 controls, the ARVC patients had significantly reduced RVGLSfree wall compared with the controls (17.8±6.7% vs. 24.6±4.5%, p<0.001).106) A cut off value of RVGLSfree wall <18% seemed to be superior to other conventional parameters.106)107)108) Also, RVGLS can detect the early stages of this disease.
RVGLS can be decreased by RV involvement in the pathologic processes of HCM. In 1 study comparing HCM and athletes with competitive endurance training, RVGLStotal was lower in the HCM patients than in the athletes.109) D'Andrea et al.110) reported that RVGLStotal and RVGLSfree wall both decreased in HCM patients compared with normal controls before and after exercise. They showed good correlation between exercise capacity and RVGLStotal (r=−0.56, p<0.001) and decreased contractile reserve in HCM patients.
Strain echocardiography of the left atrium
The left atrium (LA) modulates LV filling through 3 functions: reservoir for pulmonary venous flow during ventricular systole, conduit for pulmonary venous flow during early ventricular diastole, and booster pump function for atrial contraction during late ventricular diastole. Conventionally, echocardiography measures the size and volume of the LA and determines its function by volumetric analysis.16) Unlike conventional echocardiography, strain echocardiography can provide information about all 3 functions of the LA (Figure 10).111)112)
 | Figure 10A left atrial strain analysis using 2DSTE in a healthy adult (A) and an illustration of the 3 phases of LA function (B) with an R-R gating analysis.LA = left atrium; PACS = peak atrial contraction strain; PALS = peak atrial longitudinal strain; 2DSTE = 2-dimensional strain echocardiography.
|
In measuring LA strain, there is a lack of consensus about which regions to include in the calculation. A European task force recommended including only the lateral wall in measuring LA strain.113) In 1 meta-analysis study, the normal reference range for reservoir strain was 39% (95% CI, 38% to 41% from 40 articles), for conduit strain was 23% (95% CI, 21% to 25% from 14 articles), and for contractile strain was 17% (95% CI, 16% to 19% from 18 articles).112)
LA strain is commonly used to predict atrial fibrillation (AF) and future cardiovascular events. Reduced LA function is commonly found in AF patients, and impaired LA strain values are associated with future cardiovascular events.114)115) The LA reservoir and pump functions are reduced in patients with paroxysmal AF compared with subjects with a normal sinus rhythm regardless of their LA size, and LA functional impairment can be found before enlargement of the LA in patients with paroxysmal AF.116) Also, reduced LA strain was associated with the progression from paroxysmal AF to persistent AF in 1 study.117) A higher LA strain value after catheter ablation appeared to indicate a greater likelihood of maintaining the sinus rhythm.114)
The LA reservoir function can be used as a marker of future embolic events in patients with AF, and LA reservoir strain was associated with reduced future embolic risk (OR, 0.74; 95% CI, 0 to 0.82; p<0.001), with 15.4% as a cut-off level for higher embolic risk.118)
Reduced LA strain is a valuable parameter in the diagnosis and risk stratification of other diseases. Reduced LA reservoir strain (<17.5%) was used to diagnose HFpEF with a sensitivity of 89% and a specificity of 55%.119) LA reservoir strain was strongly associated with sudden cardiac death and HF hospitalization in HFpEF patients (HR, 0.96 per 1% increase in strain; 95% CI, 0.94 to 0.99; p=0.009),120) and in AMI patients (HR, 0.88 per 1% increase in strain; 95% CI, 0.85 to 0.90; p<0.001).121) However, that independent prognostic power disappeared after adjustment for LVGLS.
LA reservoir strain can be used to identify a need for MV surgery in patients with severe primary MR, and an LA reservoir strain ≤24.0% was associated with worse survival irrespective of preoperative symptoms in a prospective study.122) Reduced LA reservoir function was a significant and powerful predictor of cardiovascular death and MV surgery prompted by HF development (HR, 0.916 per 1% increase of LA strain; 95% CI, 1.29 to 10.05; p=0.014).123) An LA reservoir strain <21.0% independently predicted death, hospitalization, and HF worsening in patients with severe AS (HR, 2.88; 95% CI, 1.01 to 8.2; p=0.04).124)
CONCLUSIONS
Strain echocardiography has been used for about 20 years to measure myocardial deformation. Unlike LVEF, which measures volumetric changes in the LV, myocardial strain can provide objective myocardial information regionally and globally. Myocardial strain can easily be measured with 2DSTE on current echocardiographic machines at the time of echocardiographic examination. Although myocardial strain is easy to use and has many advantages over conventional echocardiographic indices, many cardiologists do not believe that myocardial strain can replace other echocardiographic indices including LVEF in the clinical field. Common reasons for not using myocardial strain in clinical applications include the complexity of strain measurement, diversity of measurements (including vendor differences), and a lack of normal reference values. However, those problems can be solved with technical improvements and clinical studies. Because myocardial strain has many advantages over other echocardiographic indices, including objective measurement with low inter- and intra-observer variabilities, early-stage detection (before symptom onset), and good prognostic value for future clinical events, it can be used with other conventional echocardiographic parameters to provide additional information during clinical decision making.
 XML Download