

 PDF
PDF ePub
ePub Citation
 Print
Print


INTRODUCTION
Vitamin D is known to play a major role in the development and maintenance of the skeleton and muscles in our body because of its ability to regulate calcium and phosphorus absorption.[1] The incidence rate of vitamin D deficiency in Korea has been steadily increasing. The rate of vitamin D deficiency was reported to have increased to 77.9% in 2010 to 2014; the cost of medical treatment has also increased. The rate of vitamin D deficiency is higher in women in the 10 to 20-year age group than in those in other age groups.[2]
Serum vitamin D levels are known to be influenced by sun exposure, season, dietary intake, obesity, and age. In particular, pregnancy, lactation, and estrogen secretion have been known to affect vitamin D levels in women.[3] Many studies have been conducted on the health effects of vitamin D, and recently, a relationship has been reported between vitamin D and obesity.[45] Adults with vitamin D deficiency had a high risk of chronic disease [6] and a high body fat percentage in the group with deficient vitamin D.[7]
In pre-menopausal women, vitamin D deficiency was positively correlated with body mass index (BMI). US studies have shown that the risk of vitamin D deficiency is 3 times higher in individuals with high levels of obesity than in individuals with normal weight.[8] Vitamin D status of young women is important because women need to maintain adequate levels of vitamin D during pregnancy, childbirth, and menopause.[9] In general, increased exposure to sunshine and intake of food or supplements with high vitamin D content are recommended for maintaining sufficient vitamin D levels.[10] But, adolescents and young adults, who need to maintain maximum bone mass due to low activity and unbalanced dietary intake, are vulnerable to vitamin D deficiency.[1112] However, most studies on this subject have been limited to post-menopausal women and elderly patients and studies on nutritional intake are lack.
In this study, we aimed to examine the differences in vitamin D levels, bone density, and nutritional intake in young women according to BMI. We intend to use these results as basic data for emphasizing prevention and management of obesity and promotion of bone health in young women.
Go to : 
METHODS
1. Study subject
This study recruited 156 healthy students from domestic universities. The exclusion criteria were as follows. Those who have usual illness (n=2), those who intake bone-related medication, vitamin D and calcium supplements (n=9), those who have a weight change of more than 10% over the last 6 months (n=2) were excluded from the study. Therefore, only 143 data were used for the analysis of results except for 13 subjects. The subject, purpose, and content of the study were explained to all subjects, and they agreed to participate in the study. The design and progress of the overall study was approved by the Institutional Review Board of Soonchunhyang University.
2. Study variables
BMI was calculated by measuring height and weight using an automatic composition analyzer (X-SCAN PLUS; Jawon Medical Co., Seoul, Korea); body fat percentage, body fat mass, and fat mass were also calculated. Bone mineral density (BMD) was measured using dual energy X-ray absorptiometry (DXA; Lunar Prodigy Advance; GE Lunar, Madison, WI, USA). Osteopenia, BMD T-score below −1.0, and osteoporosis, BMD T-score below −2.5, were diagnosed on at any site of the lumbar spine, femur neck and total hip lumbar spine BMD according to World Health Organization criteria.[13] Blood samples were collected from the subjects after they had fasted for 8 hr, and the samples were analyzed using an automatic blood analyzer (Hitachi 760-210; Hitachi Co., Tokyo, Japan). Triglyceride, total cholesterol, high-density lipoprotein cholesterol, low-density lipoprotein (LDL) cholesterol, fasting blood glucose, and serum vitamin D levels were measured. Vitamin D status was categorized as follows: “deficient”=vitamin D level <20 ng/mL; “relatively insufficient”=vitamin D level ≥20 ng/mL and <30 ng/mL; and “sufficient”=vitamin D level ≥30 ng/mL.[14]
Physical fitness and physical activity were also investigated; these procedures followed the suggestion of the Young Men's Christian Association.[15] The sit-and-reach method was used to measure flexibility of the hamstring muscles and lower back. Standing long jump was used to measure the muscular fitness of leg muscles. The tests were repeated thrice, and the best performance was recorded. We also measured the number of times a subject could sit and stand per minute. Grip strength was measured using a digital dynamometer (TKK 5401; Takei, Niigata, Japan). After explaining the types of muscle and aerobic exercise, we collected information about the number of exercises performed per week.
Data on dietary intake amount were collected using 3-days food record method for 3 days and intakes of nutrients were analyzed with the CAN program (The Korean Nutrition Society, ver. 5.0). The subjects were classified into 2 groups: the obesity group, subjects with BMI ≥25 kg/m2 [16] and the normal weight group, subjects with BMI <25 kg/m2. In this study, pre-obesity subjects were included as normal weight group to more clearly evaluate the results according to obesity.
3. Statistical analysis
The mean and standard deviation were calculated using SPSS software program ver. 18.0 (SPSS Inc., Chicago, IL, USA). We performed the Kolmogorov-Smirnov test to check whether the continuous variables were normal distribution. All data were reported as mean±standard deviation or as numbers and percentages. Groups comparisons used χ2 tests for qualitative variables and independent t-test for quantitative variables. All results were considered statistically significant when P<0.05.
Go to :
RESULTS
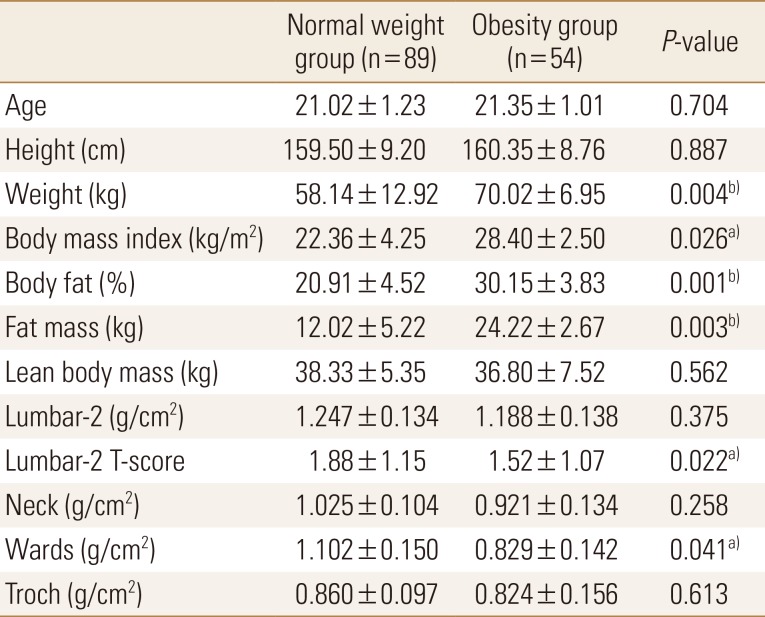
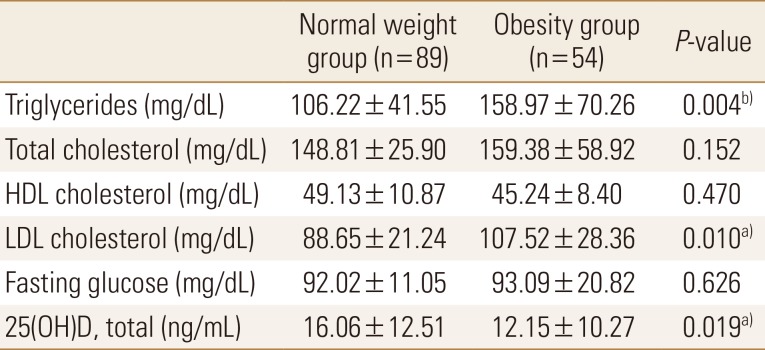
Of the total subjects, normal weight group was 62.2% (n=89) and obesity group was 37.8% (n=54). Body weight, BMI, body fat percentage, and body fat mass were significantly higher in the obesity group than in the normal weight group; contrastingly, lumbar T-score and wards bone density were significantly lower in the obesity group than in the normal weight group (Table 1). Compared to standard values, blood parameters were normal in both groups; however, triglyceride and LDL cholesterol levels were significantly higher in the obesity group than in the normal weight group. Vitamin D was found to be deficient in both groups, and the concentration of obesity group was significantly lower (Table 2).
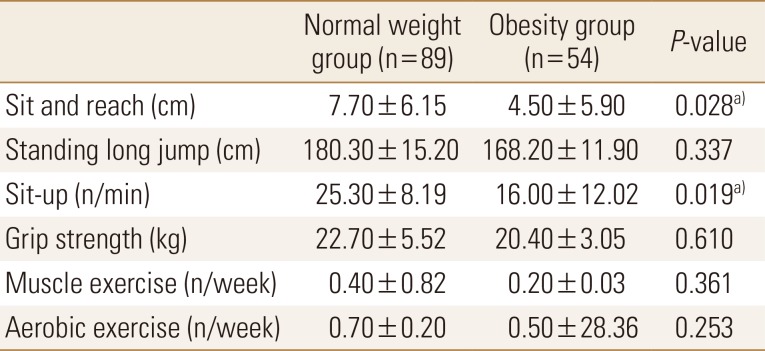
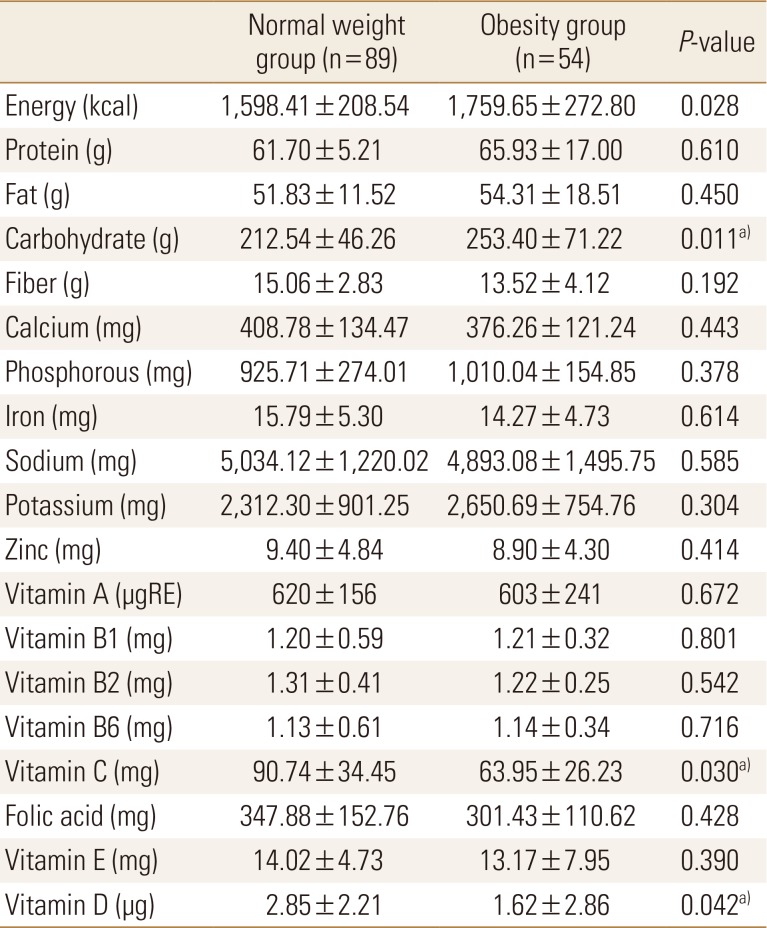
With regards to physical activity, the scores of the sit-and-reach and sit-up tests were significantly lower in the obesity group than in the normal weight group. Exercise frequency was very low in both groups (Table 3). On comparing nutritional status between the 2 groups, we found that carbohydrate intake was significantly higher and vitamin C and D intakes were significantly lower in the obesity group than in the normal weight group. Other nutrient intakes were not significantly different between the 2 groups (Table 4).
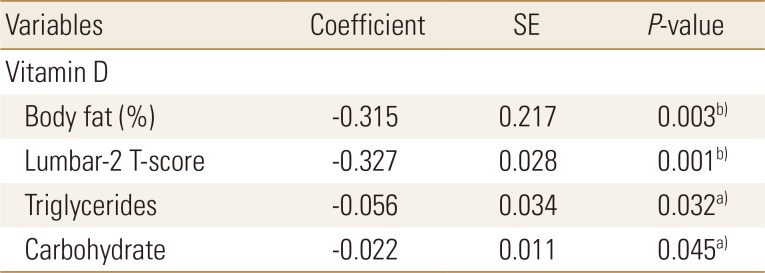
Body fat percentage, Lumbar-2 T-score, triglyceride levels, and carbohydrate intake were found to be the major determinants of serum vitamin D levels in the obesity group (Table 5).
Go to :
DISCUSSION
Recently, there has been an emphasis on the importance of vitamin D as it has been reported that vitamin D deficiency can increase the risk of various chronic diseases, along with influencing bone metabolism.[17] Sufficient Vitamin D intake and appropriate physical activity are effective countermeasures for preventing exposure to vitamin D deficiency.[18] The purpose of this study was to investigate vitamin D deficiency status in young adult women according to the obesity index and to analyze factors affecting vitamin D deficiency.
Body fat percentage and body fat mass were significantly higher in obesity group than normal weight group. The results were not significant, but the lean body mass of obesity group was slightly less. Obesity is associated with metabolic syndrome and oeteopenia due to lack of physical activity, changes in hormones, and imbalance in nutrition.[19] Although we cannot confirm whether obesity group is sarcopenic obesity, obesity group seems to need efforts to reduce body fat and increase muscle mass. Although the value of lumbar-2 T-score was significantly lower in the obesity group, the mean value of lumbar 1–4 was not significantly different and the results of BMD were normal in both groups. Previous studies have shown that adipokines are associated with bone metabolism [20] and that central obesity increases osteopenia or osteoporosis due to decreasing bone density seen with increasing waist-to-hip ratio, an index of central obesity.[21] However, more research is needed on the physiological mechanisms and causes of this relationship.
Triglyceride and LDL cholesterol levels were slightly higher whereas vitamin D levels were significantly lower in the obesity group than in the normal weight group. Especially, the subjects were “deficient” for vitamin D. Recently, the expression of enzymes affecting vitamin D metabolism has been demonstrated in adipocytes, and the relationship between obesity and vitamin D is increasing.[20] Obesity is known to decrease vitamin D synthesis by increasing the expression of enzymes that adversely affect vitamin D metabolism.[2223]
Studies involving adults in Europe have also reported that vitamin D levels tend to decrease with increasing BMI.[24] In addition, physical activity and physical strength were lower in the obesity group than in the normal weight group; vitamin D intake was also insufficient in the obesity group. Therefore, various factors were expected to influence vitamin D levels. In addition, young women have a perception that ultraviolet rays are harmful to the skin, and therefore, health awareness to raise the vitamin D level should also be improved when considering the preliminary study that 85% [2]; however, we did not analyze this factor in this study.
Nutrient intakes were lower in the 2 groups than in the younger group, which was estimated to be 2,100 kcal; dietary fiber, calcium, vitamin C, folic acid, and vitamin E levels were inadequate in both groups.[25] Vitamin C and D intakes were significantly lower in the obesity group than in the normal weight group. In domestic study, obesity women have been associated with higher health risk due to lower variability of food intake than normal weight women.[26] In this study, we could not find the cause of lack of vitamin C and vitamin D intake in obesity group because food intake was not investigated concurrently. Because calcium and vitamin D are very important for skeletal health, it is necessary to emphasize intake of calcium- and vitamin D-containing food that can satisfy it; furthermore, awareness for increasing antioxidant nutrient intake is necessary.
Factors affecting serum vitamin D levels in the obesity group included body fat percentage, bone density, triglyceride, and carbohydrate intake. Recently, health concerns have increased with the increase in sugar consumption in the younger generation.[27] In the past, many studies reported that nutrient and carbohydrate intakes were lower in the low BMD group than in the normal BMD group.[28] Balanced dietary intake should be emphasized for preventing osteoporosis rather than the effects of excess/deficient carbohydrate intake on bone density.
Our data had certain limitations as it did not reflect factors such as sunlight exposure, sunscreen use, season, smoking status, and do not represent young adult women. Furthermore, there is no clear explanation for the causal relationship between low vitamin D levels in the obesity group and the effects of potential confounding factors.
Go to :
CONCLUSION
In conclusion, obese women had lower levels of serum vitamin D and lumbar-2 T-score than normal weight women. Therefore, not only to maintain normal weight for health, but also nutritional status and physical activity should be managed in multiple way. Future continuous and prospective studies are needed.
Go to :
 XML Download