Abstract
Background
Methods
Results
Conclusions
References
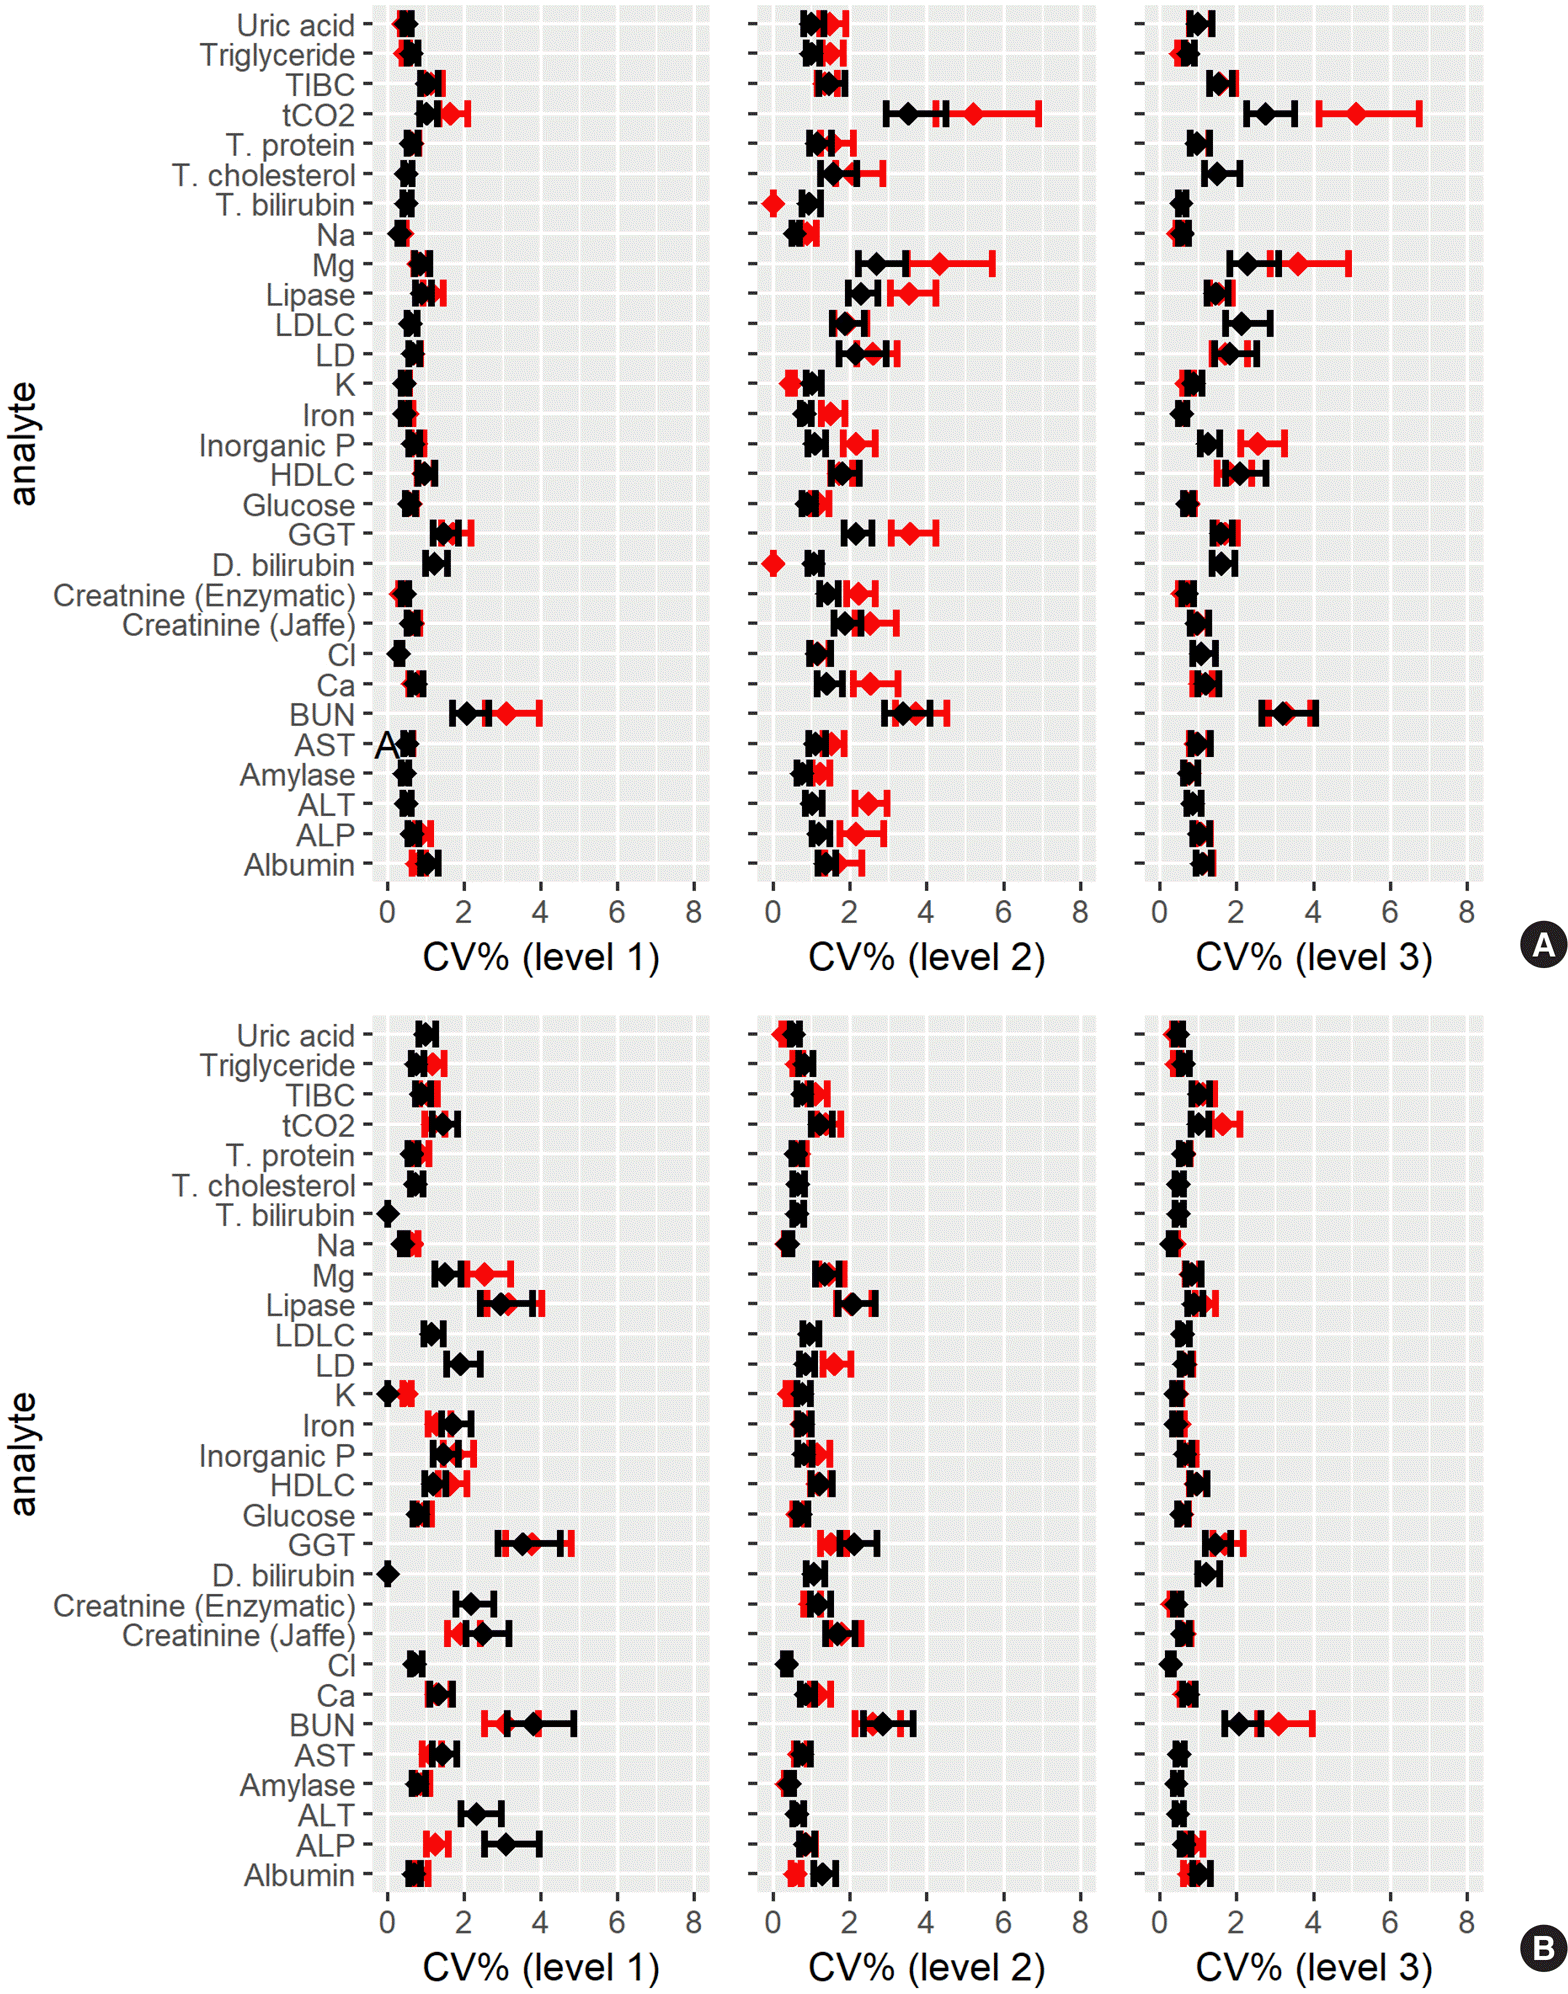
Fig. 1.

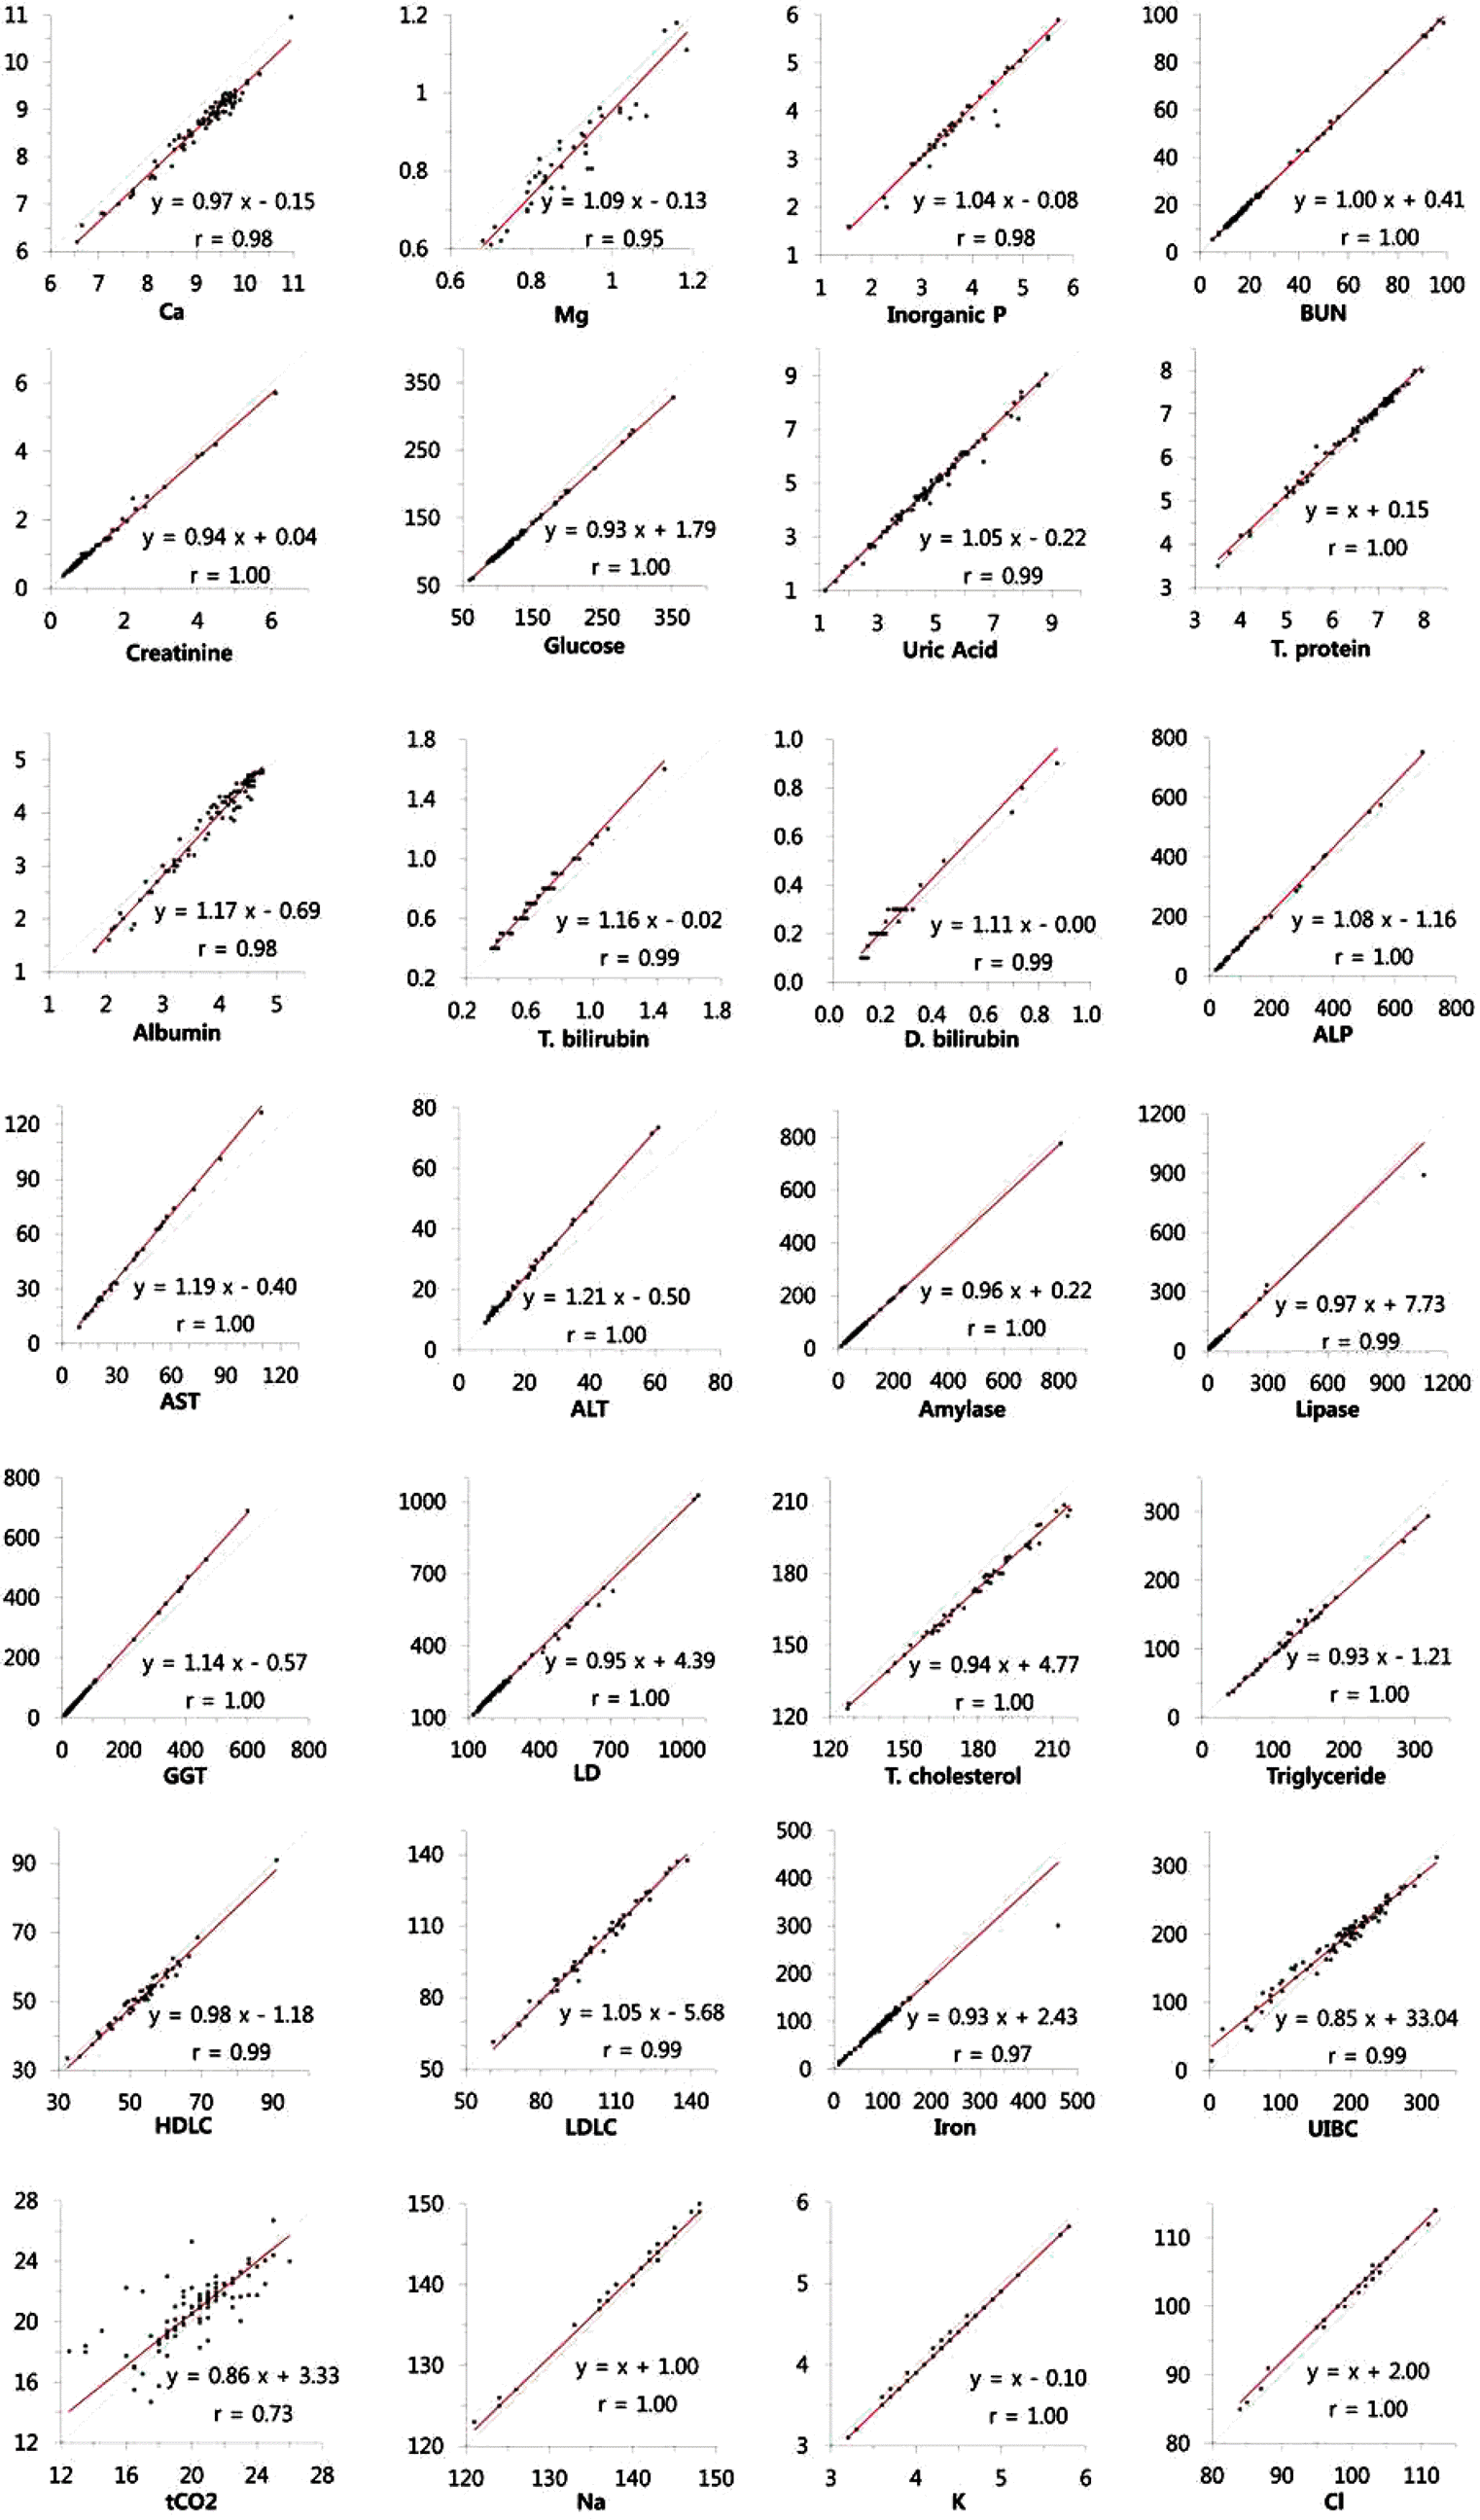
Fig. 2.

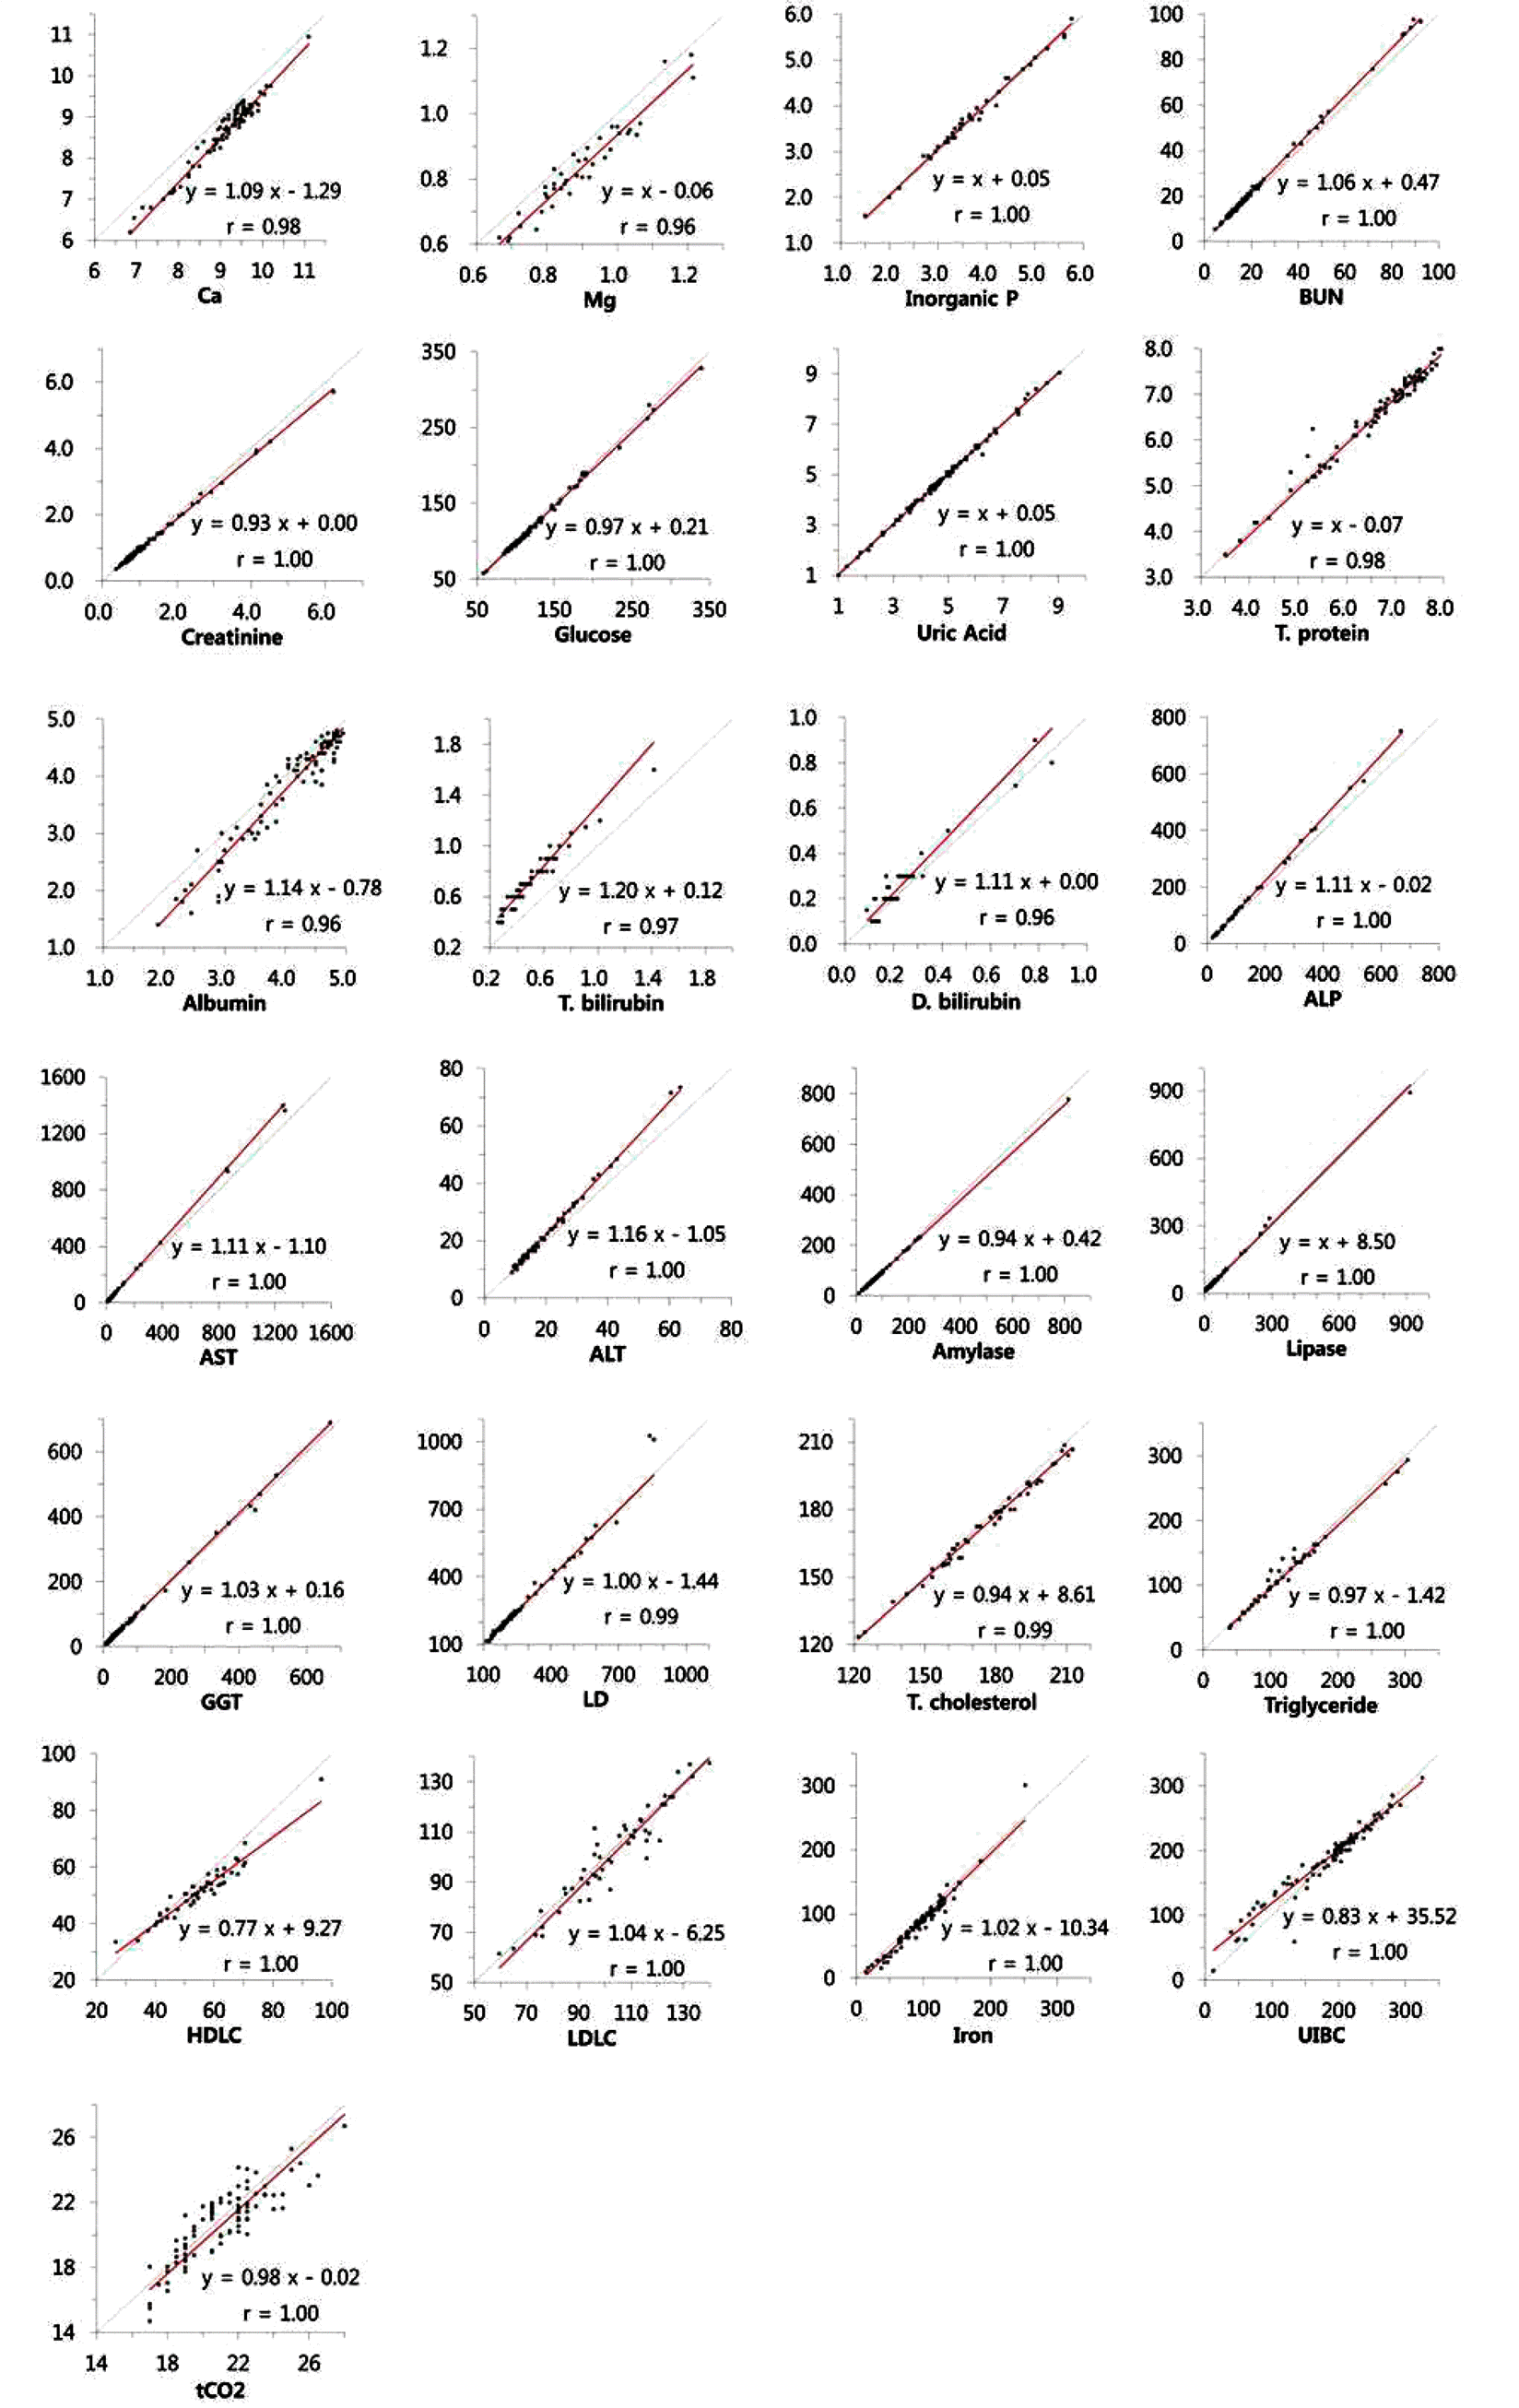
Fig. 3.

Table 1.
| Analyte | Unit | Level | Mean | Repeatability | Within-Laboratory Precision | ||
|---|---|---|---|---|---|---|---|
| Storage∗ % CV (95% CI) | Manual† % CV (95% CI) | Storage∗ % CV (95% CI) | Manual† % CV (95% CI) | ||||
| Ca | mg/dL | 1 | 5.4 | 1.27 (1.04–1.63) | 1.32 (1.08–1.69) | 2.52 (2.08–3.26) | 2.25 (1.85–2.96) |
| 2 | 9.8 | 1.17 (0.96–1.50) | 0.85 (0.70–1.08) | 1.52 (1.27–1.89) | 1.39 (1.14–1.81) | ||
| 3 | 13.1 | 0.64 (0.53–0.82) | 0.72 (0.59–0.92) | 1.06 (0.87–1.37) | 1.19 (0.98–1.54) | ||
| Mg | mg/dL | 1 | 0.42 | 2.51 (2.06–3.21) | 1.48 (1.22–1.90) | 4.33 (3.50–5.71) | 4.61 (3.81–5.84) |
| 2 | 1.08 | 1.45 (1.19–1.85) | 1.34 (1.10–1.71) | 2.33 (1.87–3.10) | 2.69 (2.23–3.45) | ||
| 3 | 1.68 | 0.81 (0.67–1.04) | 0.84 (0.69–1.08) | 3.60 (2.88–4.91) | 2.27 (1.83–3.08) | ||
| Inorganic P | mg/dL | 1 | 2.2 | 1.75 (1.44–2.24) | 1.44 (1.18–1.84) | 2.15 (1.81–2.66) | 1.79 (1.50–2.22) |
| 2 | 4.2 | 1.15 (0.95–1.48) | 0.79 (0.65–1.01) | 1.29 (1.12–1.56) | 1.09 (0.91–1.36) | ||
| 3 | 7.8 | 0.73 (0.60–0.94) | 0.65 (0.53–0.83) | 2.55 (2.11–3.25) | 1.26 (1.06–1.57) | ||
| BUN | mg/dL | 1 | 15.2 | 3.06 (2.51–3.92) | 3.80 (3.12–4.86) | 3.71 (3.19–4.51) | 4.20 (3.59–5.07) |
| 2 | 40.9 | 2.59 (2.13–3.31) | 2.85 (2.34–3.64) | 3.15 (2.68–3.92) | 3.37 (2.89–4.07) | ||
| 3 | 78.9 | 3.09 (2.54–3.96) | 2.06 (1.69–2.64) | 3.28 (2.82–3.92) | 3.20 (2.64–4.05) | ||
| Creatinine (Jaffe) | mg/dL | 1 | 0.8 | 1.89 (1.55–2.42) | 2.47 (2.03–3.16) | 2.52 (2.12–3.19) | 3.36 (2.81–4.28) |
| 2 | 1.8 | 1.78 (1.47–2.28) | 1.66 (1.36–2.13) | 1.82 (1.57–2.17) | 1.86 (1.58–2.29) | ||
| 3 | 8.8 | 0.64 (0.52–0.82) | 0.60 (0.49–0.76) | 0.99 (0.83–1.26) | 0.97 (0.80–1.27) | ||
| Creatinine (Enzymatic) | mg/dL | 1 | 0.8 | 2.16 (1.78–2.77) | 2.16 (1.78–2.77) | 2.21 (1.92–2.65) | 2.29 (1.98–2.73) |
| 2 | 1.7 | 0.96 (0.79–1.23) | 1.17 (0.96–1.49) | 1.30 (1.10–1.60) | 1.41 (1.21–1.70) | ||
| 3 | 8.8 | 0.33 (0.27–0.42) | 0.43 (0.35–0.54) | 0.59 (0.50–0.73) | 0.70 (0.58–0.88) | ||
| Glucose | mg/dL | 1 | 59 | 0.89 (0.73–1.14) | 0.78 (0.64–1.00) | 1.18 (1.00–1.45) | 1.02 (0.87–1.26) |
| 2 | 113 | 0.63 (0.52–0.81) | 0.71 (0.59–0.91) | 0.88 (0.75–1.09) | 0.88 (0.75–1.09) | ||
| 3 | 352 | 0.58 (0.48–0.74) | 0.56 (0.46–0.72) | 0.74 (0.63–0.90) | 0.71 (0.61–0.86) | ||
| Uric acid | mg/dL | 1 | 3.4 | 0.97 (0.80–1.24) | 0.97 (0.80–1.24) | 1.47 (1.22–1.88) | 1.46 (1.22–1.84) |
| 2 | 5.8 | 0.27 (0.22–0.35) | 0.54 (0.45–0.69) | 1.02 (0.80–1.46) | 0.99 (0.80–1.31) | ||
| 3 | 9.6 | 0.40 (0.33–0.52) | 0.47 (0.38–0.60) | 0.97 (0.77–1.34) | 0.99 (0.79–1.36) | ||
| T. protein | g/dL | 1 | 4.1 | 0.83 (0.68–1.06) | 0.62 (0.51–0.79) | 1.54 (1.22–2.09) | 1.49 (1.16–2.09) |
| 2 | 5.8 | 0.67 (0.55–0.86) | 0.59 (0.48–0.75) | 1.18 (0.95–1.56) | 1.14 (0.94–1.52) | ||
| 3 | 6.7 | 0.63 (0.51–0.80) | 0.61 (0.50–0.78) | 0.96 (0.79–1.27) | 0.97 (0.79–1.29) | ||
| Albumin | g/dL | 1 | 5.4 | 0.81 (0.67–1.04) | 0.67 (0.55–0.85) | 1.67 (1.34–2.31) | 1.79 (1.42–2.45) |
| 2 | 3.4 | 0.57 (0.47–0.73) | 1.28 (1.05–1.63) | 1.06 (0.87–1.38) | 1.36 (1.17–1.63) | ||
| 3 | 3.9 | 0.76 (0.62–0.97) | 1.03 (0.85–1.32) | 1.11 (0.95–1.38) | 1.10 (0.93–1.35) | ||
| T. bilirubin | mg/dL | 1 | 0.7 | 0.00 (0.00–0.00) | 0.00 (0.00–0.00) | 0.00 (0.00–0.00) | 0.00 (0.00–0.00) |
| 2 | 3.6 | 0.62 (0.51–0.79) | 0.62 (0.51–0.79) | 0.93 (0.76–1.23) | 0.93 (0.76–1.23) | ||
| 3 | 7.8 | 0.48 (0.39–0.61) | 0.48 (0.39–0.61) | 0.56 (0.48–0.68) | 0.56 (0.48–0.68) | ||
| D. bilirubin | mg/dL | 1 | 0.3 | 0.00 (0.00–0.00) | 0.00 (0.00–0.00) | 0.00 (0.00–0.00) | 0.00 (0.00–0.00) |
| 2 | 1.5 | 1.06 (0.87–1.35) | 1.06 (0.87–1.35) | 1.05 (0.91–1.25) | 1.05 (0.91–1.25) | ||
| 3 | 2.8 | 1.21 (0.99–1.55) | 1.21 (0.99–1.55) | 1.61 (1.36–1.96) | 1.61 (1.36–1.96) | ||
| ALP | U/L | 1 | 33 | 1.23 (1.01–1.57) | 3.08 (2.53–3.94) | 2.15 (1.73–2.87) | 3.45 (2.98–4.13) |
| 2 | 147 | 0.87 (0.71–1.11) | 0.84 (0.69–1.07) | 1.05 (0.90–1.29) | 1.18 (1.00–1.47) | ||
| 3 | 285 | 0.86 (0.71–1.11) | 0.63 (0.52–0.81) | 1.08 (0.92–1.31) | 1.03 (0.86–1.29) | ||
| AST | U/L | 1 | 46 | 1.10 (0.90–1.40) | 1.41 (1.16–1.80) | 1.51 (1.29–1.84) | 1.85 (1.58–2.25) |
| 2 | 120 | 0.69 (0.56–0.88) | 0.76 (0.63–0.97) | 1.15 (0.96–1.43) | 1.10 (0.92–1.37) | ||
| 3 | 278 | 0.50 (0.41–0.64) | 0.50 (0.41–0.63) | 0.94 (0.77–1.28) | 0.99 (0.81–1.31) | ||
| ALT | U/L | 1 | 32 | 2.31 (1.90–2.95) | 2.31 (1.90–2.95) | 2.48 (2.12–2.97) | 2.48 (2.12–2.97) |
| 2 | 101 | 0.62 (0.51–0.79) | 0.62 (0.51–0.79) | 1.01 (0.84–1.28) | 1.01 (0.84–1.28) | ||
| 3 | 197 | 0.47 (0.39–0.61) | 0.47 (0.39–0.61) | 0.85 (0.71–1.08) | 0.85 (0.71–1.08) | ||
| Amylase | U/L | 1 | 41 | 0.85 (0.70–1.09) | 0.76 (0.63–0.98) | 1.21 (1.02–1.48) | 1.27 (1.07–1.59) |
| 2 | 130 | 0.36 (0.30–0.47) | 0.42 (0.35–0.54) | 0.84 (0.69–1.09) | 0.75 (0.62–0.95) | ||
| 3 | 265 | 0.43 (0.35–0.54) | 0.43 (0.35–0.55) | 0.77 (0.64–1.00) | 0.76 (0.62–0.99) | ||
| Lipase | U/L | 1 | 43 | 3.14 (2.58–4.02) | 2.94 (2.42–3.77) | 3.53 (3.06–4.23) | 4.00 (3.41–4.87) |
| 2 | 77 | 2.01 (1.65–2.57) | 2.07 (1.70–2.65) | 2.28 (1.98–2.74) | 2.28 (1.96–2.73) | ||
| 3 | 240 | 1.13 (0.92–1.44) | 0.88 (0.72–1.13) | 1.53 (1.30–1.88) | 1.45 (1.23–1.79) | ||
| GGT | U/L | 1 | 32 | 3.75 (3.08–4.79) | 3.51 (2.88–4.49) | 3.55 (3.07–4.22) | 3.88 (3.35–4.68) |
| 2 | 87 | 1.50 (1.23–1.92) | 2.10 (1.73–2.69) | 1.80 (1.53–2.18) | 2.14 (1.84–2.57) | ||
| 3 | 136 | 1.69 (1.39–2.16) | 1.44 (1.18–1.84) | 1.69 (1.47–2.02) | 1.59 (1.37–1.89) | ||
| LD | mg/dL | 1 | 119 | 1.88 (1.54–2.40) | 1.88 (1.54–2.40) | 2.59 (2.18–3.22) | 2.59 (2.18–3.22) |
| 2 | 189 | 1.58 (1.30–2.02) | 0.84 (0.69–1.07) | 2.14 (1.77–2.78) | 2.14 (1.72–2.93) | ||
| 3 | 435 | 0.66 (0.54–0.85) | 0.64 (0.53–0.82) | 1.70 (1.36–2.29) | 1.81 (1.43–2.52) | ||
| T. cholesterol | mg/dL | 1 | 111 | 0.72 (0.59–0.92) | 0.72 (0.59–0.92) | 2.05 (1.62–2.85) | 2.05 (1.62–2.85) |
| 2 | 183 | 0.64 (0.52–0.82) | 0.64 (0.52–0.82) | 1.56 (1.23–2.17) | 1.56 (1.23–2.17) | ||
| 3 | 249 | 0.48 (0.40–0.62) | 0.48 (0.40–0.62) | 1.50 (1.17–2.09) | 1.50 (1.17–2.09) | ||
| Triglyceride | mg/dL | 1 | 84 | 1.15 (0.94–1.47) | 0.73 (0.60–0.94) | 1.48 (1.27–1.82) | 1.29 (1.06–1.64) |
| 2 | 135 | 0.61 (0.50–0.78) | 0.81 (0.67–1.04) | 0.76 (0.65–0.91) | 0.99 (0.85–1.20) | ||
| 3 | 199 | 0.44 (0.36–0.56) | 0.61 (0.50–0.78) | 0.54 (0.47–0.66) | 0.74 (0.63–0.89) | ||
| HDLC | mg/dL | 1 | 27 | 1.61 (1.32–2.05) | 1.17 (0.96–1.50) | 1.72 (1.49–2.06) | 1.57 (1.33–1.94) |
| 2 | 44 | 1.17 (0.96–1.50) | 1.21 (0.99–1.54) | 1.80 (1.52–2.23) | 1.81 (1.51–2.25) | ||
| 3 | 60 | 0.94 (0.77–1.20) | 0.96 (0.79–1.23) | 1.83 (1.49–2.39) | 2.09 (1.70–2.76) | ||
| LDLC | mg/dL | 1 | 65 | 1.14 (0.93–1.45) | 1.14 (0.93–1.45) | 1.92 (1.59–2.44) | 1.92 (1.59–2.44) |
| 2 | 111 | 0.94 (0.77–1.20) | 0.94 (0.77–1.20) | 1.86 (1.55–2.37) | 1.86 (1.55–2.37) | ||
| 3 | 133 | 0.59 (0.49–0.76) | 0.59 (0.49–0.76) | 2.13 (1.72–2.87) | 2.13 (1.72–2.87) | ||
| Iron | μg/dL | 1 | 73 | 1.27 (1.05–1.63) | 1.69 (1.39–2.16) | 1.50 (1.26–1.87) | 1.75 (1.52–2.10) |
| 2 | 153 | 0.74 (0.61–0.95) | 0.78 (0.64–1.00) | 0.86 (0.75–1.04) | 0.82 (0.72–0.98) | ||
| 3 | 225 | 0.50 (0.41–0.64) | 0.42 (0.34–0.53) | 0.57 (0.49–0.69) | 0.57 (0.49–0.70) | ||
| TIBC | μg/dL | 1 | 229 | 1.01 (0.83–1.29) | 0.87 (0.71–1.11) | 1.34 (1.14–1.68) | 1.25 (1.07–1.54) |
| 2 | 303 | 1.10 (0.91–1.41) | 0.76 (0.62–0.97) | 1.50 (1.28–1.85) | 1.46 (1.20–1.88) | ||
| 3 | 358 | 1.12 (0.92–1.43) | 1.02 (0.84–1.30) | 1.56 (1.29–1.97) | 1.52 (1.29–1.89) | ||
| tCO2 | mmol/L | 1 | 15 | 1.17 (0.96–1.49) | 1.42 (1.16–1.81) | 5.20 (4.23–6.90) | 3.45 (2.86–4.35) |
| 2 | 20 | 1.36 (1.12–1.75) | 1.21 (0.99–1.54) | 5.80 (4.72–7.83) | 3.51 (2.93–4.49) | ||
| 3 | 24 | 1.62 (1.33–2.08) | 1.00 (0.82–1.28) | 5.11 (4.13–6.74) | 2.75 (2.26–3.51) | ||
| Na | mmol/L | 1 | 114 | 0.62 (0.51–0.79) | 0.39 (0.32–0.50) | 0.88 (0.73–1.12) | 0.79 (0.65–1.02) |
| 2 | 140 | 0.35 (0.29–0.44) | 0.38 (0.31–0.49) | 0.49 (0.42–0.60) | 0.56 (0.48–0.69) | ||
| 3 | 158 | 0.37 (0.30–0.47) | 0.30 (0.25–0.39) | 0.49 (0.41–0.61) | 0.59 (0.49–0.75) | ||
| K | mmol/L | 1 | 2.4 | 0.47 (0.38–0.60) | 0.00 (0.00–0.00) | 0.47 (0.41–0.56) | 0.00 (0.00–0.00) |
| 2 | 3.9 | 0.41 (0.33–0.52) | 0.76 (0.62–0.97) | 0.56 (0.48–0.69) | 1.01 (0.86–1.24) | ||
| 3 | 7.5 | 0.44 (0.37–0.57) | 0.42 (0.34–0.53) | 0.70 (0.59–0.89) | 0.88 (0.73–1.11) | ||
| Cl | mmol/L | 1 | 78 | 0.70 (0.58–0.90) | 0.70 (0.58–0.90) | 1.17 (0.98–1.45) | 1.17 (0.98–1.45) |
| 2 | 101 | 0.35 (0.28–0.44) | 0.35 (0.28–0.44) | 1.15 (0.94–1.49) | 1.15 (0.94–1.49) | ||
| 3 | 118 | 0.28 (0.23–0.36) | 0.28 (0.23–0.36) | 1.08 (0.86–1.44) | 1.08 (0.86–1.44) | ||
Abbreviations: ALP, alkaline phosphatase; ALT, alanine aminotransferase; AST, aspartate aminotransferase; BUN, blood urea nitrogen; Ca, calcium; CI, confidence interval; Cl, chloride; CV, coefficient variation; D. bilirubin, direct bilirubin; GGT, gamma (γ)-glutamyl transferase; HDLC, high density lipoprotein cholesterol; Inorganic P, inorganic phosphorus; K, potassium; LD, lactate dehydrogenase; LDLC, low density lipoprotein cholesterol; Mg, magnesium; Na, sodium; T. bilirubin, total bilirubin; T. cholesterol, total cholesterol; tCO2, total carbon dioxide; TIBC, total iron-binding capacity; T. protein, total protein.
Table 2.
| Analyte | Unit | Material | Insert AMR | Validated AMR | Best fit | Non-linearity (%) | Recovery (%) | ||
|---|---|---|---|---|---|---|---|---|---|
| Low | High | Low | High | ||||||
| Ca | mg/dL | Validate® GC1∗ | 1 | 15 | 1 | 15 | Linear | – | 96.3–101.7 |
| Mg | mmol/L | Validate® GC1 | 0.5 | 5 | 0.8 | 5 | 3rd order polynomial | Less than 5% | 97.9–101.3 |
| Inorganic P | mg/dL | Validate® GC1 | 0.3 | 20 | 0.5 | 19 | Linear | – | 97.7–100.1 |
| BUN | mg/dL | Validate® GC1 | 5 | 150 | 10 | 135 | 2nd order polynomial | Less than 5% | 100.0–103.2 |
| Creatinine | mg/dL | Validate® GC1 | 0.15 | 30.0 | 0.25 | 25.60 | 3rd order polynomial | Less than 5% | 100.0–106.5 |
| Glucose | mg/dL | Validate® GC1 | 4 | 700 | 10 | 676 | 2nd order polynomial | Less than 5% | 100.0–103.6 |
| Uric Acid | mg/dL | Validate® GC1 | 0.5 | 20.0 | 0.7 | 21.5 | Linear | – | 96.1–100.0 |
| T. protein | g/dL | Validate® GC1 | 2 | 12 | 2 | 12 | Linear | – | 97.7–100.0 |
| Albumin | g/dL | Validate® GC1 | 1.0 | 6.0 | 1.0 | 6.0 | 2nd order polynomial | Less than 5% | 100.0–102.9 |
| T. Bilirubin | mg/dL | Patient serum | 0.1 | 35.0 | 0.5 | 27.0 | Linear | – | 99.0–100.3 |
| D. Bilirubin | mg/dL | Patient serum | 0.1 | 15.0 | 0.2 | 14.3 | Linear | – | 99.5–100.7 |
| ALP | IU/L | Validate® GC3† | 10 | 1,000 | 12 | 942 | 3rd order polynomial | Less than 5% | 99.6–102.4 |
| AST | IU/L | Validate® GC3 | 8 | 1,000 | 9 | 863 | Linear | – | 97.7–100.1 |
| ALT | IU/L | Validate® GC3 | 7 | 1,100 | 8 | 1,121 | Linear | – | 98.5–103.1 |
| Amylase | U/L | Validate® GC3 | 5 | 1,500 | 5 | 1,375 | Linear | – | 93.9–118.8 |
| Lipase | U/L | Validate® GC3 | 8 | 700 | 18 | 715 | Linear | – | 100.0–105.9 |
| GGT | U/L | Validate® GC3 | 7 | 1,200 | 9 | 1,110 | Linear | – | 97.7–100.0 |
| LD | IU/L | Validate® GC3 | 20 | 700 | 21 | 663 | 2nd order polynomial | Less than 5% | 100.0–108.3 |
| T. cholesterol | mg/dL | Validate® GC1 | 25 | 618 | 28 | 558 | 2nd order polynomial | Less than 5% | 100.0–103.4 |
| Triglyceride | mg/dL | Validate® GC1 | 10 | 550 | 12 | 521 | 2nd order polynomial | Less than 5% | 100.0–105.2 |
| HDLC | mg/dL | Patient serum | 20 | 129 | 5 | 115 | 2nd order polynomial | Less than 5% | 100.0–104.1 |
| LDLC | mg/dL | Patient serum | 5 | 1,000 | 17 | 241 | Linear | – | 98.9–100.4 |
| Iron | μg/dL | Validate® GC2‡ | 2 | 1,000 | 12 | 951 | 3rd order polynomial | Less than 5% | 99.6–102.4 |
| TIBC | μg/dL | Patient serum | 40 | 670 | 94 | 431 | Linear | – | 96.9–104.6 |
| tCO2 | mmol/L | Validate® GC2 | 10 | 40 | 12 | 36 | Linear | – | 100.0–103.7 |
| Na | mmol/L | Patient serum | 50 | 200 | 49 | 167 | Linear | – | 100.0–100.3 |
| K | mmol/L | Patient serum | 1.0 | 10.0 | 1.0 | 9.4 | Linear | – | 99.0–100.5 |
| Cl | mmol/L | Patient serum | 50 | 200 | 44 | 202 | 2nd order polynomial | Less than 5% | 97.8–100.0 |
Abbreviations: ALP, alkaline phosphatase; ALT, alanine aminotransferase; AST, aspartate aminotransferase; BUN, blood urea nitrogen; Ca, calcium; CI, confidence interval; Cl, chloride; CV, coefficient variation; D. bilirubin, direct bilirubin; GGT, gamma (γ)-glutamyl transferase; HDLC, high density lipoprotein cholesterol; Inorganic P, inorganic phosphorus; K, potassium; LD, lactate dehydrogenase; LDLC, low density lipoprotein cholesterol; Mg, magnesium; Na, sodium; T. bilirubin, total bilirubin; T. cholesterol, total cholesterol; tCO2, total carbon dioxide; TIBC, total iron-binding capacity; T. protein, total protein.
Table 3.
Abbreviations: ALP, alkaline phosphatase; ALT, alanine aminotransferase; AST, aspartate aminotransferase; BUN, blood urea nitrogen; Ca, calcium; Cl, chloride; D. bilirubin, direct bilirubin; GGT, gamma (γ)-glutamyl transferase; HDLC, high density lipoprotein cholesterol; Inorganic P, inorganic phosphorus; K, potassium; LD, lactate dehydrogenase; LDLC, low density lipoprotein cholesterol; Mg, magnesium; Na, sodium; T. bilirubin, total bilirubin; T. cholesterol, total cholesterol; tCO2, total carbon dioxide; T. protein, total protein; UIBC, unsaturated iron-binding capacity.


 PDF
PDF ePub
ePub Citation
 Print
Print


 XML Download