Abstract
Purpose
This study aimed to identify relative age effects of South Korea national male football teams that participated in 38 international competitions in age-specific categories from 2000 to 2018; U-16 (n=176), U-17 (n=82), U-19 (n=198), U-20 (n=147), and U-23 (n=166).
Methods
Available information on birth-dates, heights, and body weights of South Korean elite male football players was collected from the official websites. Chi-square test was conducted and odds ratios were calculated with 95% confidence interval in order to examine differences of quarter distribution between expected and observed subgroups.
Results
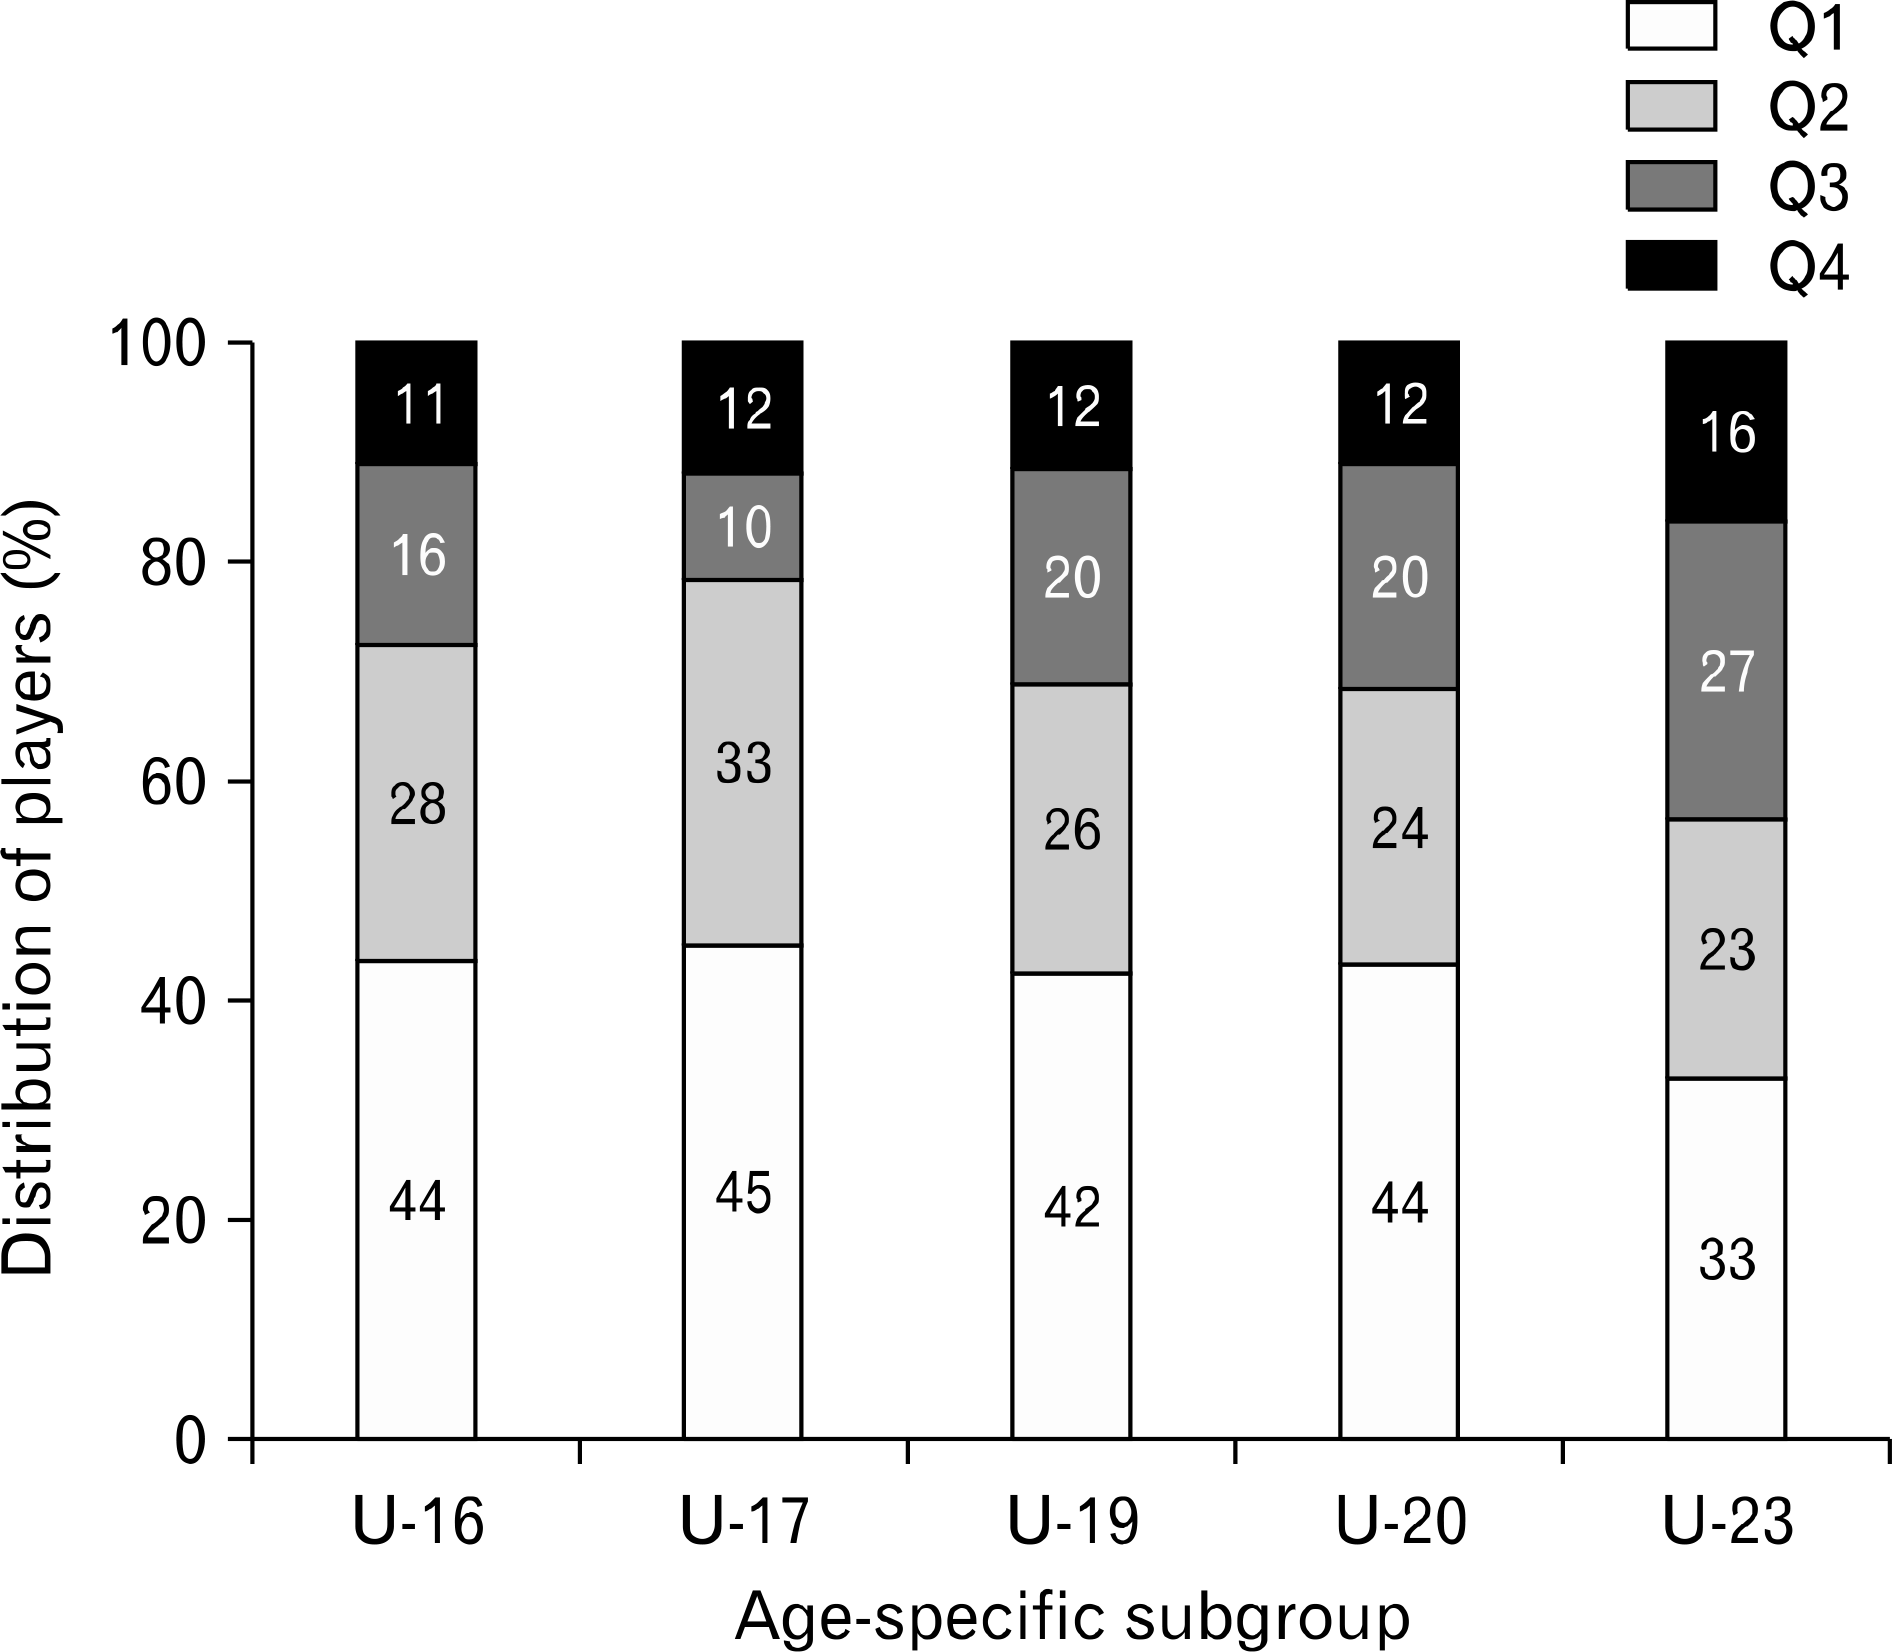
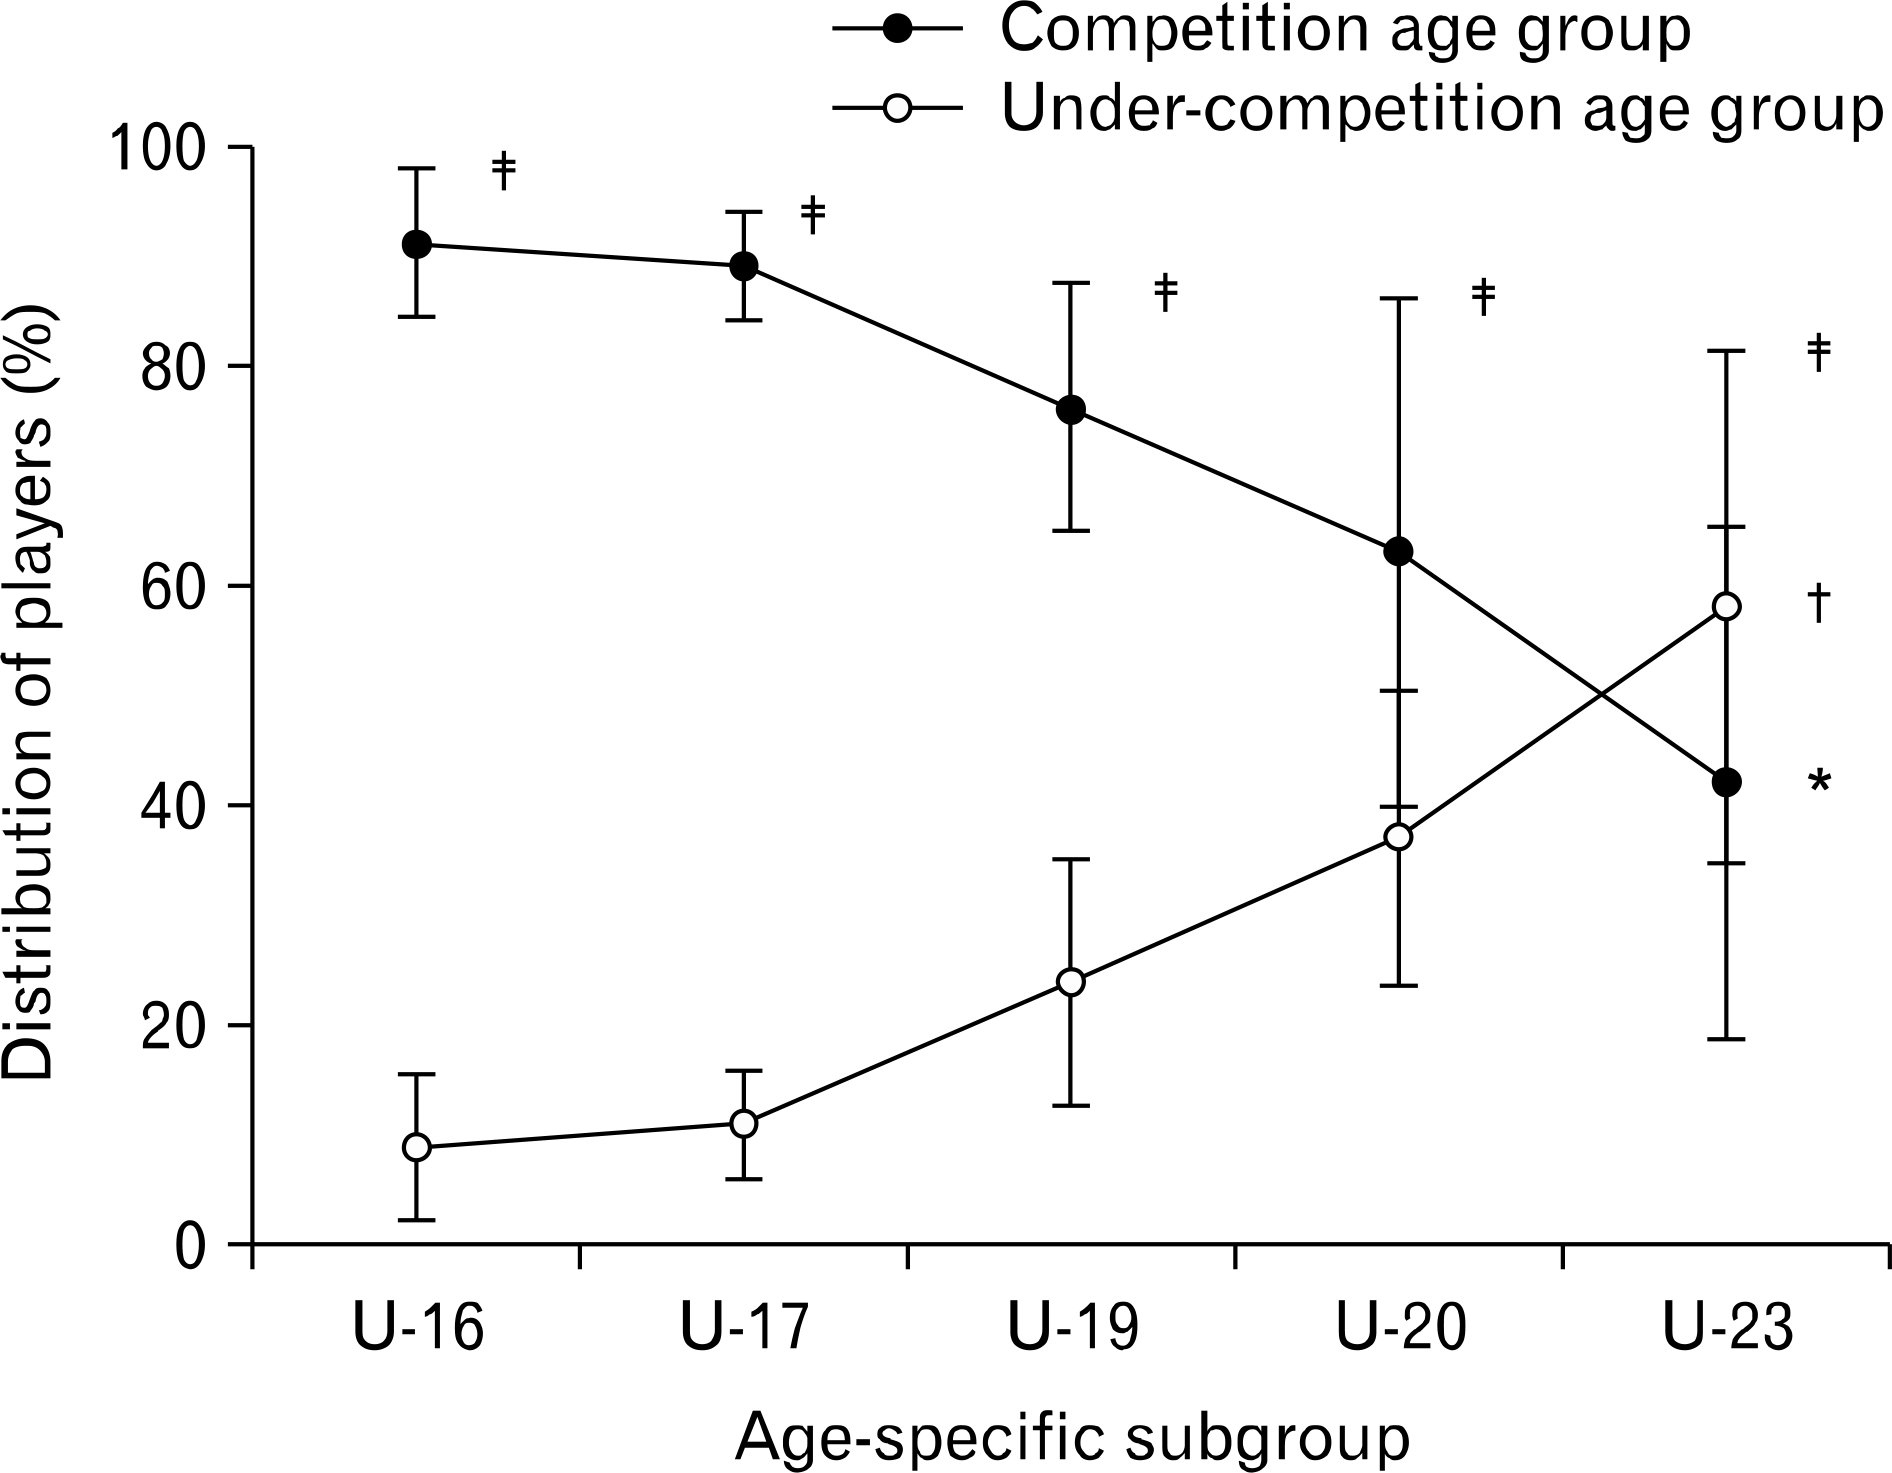
The birth distributions observed in each team were significantly different than those expected in general population of the same age (U-16: χ2=59.364, p<0.05; U-17: χ2=36.829, p<0.05; U-19: χ2=51.697, p<0.05; U-20: χ2=39.531, p< 0.05) except U-23 (χ2=17.759, p=0.087). The magnitude of birth distribution was 3.2 times higher in the first quarter compared to that in the fourth quarter and was decreased in accordance with age. In accordance with age, the distribution of “competition age group” was significantly decreased in each team (U-16, 91%; U-17, 89%; U-19, 76%; U-20, 63%; U-23, 42%; p<0.05) but that of “under-competition age group” was increased (U-16, 9%; U-17, 11%; U-19, 24%; U-20, 37%; U-23, 58%; p< 0.05). There is also significant difference in distribution between both “competition” and “under-competition age group” at the same tournament category (p<0.05).
Conclusion
Conclusively, these findings indicate that Korean players who are in the early stage of development have higher “relative age effects” than those in the late stage of development. This may implicate that it is necessary to develop strategies for relatively late-mature players who have potentials in terms of skills and intelligence of football.
References
1. Da Costa IT, Albuquerque MR, Garganta J. Relative age effect in Brazilian soccer players: a historical analysis. Int J Perform Anal Sport. 2012; 12:563–70.
2. Helsen WF, Van Winckel J, Williams AM. The relative age effect in youth soccer across Europe. J Sports Sci. 2005; 23:629–36.

3. Jimenez IP, Pain MT. Relative age effect in Spanish association football: its extent and implications for wasted potential. J Sports Sci. 2008; 26:995–1003.
4. Kirkendall DT. The relative age effect has no influence on match outcome in youth soccer. J Sport Health Sci. 2014; 3:273–8.

5. Sedano S, Vaeyens R, Redondo JC. The relative age effect in Spanish female soccer players: influence of the competitive level and a playing position. J Hum Kinet. 2015; 46:129–37.

6. Williams JH. Relative age effect in youth soccer: analysis of the FIFA U17 World Cup competition. Scand J Med Sci Sports. 2010; 20:502–8.

7. Augste C, Lames M. The relative age effect and success in German elite U-17 soccer teams. J Sports Sci. 2011; 29:983–7.

8. Gutierrez Diaz Del Campo D, Pastor Vicedo JC, Gonzalez Villora S, Contreras Jordan OR. The relative age effect in youth soccer players from Spain. J Sports Sci Med. 2010; 9:190–8.
9. Mulazimoglu O. The relative age effect (RAE) in youth and professional soccer players in Turkey. Anthropologist. 2014; 18:391–8.

10. Praxedes A, Moreno A, Garcia-Gonzalez L, Pizarro D, Del Villar F. The relative age effect on soccer players in formative stages with different sport expertise levels. J Hum Kinet. 2017; 60:167–73.
11. Williams AM, Reilly T. Talent identification and development in soccer. J Sports Sci. 2000; 18:657–67.

12. Vincent J, Glamser FD. Gender differences in the relative age effect among US Olympic development program youth soccer players. J Sports Sci. 2006; 24:405–13.

13. Bandura A. Social foundations of thought and action: a social cognitive theory. Englewood Cliffs (NJ): Prentice-Hall;1986.
14. Mujika I, Vaeyens R, Matthys SP, Santisteban J, Goiriena J, Philippaerts R. The relative age effect in a professional football club setting. J Sports Sci. 2009; 27:1153–8.
15. Romann M, Fuchslocher J. Influence of the selection level, age and playing position on relative age effects in Swiss Women's soccer. Talent Dev Excell. 2011; 3:239–47.
16. Johnson A, Doherty PJ, Freemont A. Investigation of growth, development, and factors associated with injury in elite schoolboy footballers: prospective study. BMJ. 2009; 338:b490.

17. Malina RM, Bouchard C, Bar-Or O. Growth, maturation, and physical activity. Champaign: Human Kinetics;2004.
18. Williams AM, Ericsson KA. Perceptual-cognitive expertise in sport: some considerations when applying the expert performance approach. Hum Mov Sci. 2005; 24:283–307.

19. Vaeyens R, Philippaerts RM, Malina RM. The relative age effect in soccer: a match-related perspective. J Sports Sci. 2005; 23:747–56.

20. Glamser FD, Vincent J. The relative age effect among elite American youth soccer players. J Sport Behav. 2004; 27:31–8.
21. Costa VT, Simim MA, Noce F, Costa IT, Samulski DM, Moraes LC. Comparison of relative age of elite athletes participating in the 2008 Brazilian soccer championship series A and B. Motricidade. 2009; 5:13–7.

22. Helsen WF, Starkes JL, Van Winckel J. Effect of a change in selection year on success in male soccer players. Am J Hum Biol. 2000; 12:729–35.

23. Salinero JJ, Perez B, Burillo P, Lesma ML. Relative age effect in European professional football: analysis by position. J Hum Sport Exerc. 2013; 8:966–73.

24. Deprez D, Coutts AJ, Fransen J, Deconinck F, Lenoir M, Vaeyens R, et al. Relative age, biological maturation and anaerobic characteristics in elite youth soccer players. Int J Sports Med. 2013; 34:897–903.

25. Gil SM, Badiola A, Bidaurrazaga-Letona I, et al. Relationship between the relative age effect and anthropometry, maturity and performance in young soccer players. J Sports Sci. 2014; 32:479–86.

26. Pyne DB, Gardner AS, Sheehan K, Hopkins WG. Positional differences in fitness and anthropometric characteristics in Australian football. J Sci Med Sport. 2006; 9:143–50.

27. Helsen WF, Starkes JL, Van Winckel J. The influence of relative age on success and dropout in male soccer players. Am J Hum Biol. 1998; 10:791–8.

28. Fragoso I, Massuca LM, Ferreira J. Effect of birth month on physical fitness of soccer players (Under-15) according to biological maturity. Int J Sports Med. 2015; 36:16–21.

Fig. 1.
Quarterly distribution of birth-date by each age-specific subgroup. Q1: January to March, Q2: April to June, Q3: July to September, Q4: October to December.

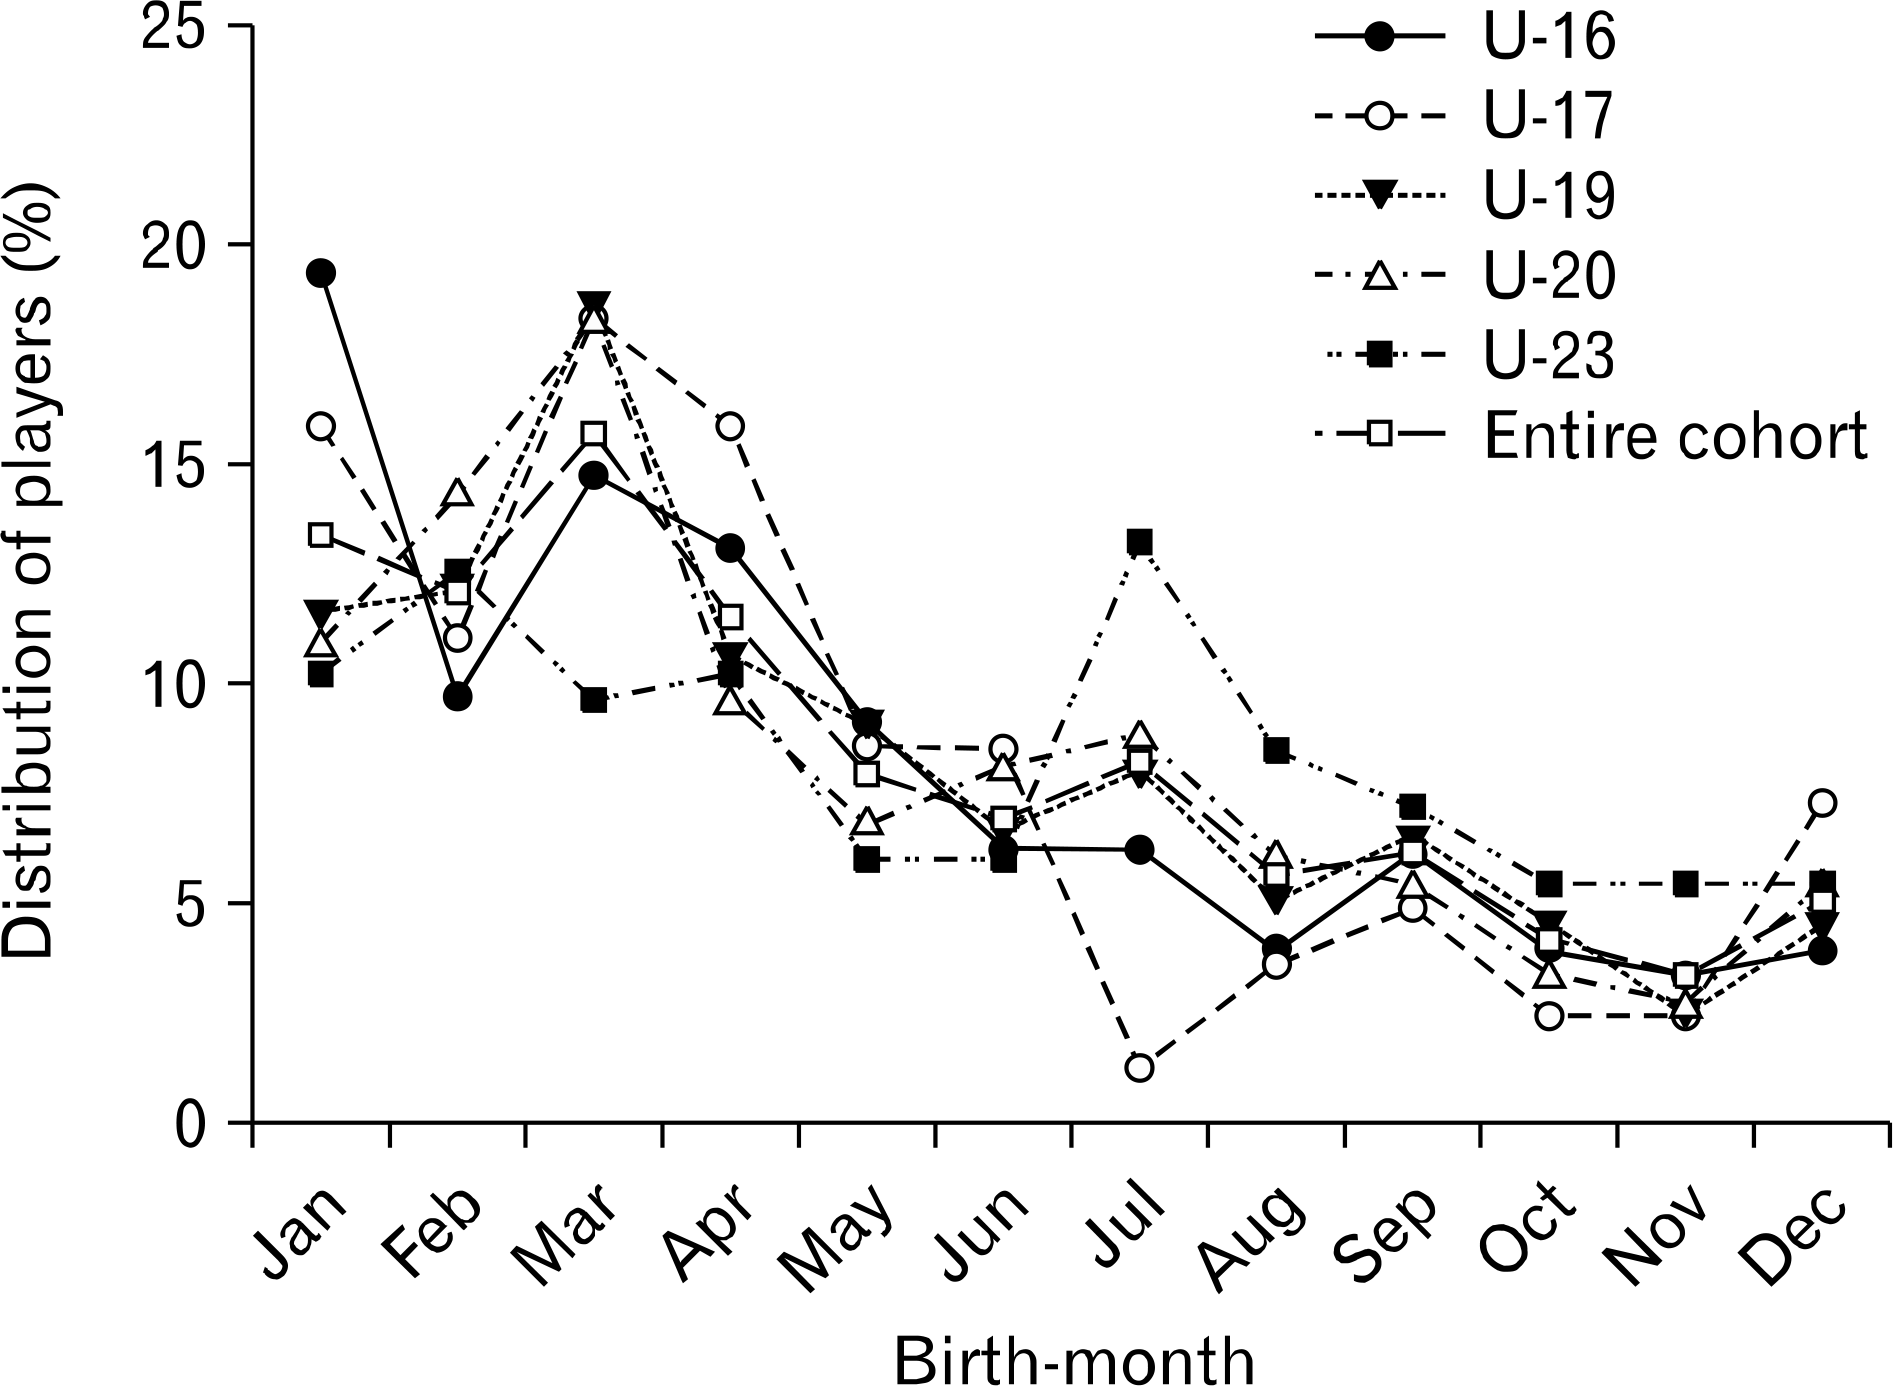
Fig. 2.
Birth-month distribution of players by age-specific subgroups. Distribution of each subgroup was significantly different in accordance with month (p<0.05).

Fig. 3.
Distribution of “competition age group” and “under-competition age group” significantly decreased (∗) and increased (†) in accordance with age, respectively. In each age-specific subgroup, there were significant differences in the distribution between both groups (‡).

Table 1.
Age-specific international competitions included in the study
| Group | U-16 (n=176) | U-17 (n=82) | U-19 (n=198) | U-20 (n=147) | U-23 (n=166)∗ |
|---|---|---|---|---|---|
| Tournament | 8 AFC Championship (2002, 2004, 2006, 2008, 2012, 2014, 2016, 2018) | 4 FIFA WC (2003, 2007, 2009, 2015) | 9 AFC Championship 2002, 2004, 2006, 2008, 2010, 2012, 2014, 2016, 2018) | 7 FIFA WC (2003, 2005, 2007, 2009, 2011, 2013, 2017) | 5 AG (2002, 2006, 2010, 2014, 2018), 5 OG (2000, 2004, 2008, 2012, 2016) |
AFC: Asian Football Confederation, FIFA: Federation Internationale de Football Association, WC: World Cup, AG: Asian Games, OG: Olympic Games.
All data were sourced from www.kfa.or.kr, www.fifa.com, and www.the-afc.com.
Table 2.
Comparison of differences between the observed and expected birth-date distributions across the four quarters
| Group | Number | Median birth month | χ2 | p-value | Regression coefficient | |
|---|---|---|---|---|---|---|
| β | p-value | |||||
| U-16 | 176 | April | 59.364 | 0.000 | −0.879 | 0.000 |
| U-17 | 82 | April | 36.829 | 0.000 | −0.762 | 0.000 |
| U-19 | 198 | April | 51.697 | 0.000 | −0.752 | 0.000 |
| U-20 | 147 | April | 39.531 | 0.000 | −0.751 | 0.000 |
| U-23 | 166 | June | 17.759 | 0.087 | −0.591 | 0.000 |
| Entire cohort | 769 | April | 156.841 | 0.000 | −0.903 | 0.000 |
Table 3.
The magnitude of quarterly distribution of players in each age-specific subgroup
Table 4.
Mean height and body weight of players in accordance with birth-quarter
| Group | Total | Q1 | Q2 | Q3 | Q4 |
|---|---|---|---|---|---|
| U-16 | |||||
| Height (m) | 1.78±0.06 | 1.78±0.05 | 1.78±0.06 | 1.78±0.05 | 1.78±0.06 |
| Body weight (kg) | 68.4±6.1 | 68.6±5.5 | 68.5±7.2 | 67.4±5.5 | 68.8±6.3 |
| U-17 | |||||
| Height (m) | 1.79±0.06 | 1.78±0.06 | 1.79±0.06 | 1.80±0.05 | 1.81±0.06 |
| Body weight (kg) | 68.4±6.1 | 68.3±7.3 | 69.8±7.0 | 70.1±5.1 | 69.7±7.4 |
| U-19 | |||||
| Height (m) | 1.80±0.06∗ | 1.80±0.06 | 1.81±0.06 | 1.80±0.06 | 1.80±0.07 |
| Body weight (kg) | 71.8±6.6∗,† | 71.6±6.8 | 72.7±6.3 | 71.6±5.9 | 71.0±8.1 |
| U-20 | |||||
| Height (m) | 1.81±0.07∗ | 1.81±0.07 | 1.82±0.07 | 1.81±0.06 | 1.81±0.08 |
| Body weight (kg) | 72.7±6.9∗,† | 72.2±6.6 | 74.3±7.3 | 71.8±5.6 | 72.6±9.2 |
| U-23 | |||||
| Height (m) | 1.81±0.06∗ | 1.80±0.05 | 1.82±0.07 | 1.80±0.05 | 1.83±0.06 |
| Body weight (kg) | 73.7±6.3∗,† | 72.9±5.4 | 75.1±7.5 | 72.4±5.9 | 75.4±6.2 |


 PDF
PDF ePub
ePub Citation
 Print
Print


 XML Download