

 PDF
PDF ePub
ePub Citation
 Print
Print


INTRODUCTION
Bladder cancer is the 11th most common cancer diagnosed in the world and the 14th most common malignancy in terms of cancer-specific mortality [1]. Overall, 90% of bladder cancer has a transitional epithelial origin, of which 75% are pTa and pT1 tumors without muscle-invasive disease [2]. Non-muscle-invasive bladder cancers (NMIBCs) have a low risk of progression and a long survival, whereas muscle-invasive bladder cancers (MIBCs) show higher cancer-specific mortality [13]. Because of the higher risk for recurrence and progression in high-grade bladder cancer and the higher mortality rates for MIBC, early prediction is important in clinical practice. Nowadays, a unique tool for the prediction of high-risk diseases is histopathologic examination [4]. Therefore, noninvasive biomarkers are needed for NMIBC and MIBC. Urinary cytology has high specificity but lower sensitivity, especially for high-grade bladder cancer, and its efficacy is reduced in low-grade disease [5]. To date, many tumor markers have been investigated for the diagnosis of NMIBC and MIBC. Nevertheless, none of these markers has been accepted for medical use in routine clinical practice because of limitations such as low sensitivity, moderate correlation with tumor tissue alterations, and inability to diagnose high grade and stage disease [678].
Two recent studies reported that measurement of urinary calprotectin, a member of the calcium-binding protein family, may be useful in the diagnosis of bladder cancer [910]. One of the studies, reported by Ebbing et al. [9], showed that high-grade tumors are associated with significantly higher urinary calprotectin levels than are low-grade tumors (1,635.2 ng/mL vs. 351.9 ng/mL). Yasar et al. [10] reported similar urinary calprotectin levels in low- and high-grade bladder cancers, but showed higher urinary levels of calprotectin in high-stage disease. However, a lack of confirmation and comparison with quantitative tissue measurements was a main limitation of those studies. Therefore, the underlying mechanism of increased urinary calprotectin levels in bladder cancer and in advanced grade and stage disease has not been shown objectively. In this study, we aimed to confirm the results of previous studies by investigating the concentrations of urinary calprotectin in patients with bladder cancer with different grading and staging compared with healthy control subjects. Furthermore, we aimed to investigate tissue concentrations of calprotectin and to compare tissue concentrations with urinary concentrations.
Go to : 
MATERIALS AND METHODS
This observational study protocol was reviewed and approved by the Institutional Review Board of Istanbul Training and Research Hospital (approval number: 460–11.04.2014). A total of 82 participants including patients with primary bladder cancer and control subjects who were scheduled for transurethral resection of prostate (TUR-P) because of benign prostatic enlargement without any documented history of cancer were included in the study between April 2014 and June 2015. Patients with primary bladder cancer were treated with transurethral resection of bladder tumor (TUR-BT). Informed consent was obtained by all subjects when they were enrolled. Classification and grading of bladder cancer was performed according to the tumor-node-metastasis (TNM) staging system and the 2004 World Health Organization (WHO) grading system [1112]. History of a urologic procedure within the past month or having acute renal failure, urinary tract infection, or systemic diseases such as hematologic, rheumatic, or cardiac pathologies or inflammatory bowel disease were the exclusion criteria. Patients with other additional malignancies and patients who had recurrent bladder tumors or a history of intracavitary bacillus Calmette-Guerin or chemotherapy treatment were also excluded. Urine cultures were taken from both groups preoperatively and the results confirmed to be sterile before the procedure. Patient demographics, laboratory results, the findings of histopathologic examinations, and calprotectin levels in tissue and urine were recorded.
A 10-mL midflow sterile urine sample was taken from all participants before surgery. Approximately 1 cm3 tissue samples were taken from the urothelium of bladder cancer during TUR-BT in patients with bladder cancer. Tissue samples were taken from healthy trigone of bladder during TUR-P in control subjects. The level of urinary calprotectin was measured by the enzyme-linked immunosorbent assay (ELISA) method (Human Calprotectin ELISA kit; MyBiosource, San Diego, CA, USA) after centrifuging the urine samples at 3,000 rpm for 20 minutes. Tissue samples from patients and control subjects were homogenized by adding 1 mL of phosphate-buffered saline before the measurement. The homogenate was centrifuged at 5,000 rpm for 15 minutes, and measurement of the tissue calprotectin level was performed by the ELISA (Human Calprotectin ELISA kit) method. In addition, total tissue protein levels were measured in an autoanalyzer using the Urine/CSF Protein kit (Beckman Coulter AU 2700, Atlanta, GA, USA). Tissue calprotectin levels were determined in proportion to total tissue protein levels.
Statistical analysis was performed with the SPSS statistics software package (version 15.0; SPSS Inc., Chicago, IL, USA). Data distributions were evaluated with the Kolmogorov–Smirnov test. None of the numerical variables exhibited a normal distribution. Descriptive statistical methods (median and minimum/maximum levels) were used to evaluate the data. Mann–Whitney U test and Kruskal–Wallis test were used to compare numerical variables between two and more than two independent groups, respectively. Differences in categorical variables between the groups were analyzed by Fisher's exact test. The relationships between numerical variables were analyzed by Spearman's correlation test. Receiver operating characteristic (ROC) curves were generated to establish the diagnostic value of urinary calprotectin in the diagnosis of primary bladder cancer. Additional ROC curves were also generated to determine the diagnostic value of urinary calprotectin in the diagnosis of high grade and stage bladder cancers. Then, estimation point (potential cutoff value) and plotting sensitivity and specificity were determined. Differences were considered significant at p<0.05 and 95% confidence intervals are presented.
Go to :
RESULTS
Of 82 participants, 52 were patients with bladder cancer and 30 were control subjects. The two groups were comparable in terms of age, smoking status, and comorbidities. The demographics of the participants are shown in Table 1. Only sex differed significantly between the two groups, because all the control patients were male patients who underwent TUR-P. Serum prostate-specific antigen (female patients excluded) and creatinine levels were also similar between the groups (2.43 ng/mL vs. 1.82 ng/mL, p=0.58; 0.88 ng/mL vs. 1.0 mg/dL, p=0.82; respectively).
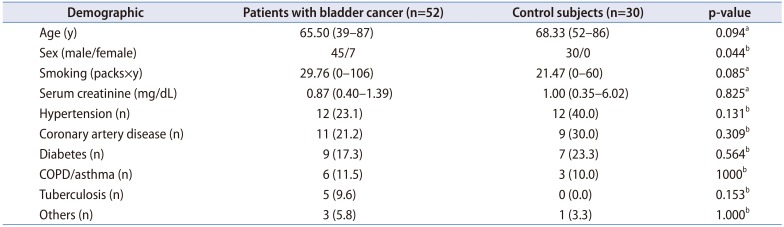
Table 1
Demographics of the study cohort
![]()
In the bladder cancer group, 35 patients (67.3%) had papillary tumors, 8 patients (15.4%) had solid tumors, and 9 patients (17.3%) had papillary and solid (mixed) tumors. Tumor size was less than 3 cm in 26 patients (50.0%) and greater than 3 cm in the remaining patients. Histopathologic evaluation revealed that 35 (67.3%), 12 (23.1%), and 5 (9.6%) of the patients had pTa, pT1, and pT2 tumors, respectively. The tumor was low-grade in 31 patients (59.6%) and high-grade in 21 patients (40.4%).
The mean urinary calprotectin level was significantly higher in the bladder cancer group. Similarly, a significantly higher tissue calprotectin level confirming the urinary results was also found in the bladder cancer group (Table 2). To investigate sex differences in urinary and tissue calprotectin levels, patients with bladder cancer were subgrouped as male and female. Similar urinary and tissue calprotectin levels were found in male and female patients (422.5 ng/mL vs. 496.8 ng/mL, p=0.93; 26.1 ng/mL vs. 16.8ng/mL, p=0.58; respectively). Moreover, comparison of the urinary and tissue calprotectin levels was also performed in male patients and control subjects only, and significantly higher urinary and tissue levels were detected in the bladder cancer group (Table 3). Urinary calprotectin levels were significantly higher in solid and mixed tumors than in papillary tumors (Table 4). The urinary calprotectin level was also significantly higher in tumors larger than 3 cm than in those smaller than 3 cm (543.3 ng/mL vs. 317.7 ng/mL, p=0.011). Moreover, we determined that the urinary calprotectin level was significantly higher with higher tumor grades (Table 5) and stages (Table 6). There were no significant differences in tumor tissue calprotectin levels according to tumor appearance, size, stage, or grade.


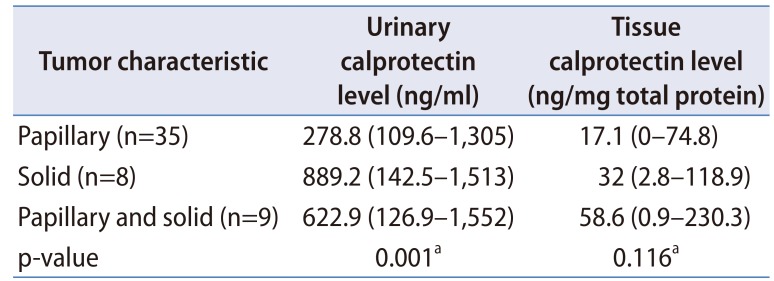
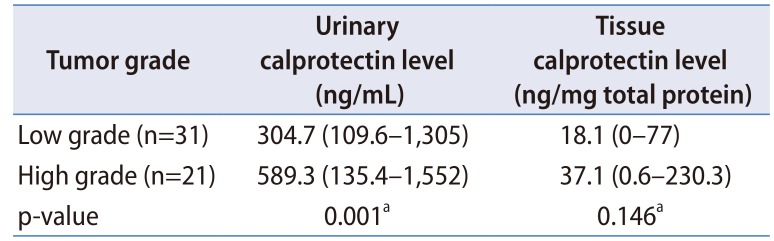
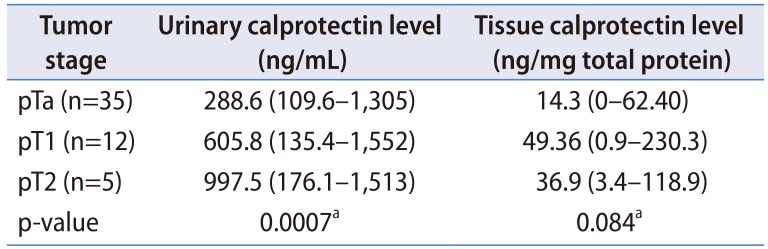
Table 2
Comparison of urinary and tissue calprotectin levels of patient and control groups
![]()
Table 3
Comparison of urinary and tissue calprotectin levels of patient and control groups (female patients excluded)
![]()
Table 4
Urinary and tissue calprotectin levels of papillary, solid, and mixed tumors
![]()
Table 5
Comparison of tumor grade and urinary and tissue calprotectin levels
![]()
Table 6
Comparison of tumor stage with urinary and tissue calprotectin levels
![]()
ROC analyses showed that measurement of the urinary calprotectin had excellent diagnostic value in the diagnosis of primary bladder cancer with a 0.976 area under the curve (AUC). However, the diagnostic value of tissue calprotectin was not superior to urinary calprotectin (Fig. 1). At a cutoff value of 100.9 ng/mL determined by Youden's index, urinary calprotectin had 100% sensitivity and 96.7% specificity. The AUC levels were determined as 0.92 and 0.85 in the diagnosis of high grade and stage bladder cancers, respectively (Fig. 2). By using a cutoff value of 207.02 ng/mL, urinary calprotectin can differentiate between high-grade and low-grade bladder cancers with a sensitivity of 70% and a specificity of 74.2%. Moreover, by using a cutoff value of 762.93 ng/mL, urinary calprotectin can differentiate Ta and T1 tumors (non-muscle-invasive tumors) from T2 tumors (muscle-invasive tumors) with a sensitivity of 80% and 84.8%, respectively.
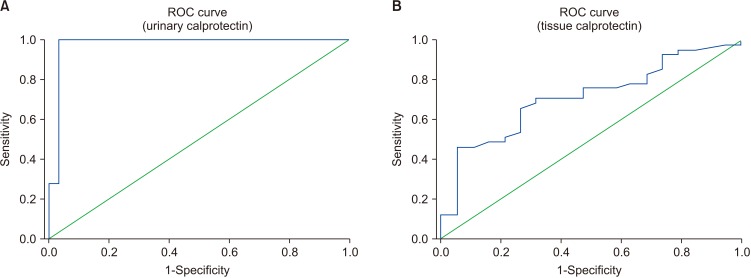 | Fig. 1Receiver operating characteristic (ROC) curve analysis of urinary and tissue calprotectin levels in the diagnosis of primary bladder cancer (area under the curve [AUC]=0.976, 95% confidence interval [CI], 0.929–1.023, p<0.0001; AUC=0.713, 95% CI, 0.579–0.847; respectively, for urinary and tissue calprotectin levels).
|
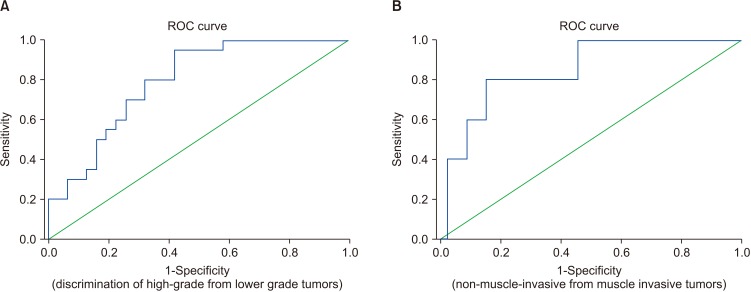 | Fig. 2Receiver operating characteristic (ROC) curve analyses of urinary calprotectin level in the discrimination of high-grade from lower grade tumors and non-muscle-invasive from muscle-invasive tumors (area under the curve [AUC]=0.92, 95% confidence interval [CI], 0.671–0.913, p<0.0001; and AUC=0.85, 95% CI, 0.69–1.00, p=0.01; respectively).
|
Go to :
DISCUSSION
Calprotectin is a zinc- and calcium-binding protein in the S-100 protein family that is secreted from stimulated monocytes, macrophages, and mainly neutrophils. It appears to have growth suppression and cell-death-stimulating effects in fibroblasts and various tumor cells. These properties indicate that it may play a regulatory role by affecting the survival times of cells participating in the inflammatory process [1314]. Previous studies showed that calprotectin is significantly elevated in various chronic inflammatory diseases, acute renal failure, and many cancers [121516]. In 2010, Kim et al. [17] and Minami et al. [18] independently investigated the association of bladder cancer with the S100A8 gene, which is one of the genes that contribute to the production of calprotectin protein. Kim et al. [17] revealed that the S100A8 gene may be an important mediator in determining disease progression in patients with high-risk bladder cancer. Similarly, Minami et al. [18] revealed the association of the S100A8 gene with higher tumor stage and grade. Poor prognosis with overexpression of the S100A8 gene was also reported by Minami et al. [18]. Afterwards, Ebbing et al. [9] assessed urinary calprotectin levels in 181 study subjects, including patients with bladder, renal cell, and prostate cancers and healthy control subjects. The authors also assessed tissue calprotectin by determining S100A8/A9 heterocomplex expression with semi-quantitative immunohistochemistry in 12 tumor tissues (from 6 patients with bladder cancer, 3 patients with renal cell cancer, and 3 patients with prostate cancer) and in mouse spleen as a positive control. They found that the median urinary calprotectin level was significantly higher in patients with bladder cancer (522.3 ng/mL vs. 51.0 ng/mL), in patients with renal cell cancer (522.3 ng/mL vs. 90.4 ng/mL), and in patients with prostate cancer (522.3 ng/mL vs. 71.8 ng/mL) than in healthy control subjects. The immunohistochemical staining with polyclonal antibody against the S100A8/A9 heterocomplex was much more densely filled with calprotectin-positive myeloid cells in the bladder cancer than in the other tumors. Although Ebbing et al. [9] tried to confirm the urinary results with tissue investigation by immunohistochemistry, they did not achieve an optimal confirmation owing to the semi-quantitative nature of the investigation and small tissue sample size. Moreover, the authors did not compare tissue calprotectin levels according to bladder cancer grade and stage. The retrospective nature of the study was another parameter that might have hampered optimal confirmation. In a recent study published by Yasar et al. [10] in 2017, the authors investigated the levels of urinary calprotectin in 82 patients with bladder cancer and 52 healthy control subjects. They reported that urinary calprotectin levels were significantly elevated in patients with primary bladder cancer compared with control subjects and in muscle-invasive tumors compared with cancer of lower stages. In our opinion, the major strength of that study was the prospective nature of the investigation and the adequate sample size. However, the study could have been of great value if the authors had confirmed the results with quantitative tissue investigations. In the present study, we investigated the urinary calprotectin levels of patients with bladder cancer and control subjects with additional quantitative tissue analyses to confirm the urinary results. In our opinion, local inflammatory response secondary to the bladder cancer may contribute to urinary calprotectin levels. Ebbing et al. [9] showed prominent immunostaining for tissue calprotectin protein in a subset of tumor cells and in infiltrating myeloid cells in bladder cancer tissue samples. In a study conducted by Luley et al. [19] in 2011, calprotectin levels measured in tumor tissue of colorectal carcinoma were found to be significantly higher than calprotectin levels in normal mucosal tissue of patients with colorectal cancer and healthy control subjects. Nevertheless, serum calprotectin levels were similar in all participant groups and did not match the tissue levels. Thus, the authors hypothesized that the previously reported increased fecal calprotectin levels in patients with colorectal cancer were associated with local calprotectin production of tumor cells and inflammatory cells within the neoplastic colonic segment. Some other previous reports supported this opinion and described calprotectin as a marker of local inflammatory activity that is not affected by systemic inflammation [2021].
In the present study, we found significantly higher urinary calprotectin levels in patients with bladder cancer than in the control subjects, as in the previous relevant studies published by Ebbing et al. [9] and Yasar et al. [10]. However, our values for sensitivity, specificity, and ROC were much higher than in the previous studies. Potential sources of difference may be environmental factors and demographic parameters or the comorbidity of the different study populations. For instance, Poullis et al. [22] revealed that fecal calprotectin levels are affected by environmental exposures such as low fiber intake, lack of physical exercise, and increased age. Ebbing et al. [9] had an older study population for their bladder cancer group compared with our population (72 years vs. 65.5 years). Another study by Ortega et al. [23] showed that circulating and urinary concentrations of calprotectin are linked to insulin resistance and diabetes. In our study population, the incidence of diabetes mellitus was 17% in patients with bladder cancer; however, it was approximately 20% in the bladder cancer population of the Ebbing et al. [9] study. Other differences in the comorbidity status of the study cohorts could also be reasons for the differences in results.
In the present study, we additionally confirmed our results with a quantitative tissue investigation by the ELISA method for the first time in the urologic literature. Although tissue and urinary calprotectin levels were higher in patients with bladder cancer and correlated with each other, only the urinary calprotectin level was associated with high grade and stage bladder cancer. As also suggested by Luley et al. [19], we thought that the source of urinary calprotectin in our cohort was tumor cells and infiltrating inflammatory cells adjacent to the bladder cancer. Nevertheless, the similar tissue calprotectin levels of our bladder cancer subgroups do not match this hypothesis. In our opinion, while similar tissue levels exist, increased urinary calprotectin levels with high grade and stage disease may be based on increased local immune cell entry to the urine from the foci of high grade and stage bladder cancer. Indeed, Wong et al. [24] investigated whether urine-derived lymphocytes are a measure of the bladder cancer microenvironment and reported that the extent of tumor invasion, necrosis, and micro-vessel density, resulting in leakage and exfoliation of infiltrating lymphocytes into the urine, may regulate the release of tumor-infiltrating lymphocytes into the urine. As a result, we conclude that increased entry of inflammatory cells into the urine as a result of tumor aggressivity may contribute to or be responsible for increased urinary calprotectin production in advanced bladder cancer. Nevertheless, in the present study we did not perform further investigation of the inflammatory microenvironment of the bladder tumor or the role of urinary leukocytes. Most recently, Bausch et al. [25] reported that urinary calprotectin cannot be regarded as a specific tumor marker for bladder cancer, but rather as a surrogate parameter for tumor inflammation. Therefore, the authors claimed that urinary calprotectin may lose its specificity as a tumor marker as a result of sterile leukocyturia, which can be associated with bladder cancer [25].
Our study had some limitations. The most important major limitation of the study was the lack of investigation of the origin of the calprotectin expression in tissue. It seems that immunohistochemical tissue investigations would contribute to the results. The other main limitation was the lack of knowledge about the inflammatory microenvironment of the bladder tumor and the role of urinary leukocytes. Getting an idea about the bladder tumor inflammatory microenvironment and knowledge about the status of urinary leukocyte expression levels might have enriched our results and may have provided us more clear final conclusions.
The third important limitation is that the tissue was collected using TUR. The cauterization might have affected our results. Cold cup biopsy should have been used to collect tissue for analysis. The lack of evaluation of urine cytology and comparison of it with calprotectin levels and the male sex of all the control subjects were other limitations. However, we investigated the sex differences of urinary calprotectin levels in patients with bladder cancer and determined no significance. The lack of evaluation of urinary inflammatory parameters and investigation of predictive value of urinary calprotectin during the follow-up of bladder cancer may be considered as other limitations, all of which would be worthy of future study.
Go to :
CONCLUSIONS
Calprotectin levels in urine and tissue were significantly higher in patients with bladder cancer than in control subjects and were correlated with each other. Measurement of urinary calprotectin has a considerable diagnostic role in the diagnosis of primary bladder cancer. It can be useful in determining high grade and stage disease as well. Moreover, it may contribute to strategies for the follow-up of patients with bladder cancer who are at risk for disease recurrence or progression. However, more investigations are needed.
Go to :
 XML Download