

 PDF
PDF ePub
ePub Citation
 Print
Print


INTRODUCTION
Prosthodontic treatment requires the insertion of provisional or interim restorations for prolonged time periods in order to diagnose and clinically manage complicated prosthetic cases. Interim prostheses can restore lost function, esthetics, and phonetics, stabilize occlusion, protect the teeth from thermal stresses and mechanical fracture, maintain periodontal tissues health, re-establish emergence profile, and also serve as a diagnostic reference restoration for the definitive prosthesis. To fulfill these requirements, interim restorations must be carefully designed and constructed and must attain high strength and acceptable esthetic characteristics such as shape and color.
Interim restorations are usually constructed by acrylic or composite resins. Polymethylmethacrylate resins (PMMA), polyethylmethacrylate resin (PEMA), polyvinylethyl methacrylate resin (PVEMA), autopolymerized and dual polymerized bis-acrylic resin composites, and visible light cured (VLC) urethane dimethacrylate resins have been successfully applied in the fabrication of interim restorations.1 Although PMMA is the most frequently used material for interim fixed prostheses2 due to its low-cost, ease of smoothing and polishing,3 increased strength1 and color stability, it is a glassy and fragile material that demonstrates low fracture toughness.4 Consequently, fractures can occur easily and various cracks can gradually propagate until complete failure of the restorations. For this reason, various attempts have been made in order to enhance the fracture toughness of PMMA restorations through metal wires, fibers (glass, aramid and carbon graphite), various oxides (aluminum, zirconium, titanium, magnesium) and nanodiamonds, with either encouraging or contradictory results.56789101112 From these studies, it has been reported that metal wires incorporated into polymers significantly increase the transverse strength,13 but fibers have been demonstrated to be equally effective in improving the overall strength,14 while esthetics and availability of space may restrict the application of metal wires. Although the use of fibers increases the fracture toughness and flexural strength of PMMA, this reinforcing effect largely depends on their surface treatment as well as their position, quantity, and direction within the polymer matrix.111516 Furthermore, despite their significant increase in the flexural strength of polymers,7 carbon fibers attain a black color that limits their use. On the other hand, the addition of metal oxides microparticles requires uniform dispersion and impregnation within the polymer matrix. Many studies have shown that the addition of filler particles without their modification with a silane coupling agent results in nonuniform stress distribution from the matrix to the fillers and areas of stress concentration may impair the mechanical properties of the composites.17 Reinforcing PMMA with nanofillers can be more efficient in strengthening PMMA composites compared to microparticles, due to the unique properties of nanomaterials, such as large surface area, yield strength, and rigidity.18 Although a mild or significant reinforcing effect can be exerted on the fracture toughness of interim prostheses, various reinforcing agents such as carbon graphite, nanodiamonds, or opaque ceramics such as zirconia and alumina may significantly affect the color of interim prostheses. To the best of the authors' knowledge, this issue has not been investigated yet.
Color variations are usually investigated through the change in color parameters L* (lightness-darkness), a* (red-green), and b* (yellow-blue) of the CIELAB system, where mean value ΔEab corresponds to color difference and gains an arithmetic value. A great controversy exists regarding the exact ΔEab value that is clinically acceptable and not perceivable to either patients or dentists. It has been reported that some individuals perceive color differences as low as 0.5, whereas others do not see differences of ΔEab equal to 4.19 According to Douglas et al,20 ΔEab < 2 means color matching, while a threshold value of ΔEab > 3.3 is considered to be a clinically distinguishable color difference in the intraoral environment.21 Recently, the CIEDE2000 color difference formula22 proved better fit compared to the traditional CIELAB formula for the evaluation of color differences,2324 providing even lower values of acceptable color differences.25 As reported by Paravina et al.,25 a value of ΔE00 equal to 1.8 corresponds to the acceptability threshold of color differences for dentists.
Recently, Topouzi et al.17 used SiO2 nanoparticles to reinforce a PMMA acrylic resin and reported a significant increase of fracture toughness, especially at low concentrations and especially at 0.25 wt%. However silica is a white, opaque powder that may adversely affect the color of the PMMA resin. Consequently, the aim of the present study was to evaluate the color changes of an autopolymerizing PMMA resin used for the fabrication of interim fixed restorations, reinforced with 0.25 wt% SiO2 nanoparticles. The null hypothesis were 1) there would be no statistically significant difference of the ΔEab value compared to the intraorally clinically acceptable values of 3.3 and 2.7 for all tested shades, 2) there would be no statistically significant difference of the ΔE00 value compared to the intraorally clinically acceptable values of 1.8 for all tested shades, and 3) there would be no statistically significant difference after the NSiO2 reinforcement for Δa*, ΔL*, Δb*, and ΔEab and ΔE00 values among all shade groups.
MATERIALS AND METHODS
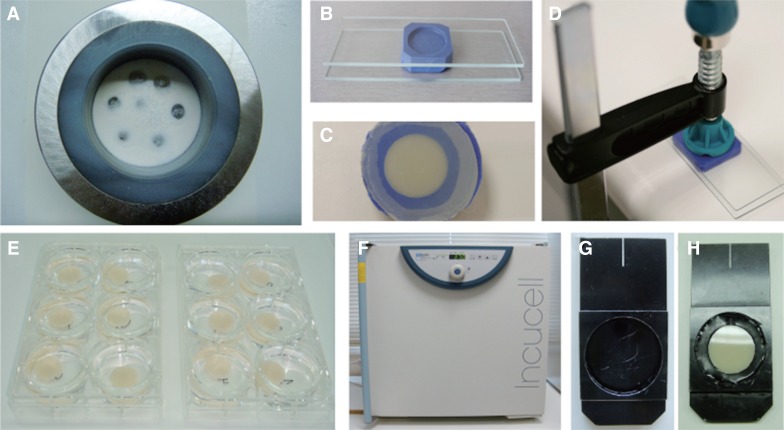
In this study, an autopolymerizing PMMA resin in A3, B3, C3, D3 shades was used (Jet Lang Dental Mfg. Co., Inc., Chicago, IL, USA) reinforced with 0.25 wt% (NSiO2) (Aerosil 200, Degussa AG, Hanau, Germany).1726 Disk-shaped specimens with 7 mm diameter and 1.5 mm height were constructed with the following procedure: SiO2 nanoparticles were blended with the powder of the PMMA resin through high energy ball milling (6 hours with 25 minutes intervals every 3 hours).2728 PMMA-nanosilica powder was then mixed with monomer liquid at a powder to liquid ratio of 1.25 g/0.75 mL. This ratio provided adequate working time and satisfactory composition so that PMMA could easily being injected to a silicon matrix that was afterwards covered with 2 glass slabs (Fig. 1). Control specimens were similarly constructed with a powder to liquid ratio of 1.7 g/mL according to literature2930 as standard mixing ratios were not provided by the manufacturer. The thickness was chosen based on the typical tooth reduction in the preparation for a metal-ceramic or all-ceramic restoration required for proper aesthetics and mechanical strength in the labial area of anterior teeth, which has been suggested to vary between 1 – 2 mm, depending on the material used and the type and color of the underlying abutment.3132 A total of 8 study groups were constructed consisting of 6 specimens each: PMMA not reinforced (control groups C-A3, C-B3, C-C3, C-D3) and PMMA reinforced with 0.25 wt% SiO2 nanoparticles (reinforced groups NS-A3, NS-B3, NS-C3, NS-D3). The number of specimens in each group was selected after power analyses, which is described in details in the “statistical analysis” section.
The specimens were left to polymerize for 10 minutes in an incubator (Incucell/Medcenter Einrichtungen GmbH, München, Germany) at 37℃ to complete the polymerization.33 Optical inspection was performed in order to discard specimens with voids and bubbles. The specimens were stored in distilled water at 37℃ for 24 hours in the incubator until color measurements.15
Color measurements were carried out with a double beam ultraviolet-visible reflection spectrophotometer (double-beam UV-VIS Recording Spectrophotometer) (UV-2401PC, Shimadzu Co., Kyoto, Japan) in the visible spectrum (380 – 780 nm). Before each measurement, the spectrophotometer was calibrated with a white barium sulfate background. The R reflection spectra of the samples were received with the UVPROBE software version 2.21, Shimadzu Co., Kyoto, Japan). The mathematical transformation of L*, a*, b* were performed with Color Analysis UV-2410PC. All mathematical conversions were made with standard lighting option CIE C (Standard illuminant C).34 Total color differences were calculated in Microsoft Office Excel according to the following equations:
where ΔL* = L1 – L0, Δa* = a1 – a0 and Δb* = b1 – b0. The terms L0, a0, and b0 were the Color data of the Control specimens and L1, a1, and b1 the data of the silica reinforced specimens

where ΔL′, ΔC′, and ΔH′ are the differences in lightness, chroma, and hue for a pair of samples in CIEDE2000, and RT is a function (rotation function) that accounts for the interaction between chroma and hue differences in the blue region. The weighting functions, SL, SC, SH, adjust the total color difference for variation in the location of the color difference pair of samples in L′, a′, b′ coordinates, while the parametric factors KL, KC, KH, are correction terms for experimental conditions, that were set at 2 : 1 : 135 rather than 1 : 1 : 1,36 as it is recommended for dental research.
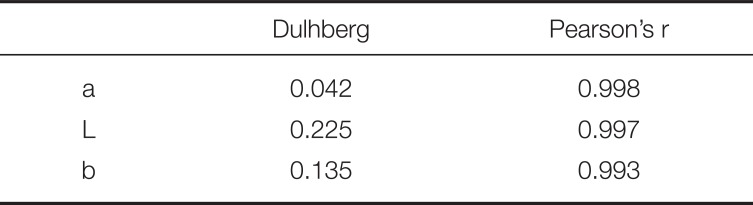
For the statistical analysis, a pilot study was conducted first with 6 specimens in each group. Mean and standard deviations were calculated for L*, a*, b* in each group and color differences between control and reinforced specimens with SiO2 nanoparticles of the same shade were calculated according to the equation: ΔE = [(ΔL*)2 + (Δa*)2 + (Δb*)2]½. Statistical power of the study was calculated to 86% (G*Power software) so no additional specimens were constructed. In order to assess the researcher and device reliability, 3 specimens from each group were measured twice with a 2 h difference. Dulhberg statistics were performed according to the equation:
and measurements reproducibility was evaluated with Pearson coefficient.36 Statistically significant differences between the measured ΔEab and ΔE00 and their threshold values of 3.3 and 2.7 for ΔEab and 1.8 for ΔE00 were evaluated with one sample t-test. In order to assess statistically significant differences concerning Δa*, ΔL*, Δb*, ΔEab and ΔE00 among the different shades, One-way ANOVA and Bonferroni multiple comparisons tests were used. Furthermore, as an indicator of the effect of the material (effect size index) on the values of Δa*, ΔL*, Δb*, ΔEab and ΔE00, the index η2 (eta square) was used showing the percentage of the variability of the measurements due to the existence of 4 materials.37 Normal distribution was evaluated with the Shapiro-Wilk test (N < 50) while the homogeneity of distributions was evaluated with the Levene's Test of Homogeneity of Variances. Statistical analysis was performed with the IBM SPSS statistics 19 software and the level of statistical significance was set to P < .05.
RESULTS
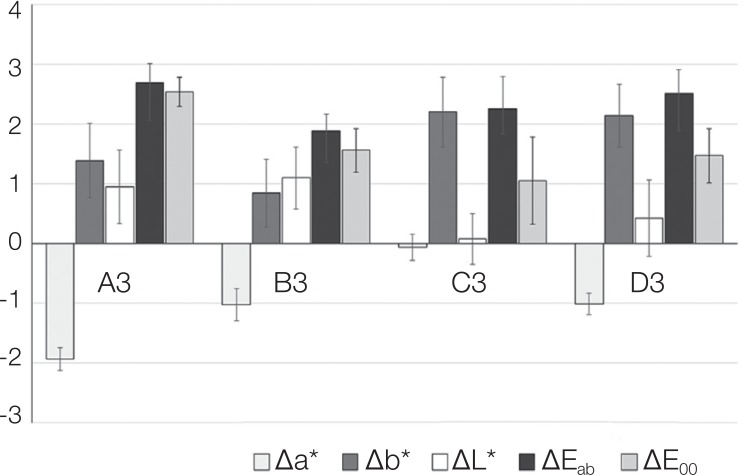
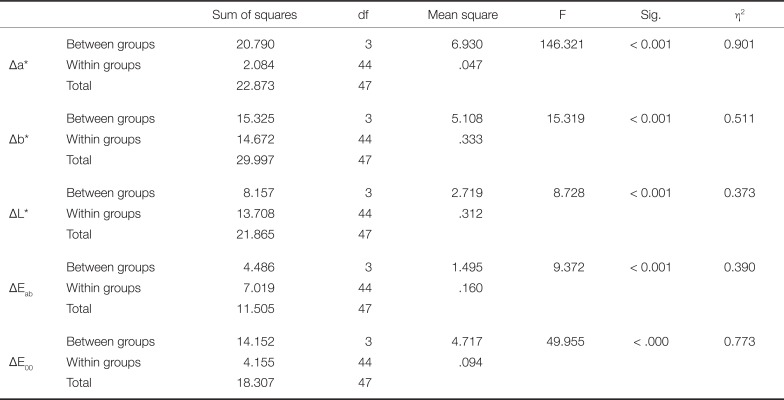
Mean values and standard deviations for the parameters Δa*, Δb*, ΔL*, ΔEab and ΔE00 are presented in Fig. 2, while Duhlberg statistics and Pearson's coefficient are presented in Table 1. As shown in Table 2, statistically significant differences were recorded among the shaded groups for all the parameters evaluated (Δa*: F (3,44) = 146.321, P < .001, Δb*: F (3,44) = 15.319, P < .001, ΔL*: F (3,44) = 8.728, P < .001, ΔEab: F (3,44) = 9.372, P < .001, and ΔE00: F (3,44) = 49.955, P < .001). Eta square is high for all parameters (Δa* 90.1%, Δb* 51.1%, ΔL* 37.3%, ΔEab 39% and ΔE00 77.3%), which confirms the statistically significant differences. The recorded differences, as shown by Bonferroni multiple comparison tests, are attributed to the following differences: Δa*: there were statistically significant differences between the shade A3 and the shades B3, C3, D3 (P < .001) and between the shade C3 and the shades A3, B3, D3 (P < .001); Δb*: there were statistically significant differences between the shade A3 and the shades C3, D3 (P = .007 and P = .016, respectively) and between the shade B3 and the shades C3, D3 (P < .001); ΔL*: there were statistically significant differences between the shade A3 and C3 (P = .001) and between the shade B3 and the shades C3, D3 (P < .001 and P = .028, respectively); ΔEab: there were statistically significant differences between the shade A3 and B3 (P < .001) and between the shades B3 and D3 (P = .002); ΔE00: there were statistically significant mean differences between the shade A3 and all other shades, B3 (A3 > B3, P < .001), C3 (A3 > C3, P < .001) and D3 (A3 > D3, P < .001). Also, significantly different mean value was found between B3 and C3 (B3 > C3, P = .003) as well as between D3 and C3, (D3 > C3, P = .011), while no significant mean difference was found between B3 and D3 (P > .05).
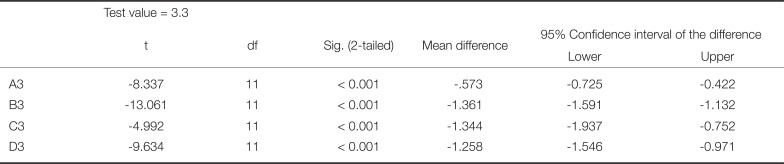
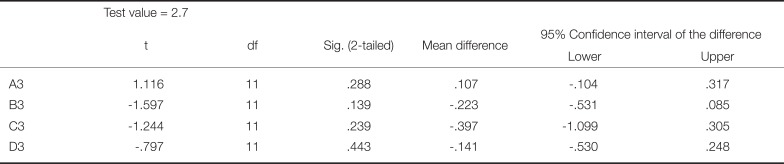
Significantly lower values were detected for all groups concerning ΔEab compared to the intraorally clinically acceptable value of 3.3 (Table 3), while there were no statistically significant differences of ΔEab values compared to the intraorally clinically acceptable value of 2.7 (Table 4). The values of ΔE00 were lower compared to ΔEab in all shades.
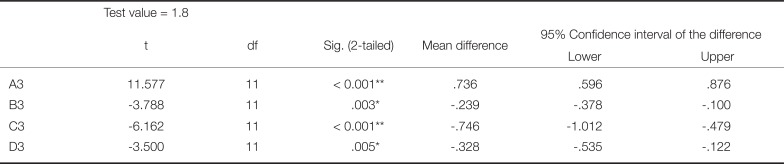
Significantly lower mean values were detected for groups B3, C3 and D3, concerning ΔE00 compared to the intraorally clinically acceptable value of 1.8, while A3 showed significantly greater mean value (Table 5).
DISCUSSION
Three main null hypotheses were tested in this study: 1) there would be no statistical significant difference of the ΔEab value compared to the intraorally clinically acceptable values of 3.3 and 2.7 for all tested shades, 2) there would be no statistically significant difference of the ΔE00 value compared to the intraorally clinically acceptable values of 1.8 for all tested shades, and 3) there would be no statistical significant difference after the NSiO2 reinforcement for Δa*, ΔL*, Δb*, and ΔEab and ΔE00 values among all shade groups. Concerning the first hypothesis, as the reinforcement of SiO2 nanoparticles lead to statistically significant differences of the ΔEab values compared to the value of 3.3 and 2.7, which expresses the color perception by the human eye, the results of this study do not confirm this hypothesis. The second null hypothesis is partially accepted, as statistically significant differences were observed only for one shade (A3). The third hypothesis is partially rejected, as there were statistical significant differences for all the parameters evaluated among the shaded groups.
According to the basic colorimetric principles that were established for years, measurement of color differences of a tooth in the oral environment included the following classification for the clinical significance of the measured ΔEab value:38 (ΔE ≤ 1: imperceptible color differences, 1 ≤ ΔE ≤ 3.7: visible difference, clinically insignificant, ΔE ≥ 3.7: visible difference, clinically significant). Ruyter et al.21 after investigating the color stability of dental composite resin materials suggested that sample pairs were unacceptable when the color difference ΔEab was approximately 3.3. Defining the limits of human eye to distinguish a color difference, ΔEab value is an important parameter for the evaluation of color change of natural teeth or aesthetic materials. According to most researchers, when ΔEab between two samples is less than 1, it is considered as color matching.39 Due to specific observation conditions in the oral cavity, the boundary of perceived color differences between natural and artificial teeth is not fully delimited. In some studies, color differences of ΔEab equal to 2 or 3 are considered visible but clinically insignificant.4041 In most cases the level of color difference beyond which the difference is clinically significant is assessed at ΔEab= 3.32142, while most recent studies suggest that the acceptability threshold in dentistry should be ΔEab = 2.7.2543 In any case, the subjective factor of color perception is important because some people can distinguish color difference of ΔEab = 0.5, while others find it difficult to perceive differences of even higher ΔEab values (ΔEab > 4). In this study, color difference with ΔEab greater or equal to 3.3 was considered visually perceptible but clinically unacceptable and only values below 3.3 were considered accepted. Based on these, nanosilica reinforcement resulted in ΔEab values quite below 3.3 for all tested shades suggesting that color change due to the reinforcing agent would be clinically insignificant. By analyzing the data regarding the most recent acceptability thresholds for dentistry, which consider ΔEab = 2.7 an acceptable value,25 it was further confirmed that even with these values, the reinforcing nanoparticles could not significantly alter color.
The results of this study showed that adding 0.25 wt% SiO2 nanoparticles affected the color of acrylic resin to some extent, since the average values of measured ΔEab were 2.69 for A3 shade, 1.88 for B3 shade, 2.26 for C3 shade, and 2.52 for D3 shade. All these ΔEab values were significantly lower compared to the value 3.3 (P < .001) and not significantly different from 2.7 (P > .05). This means that in a clinical environment such as the oral cavity, these color changes can hardly be perceived from either the dentist or the patient. This is further confirmed by the particularly low ΔL* values recorded for all shades, as stated by Hunter and Harold44 that if the color difference between two samples is less than 4 units ΔEab, then the samples are not visible to the average observer, provided that the difference of the brightness is less than 2 units ΔL*.
In the present study, the data were also calculated with the recently established equation of Luo et al.,22 which has been proved to be more efficient in defining color difference perception thresholds in dentistry.2425 As recently has been argued, the acceptability threshold level of ΔE00 in dentistry should be no more than 1.8.25 The results of this study showed that color differences between the control and the reinforced specimens were significantly lower than the value for all the shades evaluated, with the exception of A3, which presented the highest and significantly different ΔE00 value.
The presence of a reinforcing agent with a small size causes a significant reduction in transmission of light through the resin. A probable cause is the diffusion of transmitted light through the multiple scattering of light through the material. There is a direct correlation between the light scattering and the proportion of the reinforcing agent in composite resins as well as its shape and size.45 Materials containing fewer amounts of irregular-sized reinforcing agents provided a greater wavelength dependence of the light transmission in relation to larger-sized and spherical reinforcing agents. Differences in shape and size of the reinforcing agent can lead to a significant difference in the spectral distribution of transmitted light through the material. According to Arikawa et al.,46 materials containing smaller and irregular-shaped fillers showed higher light transmittance and diffusion angle distribution with a sharper peak, as compared with those containing larger and sphericalshape fillers. Materials with reinforcing agent of the smallest size lead to the highest values of total light transmission and to less light scattering within the material.4647 In this study, filler average size was in nanometer scale (12 nm) quite lower than the average size of those used in the studies of Arikawa et al.46 and Emami et al.,47 which has been reported to enhance light transmittance and improve the optical properties of nanocomposite resins.4849
It has been reported that the filler shape can affect both b* and a* color parameters. In particular, reinforcing agents with non-spherical shape tend to cause an increase in parameter b* and a decrease in parameter a* values, and this effect is enhanced by increasing the content of the reinforcing agent.50 This means that the color of resins having non-spherical shape reinforcing agent is shifted towards green and yellow. In this study, silica nanoparticles caused a remarkable color shifting towards green and yellow, suggesting the formation of nanoparticle agglomerates of non-spherical shape, which could be further determined through transmission electron analysis (TEM).
Another factor that affects color changes is the specific surface area of the reinforcing agent.46 Generally, the specific surface area of the reinforcing agent is directly linked to its shape. Reinforcing agent with unclear shape and rough surface has a larger surface area than those with spherical shape and smoother surface. Higher surface area is correlated to higher changes in ΔE. In this study, SiO2 nanoparticles had a particularly high specific surface area of about 175 – 115 m2/g26 that retained ΔE values changes in clinically accepted levels, probably due to the spherical shape and small size of isolated SiO2 nanoparticles. More investigation is needed in future studies on the precise mechanism of color changes caused by the properties of the reinforcing agents. Color of composites is a complex combination of their optical behavior in the mass media.
One-way ANOVA showed statistically significant differences among the four color shades, for all the parameters evaluated. There were statistically significant differences for ΔEab between A3 and all other shades, as well as between C3 and all other shades (P < .001). Concerning Δb*, there were statistically significant differences between A3 and C3 (P < .001), between A3 and D3 (P < .007), and between B3 and both C3and D3 (P < .001) for both comparisons. Statistically significant differences in luminance ΔL* were found between A3 and C3 (P < .001), between B3 and C3 (P < .001), and between B3 and D3 (P < .028). Finally, statistically significant differences for ΔEab were observed between A3 and B3 (P < .001) and between B3 and D3 (P < .002). Therefore, pigments contained in red-brown and redgrey shades mostly affected the total change in color after the reinforcement with NSiO2 compared to red-yellow shades. Regarding ΔE00, there were statistically significant mean differences only between the shade A3 and all other shades, in accordance to ΔEab for the red-brown shade (A3).
In the present study, an increase of brightness L* was observed due to the SiO2 nanoparticles reinforcing for all shades, as was expected due to the white color of silica nanoparticles. However, the smallest increase was recorded for the C3 shade (0.07), which is the shade with the less brightness among the four shades evaluated, while higher increase was recorded for the A3, B3, and D3 shades (0.95, 1.10, and 0.42, respectively), which are shades of similar brightness. Differences observed in a*, i.e. the red-green axis, were: −1.94 in A3 shade (change from red to green shades), −0.07 in C3 shade (shifting to less red shades), and −1.02 in D3 shade. Similarly in brightness, the C3 shade showed the least affection in the red-green axis. Finally concerning b*, a remarkable increase was observed in all shades, namely 1.39 in A3, 0.84 in B3, 2.20 in C3, 2.14 in D3 (change from blue to yellow shades).
The color perception of natural teeth depends on their optical properties (translucency, fluorescence, smoothness, gloss) and the observational conditions, and is influenced by a multitude of factors that cannot be reproduced by any laboratory environment. It has been shown that the neighboring tissues of natural teeth affect their optical properties. In particular, it has been reported that the cutting third of a posterior tooth is influenced by the dark background of the oral cavity, while the cervical third shows an increase in red shades due to the presence of gum.51 Consequently, color measurement of real provisional restorations in the oral cavity could lead to different results, which needs further investigation.
CONCLUSION
Reinforcement of the selected PMMA resin for interim restorations with SiO2 nanoparticles resulted in significantly lower color change as expressed with the ΔEab value compared to the upper clinically acceptable values of 3.3 and 2.7, and the ΔE00 value compared to the acceptability threshold value of 1.8, with the exception of the A3 shade for ΔE00. There were statistically significant differences among the 4 shades after the reinforcement with SiO2 nanoparticles for all parameters Δa*, ΔL*, Δb*, ΔEab and ΔE00. Color pigments in red-brown (A3) and red-grey (D3) shades affect the total color change to a greater extent after the reinforcement with SiO2 nanoparticles compared to the red-yellow (B3) shade. Under the limitations of this in vitro study, it can be concluded that reinforcing PMMA with 0.25 wt% SiO2 nanoparticles slightly affects the optical properties of the PMMA resin without being clinically perceivable.
 XML Download