

 PDF
PDF Citation
 Print
Print


INTRODUCTION
In 2009, the sectioned images of a cadaver head were produced as a part of the Visible Korean.1 Owing to the real color (48 bits color) and small voxel size (0.1 mm × 0.1 mm × 0.1 mm) of the images, various outcomes for medical education and research were produced. Neuroanatomy atlases, consisting of only sectioned images2 and sectioned images with 7 Tesla (T) magnetic resonance images (MRIs),3 have been published. Using the sectioned images and segmented data, two dimensional applications for personal computers45 and android mobile devices6 have been produced for widespread use. Moreover, surface and volume models of diverse head structures have been produced.789101112 Currently, real color sectioned images of Visible Korean are essential materials for learning neuroanatomy, sectional anatomy, and radiology and have opened a new chapter of sophisticated gross anatomy research.
On the other hand, the resolution of the images made in 2009 was insufficient to observe detailed structures, such as each nuclei of the thalamus,13 deep nuclei in the cerebellum,14 brainstem nuclei,15 and the connections of each fiber in the brain white matter.16 These detailed structures should be identified to provide a morphological background to neuroscience research.17 Moreover, the sectioned images in 2009 were not accompanied by 3T MRIs and diffusion tensor images (DTIs) that can be the reference data for interpreting radiologic images.18
The purpose of this study was to produce advanced sectioned images of the head with a higher resolution than previous sectioned images. In addition, the 3T MRIs and DTIs of the same cadaver were presented together. The advanced images enabled the observation of minute structures that were not visible in the previous images.
METHODS
Cadaver preparation and medical imaging
A female cadaver without a head pathology was donated. For a further alignment process, three radiologic markers were attached to the midline of the anterior side of the head, while two of them were attached to the posterior side. Within 24 hours after death, the head region of the cadaver was scanned for 3T MRIs using both T1 and T2 methods (repetition time, 2,500 ms; echo time, 8 ms). While scanning the MRIs, the reference lines by the anterior commissure (AC) and posterior commissure (PC) were identified to determine the horizontal, coronal, and sagittal planes.19 In addition, the DTIs were also scanned (Table 1 and Fig. 1).
Table 1
Specification comparison between data of previous study and data of this study

| Variables | Data of previous study26 | Data of this study | |
|---|---|---|---|
| Sex | Male | Female | |
| Age at death | 67-year-old | 70-year-old | |
| Cause of death | Myasthenia gravis | Guillain-Barré syndrome | |
| MRIs | T1 and T2 of 1.5 Tesla | T1 and T2 of 3 Tesla | |
| DTIs | Not scanned | Scanned | |
| CTs | Scanned | Not scanned | |
| Sectioned images | |||
| Digital camera | Canon EOS 5D (released in 2005) | Canon EOS 5Ds R (released in 2015) | |
| Color depth | 48 bits color | 48 bits color | |
| Resolution | 4,368 × 2,912 | 8,688 × 5,792 | |
| Interval | 0.1 mm | 0.04 mm | |
| Pixel size | 0.1 mm × 0.1 mm | 0.04 mm × 0.04 mm | |
| Number of images | 2,343 | 4,000 | |
| File format | TIFF | TIFF | |
| File size of an image | 72 MBytes | 288 MBytes | |
| Total file size | 166 GBytes | 1,090 GBytes | |
MRI = magnetic resonance images, DTI = diffusion tensor image, CT = computerized tomography, TIFF = tagged image file format.
![]()
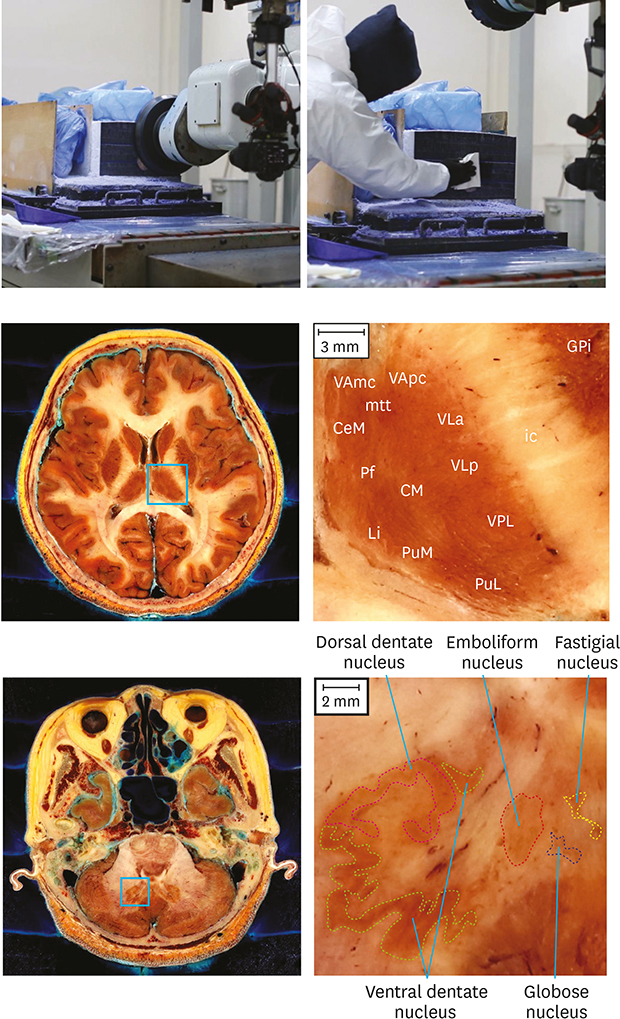
 | Fig. 1Overall production process of cadaver images. (A) Cadaveric head with the radiologic markers on skin being scanned for MRIs. (B) The anterior commissure-posterior commissure line indicated as red lines on the horizontal and sagittal planes of the volume model made from the MRIs. (C) Cadaveric head being placed on the embedding box using a cross line laser device for the alignment. (D) Embedding box including the head placed on the cryomacrotome, the head sectioned at 0.04-mm intervals, and frost on the sectioned surface being wiped away.
|
The MRIs were volume reconstructed using MRIcroGL software.20 By observing the horizontal, coronal, and sagittal planes on the volume model, the reference lines for the alignment could be drawn on the skin according to the radiologic markers. The cadaver was frozen in a deep freezer at –70 degrees Celsius. After freezing, the cadaver head was detached from the rest of body and placed on an embedding box. To align the head according to the horizontal, coronal, and sagittal planes of the MRIs, the reference lines on the skin were matched to the cross line laser. The placed head was embedded in a gelatin solution and frozen again (Fig. 1).
Serial sectioning
The frozen cadaveric head was sectioned serially using a cryomacrotome. Sectioning was performed serially at 0.04-mm intervals. After every sectioning, frost and foreign substances on the sectioned surface were wiped away with 99% ethyl alcohol. Protruding objects on the surface were removed using a scalpel (Fig. 1).
A Canon™ EOS 5DsR digital single lens reflex camera and Canon™ EF 100mm f/2.8L Macro IS USM Lens were employed (resolution, 8,688 × 5,792 pixels). The distance from the digital camera to the sectioned surface was adjusted to yield a photograph area of 347.5 mm in horizontal length and 231.7 mm in vertical length on the sectioned surface, corresponding to a pixel size of 0.04 mm × 0.04 mm. Two Elinchrom™ Digital S Strobes with an Elinchrom™ Digital 2 power pack were used to maintain a constant brightness of the sectioned surface. A Tiffen™ Color Control Patch was placed on the sectioned surface and photographed every day for post processing of these images. The sectioned surface was photographed using a digital camera (ISO 100, shutter speed 1/250, aperture F/13, manual focus). The photograph was assessed by anatomists on a computer monitor using Adobe Photoshop CS6 (Adobe Systems, Inc., San Jose, CA, USA).
RESULTS
Four thousand sectioned images of the whole head were produced at 0.04 mm intervals, 0.04 mm × 0.04 mm sized-pixel, 48 bits color, and tagged image file format (TIFF). The file size of a single image was 288 Mbytes while that of the total 4,000 images was 1,090 GBytes (Table 1). Furthermore, the sectioned images corresponded to the 3T MRIs (T1, T2) and DTIs of the identical cadaver. Unlike the MRIs, the sectioned images enabled direct observations of the actual color of the inside structures of the cadaver head. The DTIs enabled direct observations of each tract of the white matter (Fig. 2).
 | Fig. 2Sectioned images, T1 MRIs, T2 MRIs, and DTIs on the horizontal planes. Images are at the levels of (A) the crown, (B) body of corpus callosum, (C) lentiform nucleus, (D) horizontal 0-mm plane containing anterior commissure (yellow arrow) and posterior commissure (green arrow head), and (E) neck.MRI = magnetic resonance image, T = Tesla, DTI = diffusion tensor image.
|
Detailed structures of the cerebrum and cerebellum were observed on the sectioned images. As a representative, the thalamus was divided according to the grain of the tissue, which corresponded to the typical taxonomy.1321 For example, the hippocampus on the sectioned images had a similar curvature to that of neurohistological stains. The cellular layers of the lateral geniculate nucleus could be distinguished on the sectioned images without staining. The cerebellar nuclei could be identified on the sectioned images, similar to the neurohistological stains (Fig. 3).222324
 | Fig. 3Sectioned images showing the cerebrum. (A) Thalamus, (B) lateral geniculate nucleus, (C) hippocampus, and (D) deep cerebellar nuclei are identified on the horizontal sectioned images. The area selected with a green box on the overview images (left) is magnified (middle) to be compared with the neurohistological stains of neuroanatomy textbooks (right) at 1st, 2nd, 3rd, and 4th rows.CeM = central medial nucleus, CM = centromedial nucleus, GPi = globus pallidus internal segment, GPe = globus pallidus external segment, Hb = habenula, ic = internal capsule, Li = limitans nucleus, mtt = mamillothalamic tract, Pf = parafascicular nucleus, PuL = lateral pulvinar, PuM = medial pulvinar, VAmc = ventral anterior nucleus magnocellular, VApc = ventral anterior nucleus parvocellular, VLa = ventral lateral anterior nucleus, VLp = ventral lateral posterior nucleus, VPL = ventral posterior lateral nucleus.
|
Detailed structures from the brainstem to the spinal cord were observed on the sectioned images. In the midbrain, the oculomotor nucleus and medial longitudinal fasciculus were observed. In the pons, it was possible to observe small arteries, nerve fibers, and nuclei like the superior central nucleus of the raphe and dorsal raphe nucleus. In the medulla oblongata, the nuclei of the cranial nerves were identified, such as the solitary nucleus and hypoglossal nucleus. In the cervical segment of the spinal cord, the lateral corticospinal tract invaded almost the entire area of the posterior horn. The medial longitudinal fasciculus and spinothalamic tract were observed from the brainstem to the spinal cord. The brainstem could be identified on the sectioned images, similar to the neurohistological stains (Fig. 4).
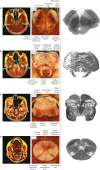 | Fig. 4Sectioned images showing the brainstem. (A) Midbrain, (B) pons, (C) rostral medulla oblongata, and (D) cervical spinal cord identified on the sectioned images. The area selected with a green box on the overview images (left) is magnified (middle) to be compared with the neurohistological stains slides (right).
|
White matter fibers can be observed on a manually dissected brain, and they could also be observed on the sectioned images of this study. For verification, the sectioned image at the level of the thalamus was compared with the 3D tractograph made from the DTIs of the same cadaver. The anterior thalamic radiation and superior thalamic radiation were identified on both the sectioned images and 3D tractography (Fig. 5).
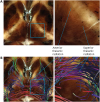 | Fig. 5White matter fibers identified on a sectioned image (A) and a DTI tractrograph of the cadaver (B). Both on a sectioned image and DTI tractrograph, the anterior thalamic radiation shows the fiber direction to the anterior side, while the superior thalamic radiation shows the fiber direction to the lateral side. On the overview of the DTI tractrograph, the destinations of the fibers are indicated (bottom left).DTI = diffusion tensor image.
|
DISCUSSION
As the resolution of MRIs improves continuously, an increasing number of structures can be identified on the MRIs. A more detailed sectional anatomy should be understood to interpret the MRIs precisely. To understand the detailed sectional anatomy, more detailed educational resources than the state of the art 7T MRIs is required. Although upcoming technologies, including 14T MRIs, will have an improved resolution, their intrinsic limitation of grayscale and blurriness cannot be overcome.25 Consequently, the sectioned images will be an ideal resource for examining the improved MRIs, owing to their higher resolution and actual color.
The image resolution of the our previous study was 4,368 × 2,912,1 while that of this study was 8,688 × 5,792. Both the horizontal and vertical pixel numbers were increased almost two-fold. To reduce the pixel size of the new images, the field of view was reduced. Moreover, the sectioning interval was reduced to manufacture improved sectioned images of a cadaver head. As a result, the new images have a voxel size of 0.04 mm × 0.04 mm × 0.04 mm, which is 40% of the previous images in every direction; in other words, 2.5 fold higher resolving power (Fig. 6).25
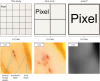 | Fig. 6Pixel sizes of the new sectioned images, previous sectioned images, and 7 Tesla magnetic resonance images (1st row).26 As a representative, the vessels and meninges of the optic nerve are displayed (2nd row). The pixelation is least visible on the new sectioned images of this study.
|
The continuously improving sectioned images of a cadaver head are useful for multiple purposes as follows.
First, the sectioned images can compensate the conventional neurohistological stains. Although the resolution of the sectioned images is less powerful than that of stained specimens, the sectioned images can be useful in the field of neuroanatomy. Stained specimens show only selected structures (e.g., only the nuclei in Nissl staining, and only the myelin sheaths in Luxol-fast blue staining), the sectioned images can show all the visible structures in actual color (Figs. 3 and 4).
Second, the sectioned images themselves are useful neuroanatomy content. The previous sectioned images of the head were made into an atlas for sectional anatomy on their own2 and along with 7T MRIs.3 The new sectioned images with 3T MRIs and DTI of a cadaver have greater potential to depict detailed sectional anatomy.27
Third, the new sectioned images can be made into 3D models for educational purposes as in previous research.71112 The application of 3D printing2829 and augmented reality30 will enhance the learning effects of these models.
Fourth, the 3D models can be used for virtual experiments on the effects of electromagnetic waves and radiation, similar to sectioned images.313233
Twenty years earlier, the image resolution of this study was believed to be unachievable. As the resolution of digital cameras improve, the quality of the sectioned images improve. In another 20 years, it is difficult to estimate how the resolution of sectioned images will improve. Therefore, the ultimate aim of sectioned images is to reach the field of microscopic observations. The sectioned images of this study will serve as foundation material in the field of sectional anatomy. To other researchers to produce a virtual experiment and virtual reality using 3D models, the images of this study will provided free of charge in anatomy.co.kr.
 XML Download