Journal List > J Korean Med Sci > v.34(Suppl 1) > 1130946

Lee, Choi, Jang, Lee, Kim, Yoo, Oh, and Ryu: Effect of Institutional Case Volume on In-Hospital and Long-Term Mortality in Critically Ill Patients Requiring Mechanical Ventilation for 48 Hours or More

Abstract

Background

The purpose of this study was to evaluate whether institutional case volume affects clinical outcomes in patients receiving mechanical ventilation for 48 hours or more.

Methods

We conducted a nationwide retrospective cohort study using the database of Korean National Healthcare Insurance Service. Between January 2007 and December 2016, 158,712 adult patients were included at 55 centers in Korea. Centers were categorized according to the average annual number of patients: > 500, 500 to 300, and < 300.

Results

In-hospital mortality rates in the high-, medium-, and low-volume centers were 32.6%, 35.1%, and 39.2%, respectively. After adjustment, in-hospital mortality was significantly higher in low-volume centers (adjusted odds ratio [OR], 1.332; 95% confidence interval [CI], 1.296–1.368; P < 0.001) and medium-volume centers (adjusted OR, 1.125; 95% CI, 1.098–1.153; P < 0.001) compared to high-volume centers. Long-term survival for up to 8 years was better in high-volume centers.

Conclusion

Centers with higher case volume (> 500 patients/year) showed lower in-hospital mortality and long-term mortality, compared to centers with lower case volume (< 300 patients/year) in patients who required mechanical ventilation for 48 hours or more.

Graphical Abstract

jkms-34-e212-abf001

INTRODUCTION

Critically ill patients who require mechanical ventilation (MV) have shown improved survival over time due to interventions such as lung protective ventilation1 and advances in supportive care.2 Patients requiring MV have shown an estimated in-hospital mortality rates of 32% in the US3 and 31.4% in France.4
Higher hospital case volume has been associated with lower mortality high-risk surgical procedures56 and for critically ill patients.4789 The impact of case volume seemed more prominent in critically ill patients with the high severity of illness10 and in patients with gastrointestinal and respiratory diagnoses.8 While earlier studies reported that the higher case volume is associated with improved outcome in critically ill patients,78 more recent and large-scale studies have been unable to reproduce the effect.911 Moreover, the impact of critically ill patient case volume on long-term mortality has not been evaluated.
The objective of our study was to assess the impact of case volume on in-hospital and long-term mortality in critically ill patients who required MV for 48 hours or more. We hypothesized that higher institutional case volume may be associated with lower in-hospital and long-term mortality.

METHODS

Data source and study population

The National Health Insurance Service (NHIS) database contains all claims data for the population covered under the National Health Insurance (NHI) program and the Medical Aid program in Korea. The NHIS provides its database to researchers after de-identification of personal information to aid generation of real-world evidence.12
Adult patients (age ≥ 18) who received MV for 48 hours or more between 2008 and 2016 in the intensive care unit (ICU) were identified and extracted from the NHIS database by searching NHI codes AJ100, AJ110, AJ120, AJ130, AJ140, or AJ150 during hospitalization. Underlying comorbidities such as hypertension, diabetes mellitus, coronary artery disease, and chronic kidney disease (CKD), and cardiovascular disease were extracted from the database using International Classification of Diseases (ICD)-10 codes. The Elixhauser comorbidity index, derived from 30 disease entities using ICD-10 codes13 and shown to correlate with hospital mortality,14 was used as a covariable to adjust for severity of illness. The Elixhauser comorbidity system has been shown to be slightly superior to the previously used Charlson comorbidity system at adjusting for comorbidity.15
In-hospital mortality, ICU length of stay, and hospital length of stay were also extracted. Because death certificates are automatically reported to the NHI, long term (1, 3, 5 year) mortality was detected when healthcare coverage by the NHI was terminated due to death.

Definition of case volume

The case volume was defined as the average annual number of adult patients (age ≥ 18) who received MV for 48 hours or more. Case volume was categorized as follows; low case volume (< 300 cases/year), medium case volume (300–500 cases/year), and high case volume (> 500 cases/year).

Statistical analysis

Patient characteristics were compared according to case volume using the one-way analysis of variance or Kruskal-Wallis test for continuous variables and χ2 test or Fisher's exact test for categorical variables, respectively. In-hospital mortality according to case volume was assessed using logistic regression model after adjusting age, gender, comorbidities, and Elixhauser comorbidity index. The goodness-of fit for the logistic regression model was assessed using Hosmer-Lemeshow test. The Kaplan-Meier survival curve was derived according to case volume and the log-rank test was performed to compare the survival curve. The goodness-of fit for the Cox proportional hazard model was assessed using the likelihood ratio test and the proportional hazard assumption was explored using the log-minus-log plot. Clinical outcomes were compared according to case volume using the one-way analysis of variance.
All analyses were performed using SAS 9.4 (SAS Institute, Cary, NC, USA). Results were considered statistically significant when P values were less than 0.05.

Ethics statement

This study was a retrospective cohort study and the study protocol was approved by the Institutional Review Board of Seoul National University Hospital (No. 1801-023-912). Informed consent was waived by the institutional review board due to the retrospective study design.

RESULTS

A total of 158,712 patients received MV for 48 hours or more in 55 centers from January 2008 to December 2016 in Korea. Patient and center characteristics are presented in Table 1 with 38% (61,024) of patients admitted to high-volume centers, while 37.2% (58,997) and 24.4% (38,691) of patients were admitted to medium-volume and low-volume centers, respectively (Table1). About 72% of patients were admitted to hospitals in urban areas.
Table 1

Patient and center characteristics

jkms-34-e212-i001
Characteristics Total < 300 cases/yr 300–500 cases/yr > 500 cases/yr P value
No. of patients 158,712 38,691 58,997 61,024
No. of centers 55 28 18 9
Age, yr < 0.01
Total, median (IQR) 68 (55–76) 69 (57–77) 68 (56–77) 66 (54–75) < 0.01
18 ≤ age < 50 25,506 (16.1) 5,535 (14.3) 8,867 (15.0) 11,104 (18.2)
50 ≤ age < 60 25,887 (16.3) 5,900 (15.2) 9,261 (15.7) 10,726 (17.6)
60 ≤ age < 70 36,112 (22.8) 8,585 (22.2) 13,112 (22.2) 14,415 (23.6)
70 ≤ age 71,207 (44.9) 18,671 (48.3) 27,757 (47.0) 24,779 (40.6)
Gender 0.03
Men 98,599 (62.1) 24,071 (62.2) 36,413 (61.7) 38,115 (62.5)
Women 60,113 (37.9) 14,620 (37.8) 22,584 (38.3) 22,909 (37.5)
Comorbidities
Hypertension 45,729 (28.8) 11,035 (28.5) 17,032 (28.9) 17,662 (28.9) 0.33
Diabetes 17,943 (11.3) 4,534 (11.7) 6,135 (10.4) 7,274 (11.9) < 0.01
Coronary artery disease 31,075 (19.6) 8,212 (21.2) 11,731 (19.9) 11,132 (18.2) < 0.01
Chronic kidney disease 16,074 (10.1) 3,754 (9.7) 5,724 (9.7) 6,596 (10.8) < 0.01
Cerebrovascular disease 28,029 (17.7) 6,900 (17.8) 11,219 (19.0) 9,910 (16.2) < 0.01
Elixhauser comorbidity index, mean (SD) 13.5 (10.3) 13.1 (10.3) 14.2 (10.5) 13.1 (10.0) < 0.01
ICU LOS, median (IQR) 12 (7–22) 12 (7–23) 12 (7–22) 12 (7–22) < 0.01
Hospital LOS, median (IQR) 26 (14–50) 26 (14–50) 26 (14–48) 27 (15–51) < 0.01
In-hospital mortality 56,133/158,712 (35.4) 15,152/38,691 (39.2) 21,110/58,997 (35.8) 19,871/61,024 (32.6) < 0.01
1-year mortality 86,721/147,534 (58.8) 22,224/35,906 (61.9) 32,742/54,585 (56.0) 31,755/57,043 (55.7) < 0.01
3-year mortality 74,745/111,111 (67.3) 19,362/27,507 (70.4) 27,641/40,463 (68.3) 27,742/43,141 (64.3) < 0.01
5-year mortality 51,021/71,521 (71.3) 13,318/17,890 (74.4) 18,843/25,984 (72.5) 18,860/27,647 (68.2) < 0.01
Numbers reported as No. (%), median (IQR), and mean (SD).
IQR = interquartile range, SD = standard deviation, ICU = intensive care unit, LOS = length of stay.
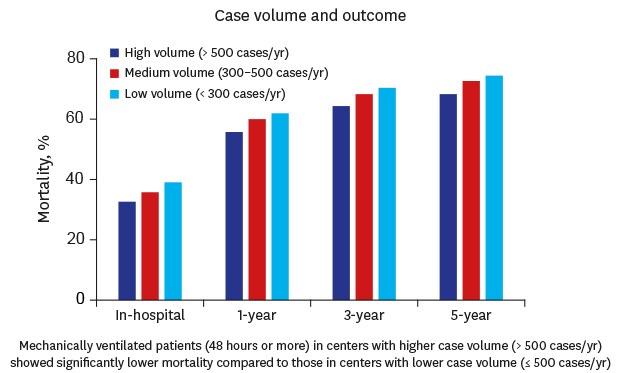
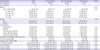
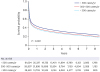
The overall in-hospital mortality rate was 35.4% (56,133/158,712). In-hospital mortality rates in high-, medium-, and low-volume centers were 32.6%, 35.8%, and 39.2%, respectively. The relationship between the average annual volume and in-hospital mortality rate is shown in Fig. 1.
Fig. 1

Relation between the average annual volume and in-hospital mortality after mechanical ventilation for 48 hours or more.

ICU = intensive care unit.
jkms-34-e212-g001
After adjusting for age, gender, comorbidities, and Elixhauser comorbidity index, medium-volume centers (adjusted odds ratio [OR], 1.13; 95% confidence interval [CI], 1.10–1.15; P < 0.01) and low-volume centers (adjusted OR, 1.33; 95% CI, 1.30–1.37; P < 0.01) showed significantly higher in-hospital mortality compared to high-volume centers (Table 2).
Table 2

Univariable and multivariable logistic analyses for in-hospital mortality

jkms-34-e212-i002
Variables In-hospital mortality Unadjusted Adjusted
OR (95% CI) P value OR (95% CI) P value
Total 56,133/158,712 (35.4)
Age, yr
18 ≤ age < 50 7,919 (31.1) Reference Reference
50 ≤ age < 60 8,921 (34.5) 1.17 (1.13–1.21) < 0.01 1.23 (1.18–1.27) < 0.01
60 ≤ age < 70 12,957 (35.9) 1.24 (1.20–1.29) < 0.01 1.37 (1.32–1.42) < 0.01
70 ≤ age 26,336 (37.0) 1.30 (1.26–1.34) < 0.01 1.52 (1.50–1.56) < 0.01
Gender
Men 35,289 (35.8) Reference Reference
Women 20,844 (34.7) 0.95 (0.93–0.97) < 0.01 0.99 (0.97–1.01) 0.35
Case volume
> 500/yr 19,871 (32.6) Reference Reference
300–500/yr 21,110 (35.8) 1.15 (1.13–1.18) < 0.01 1.13 (1.10–1.15) < 0.01
< 300/yr 15,152 (39.2) 1.33 (1.30–1.37) < 0.01 1.33 (1.30–1.37) < 0.01
Comorbidities
Hypertension 9,836 (21.5) 0.40 (0.39–0.41) < 0.01 0.36 (0.36–0.37) < 0.01
Diabetes 4,602 (25.7) 0.60 (0.58–0.62) < 0.01 0.76 (0.73–0.79) < 0.01
Coronary artery disease 10,585 (34.1) 0.93 (0.91–0.96) < 0.01 0.93 (0.91–0.96) < 0.01
Chronic kidney disease 6,786 (42.2) 1.38 (1.34–1.43) < 0.01 1.54 (1.49–1.60) < 0.01
Cerebrovascular disease 9,153 (32.7) 0.86 (0.84–0.89) < 0.01 0.89 (0.87–0.92) < 0.01
Elixhauser comorbidity index 1.02 (1.02–1.02) < 0.01 1.02 (1.02–1.02) < 0.01
Numbers reported as No. (%) and OR (95% CI).
OR = odds ratio, CI = confidence interval.
Low-volume centers were associated with higher 1-year and 3-year mortality compared with high-volume centers (Table 3 and Fig. 2). In low-volume and medium volume centers, older age, men, patients with CKD or cerebrovascular disease, and higher Elixhauser comorbidity index were identified as significant risk factors of long-term mortality (Table 3).
Table 3

Multivariable logistic analyses for 1-, 3-, 5-year mortality

jkms-34-e212-i003
Variables 1-year mortality 3-year mortality 5-year mortality
OR (95% CI) P value OR (95% CI) P value OR (95% CI) P value
Age, yr
18 ≤ age < 50 Reference Reference Reference
50 ≤ age < 60 1.427 (1.375–1.481) < 0.001 1.486 (1.425–1.551) < 0.001 1.615 (1.532–1.703) < 0.001
60 ≤ age < 70 1.932 (1.866–2.001) < 0.001 2.246 (2.157–2.339) < 0.001 2.628 (2.498–2.764) < 0.001
70 ≤ age 3.365 (3.258–3.476) < 0.001 4.446 (4.279–4.620) < 0.001 5.665 (5.390–5.953) < 0.001
Gender
Men Reference Reference Reference
Women 0.877 (0.857–0.897) < 0.001 0.848 (0.825–0.871) < 0.001 0.842 (0.812–0.872) < 0.001
Case volume
> 500/yr Reference Reference Reference
300–500/yr 1.114 (1.087–1.142) < 0.001 1.105 (1.072–1.140) < 0.001 1.143 (1.099–1.189) < 0.001
< 300/yr 1.240 (1.205–1.276) < 0.001 1.239 (1.197–1.282) < 0.001 1.255 (1.200–1.313) < 0.001
Comorbidities
Hypertension 0.395 (0.385–0.405) < 0.001 0.455 (0.441–0.469) < 0.001 0.483 (0.465–0.503) < 0.001
Diabetes 0.783 (0.756–0.810) < 0.001 0.890 (0.854–0.929) < 0.001 0.953 (0.902–1.006) 0.084
Coronary artery disease 0.841 (0.818–0.866) < 0.001 0.796 (0.769–0.823) < 0.001 0.792 (0.759–0.827) < 0.001
Chronic kidney disease 1.733 (1.665–1.803) < 0.001 1.939 (1.840–2.044) < 0.001 2.079 (1.934–2.236) < 0.001
Cerebrovascular disease 1.090 (1.059–1.123) < 0.001 1.169 (1.128–1.213) < 0.001 1.185 (1.130–1.243) < 0.001
Elixhauser comorbidity index 1.029 (1.028–1.030) < 0.001 1.031 (1.030–1.033) < 0.001 1.031 (1.029–1.032) < 0.001
Numbers reported as No. (%) and OR (95% CI).
OR = odds ratio, CI = confidence interval.
Fig. 2

Kaplan-Meier survival curve after mechanical ventilation for 48 hours or more according to the center volume.

jkms-34-e212-g002
Long-term survival for up to 8 years was also significantly higher in high-volume centers compared to or low-volume or medium-volume centers (P < 0.01) (Supplementary Fig. 1).

DISCUSSION

Higher case volume of patients receiving MV for 48 hours or more was associated with significantly lower in-hospital mortality and lower long term mortality for up to 8 years.
Typically, 20%–40% of ICU patients require MV16 and mechanically ventilated patients are at greater risk of death with disproportionately higher utilization of health care resources.1718 Studies have reported that hospitals with higher ICU patient volume tend to show lower adjusted mortality rates compared to hospitals with less ICU patients, although less so in the surgical population.7919 As significant resources and experienced medical personnel are required to provide quality critical care to ICU patients and also trauma patients, regionalization of critical care20 or trauma care21 have been proposed. The positive relationship between case volume and patient outcome, as also seen in our study, may provide additional basis for regionalized approach in critical care for patients requiring prolonged MV.
In our analysis, mechanically ventilated patients treated in centers with more than 500 cases per year showed better survival compared to patients managed in institutions with lower annual case volumes, even after adjusting for confounders. These results provide evidence for a relationship between volume and outcome in mechanically ventilated patients. Similar relationships between case volume and outcome have been reported in previous studies. Plausible explanations for the relationship include higher nurse-to-patient ratio and greater number of experienced staff as experience is likely to be gained more quickly in centers with higher case volume. Higher probability of multidisciplinary ICU teams comprised of various specialties and implementation of patient care protocols proven to increase survival such as lung protective low tidal volume ventilation and protocols for light sedation may also have played a role.2223
On the contrary, a study that analyzed the Australian and New Zealand adult ICU database was not able to demonstrate the previously reported relationship between higher hospital volume results and reduced in-hospital mortality.9 The study included all mechanically ventilated ICU patients regardless of the duration of MV, therefore patients requiring brief MV who were at lower risk of death were included. Another difference compared to our study and previous studies lies in that critical care in the two countries is state of the art with almost uniformly closed ICUs24 staffed with highly trained critical care nurses and intensivists. Considering that these factors may have attenuated the volume-outcome relationship, the case volume may play a role only in healthcare systems that include hospitals with relatively less resources and training.2526 Another study that used administrative data to evaluate the effect of case volume on death within 30 days in patients who were mechanically ventilated for more than 2 days also failed to show an association.27 Besides the lack of power to compare between the lowest case volume group and the other groups,28 more than 80% of the patients in the lowest group and 32% of patients in the second lowest group were transferred to larger hospitals. Therefore, a direct comparison between groups were inappropriate. Other studies have suggested that there may be a threshold beyond which mortality benefit is lost with increased case volume.2930 In addition, diagnosis also seems to be a factor as risk-adjusted mortality was decreased in patients within the same diagnostic category as hospital volume increased.31
The overall in-hospital mortality in patients who were mechanically ventilated for 48 hours or more was 35.4% in our study, which was comparable with previous studies.432 Patients who received prolonged MV and ICU care most likely require hospital follow-up due to cognitive, psychological, and physical impairment.3334 However, few studies have evaluated the association between case volume and long-term outcome in patients requiring prolonged MV. Only one study investigated long term mortality in mechanically ventilated patients and demonstrated that higher case volume were independently associated with lower 5-year mortality compared hospitals with lower case volume,34 which was consistent with our study. Our study also showed that higher case volume was associated with superior long-term mortality of up to 5 years.
Old age (≥ 70-year-old) and CKD were significantly associated with short and long-term mortality in addition to higher case volume in our study. Old age is a consistently reported predictor of in-hospital mortality in patients receiving MV.1735 CKD is a known risk factor of mortality in the general population36 as well as patients with heart failure37 or myocardial infarction.38 In accordance with our study, a recent study demonstrated that preexisting CKD had profound impact on 30 day- and 1-year mortality in critically ill patients requiring MV.39
The NHI program of Korea is a universal healthcare coverage system. It is provided by the NHIS, which is the single payer of the NHI program. The NHIS provides healthcare insurance to 97% of the population in Korea and the Medical Aid program supports the remaining 3% of the population with the lowest income.40 Whenever healthcare service is provided, the healthcare provider files for reimbursement to the NHIS and this claim is recorded in the NHIS database. The breadth and completeness of the NHIS database used in our study is one of the strengths of our study. In addition, only concrete outcomes such as mortality and length of stay were used as end points.
ICUs in Korea have features that are in stark contrast to ICUs in most developed countries. The vast majority of ICUs in Korea are operated as open units without dedicated intensivists due to the poor reimbursement scheme and late development of intensivists as a subspecialty. Also, respiratory therapists are yet to be acknowledged as a profession and bedside nurses are responsible for the respiratory hygiene of patients.
There are several limitations to consider when interpreting the results of our study. First, due to the administrative nature of the NHIS database used in our study, clinically relevant variables are lacking. Risk adjustment is a critical issue in studies using administrative data that were constructed without consideration for research. As performed in our study, adjusting for comorbidities using indices derived from comorbidities and evaluating concrete outcomes such as in-hospital and long-term mortality may considered to be most optimal when analyzing administrative data. Second, due to the relatively long study period, outcomes may in patients receiving MV for 48 hours or more have been affected by medical advances during the study period. However, considering the long history of lung protective ventilation and that advances in medicine were universally accessible, we believe that the impact of a relatively long study period is likely to be uniform and minimal. Third, admission diagnoses or the nature of the ICU admission (medical vs. surgical) could not be discriminated. However, patients who received MV for less than 48 hours were considered to have low severity of illness and were excluded. According to a comprehensive report on ICUs by the Korean Society of Critical Care Medicine, only 10% of ICU patients were admitted for postoperative management. Therefore, the study population may be mostly severely ill medical patients.
Despite these limitations, our study has some important implications. Our study is the first nationwide population-based study to investigate the relationship between case-volume and in-hospital and long-term mortality in patients who were mechanically ventilated for 48 hours or more. In addition, selection bias was minimized by using the NHIS database, which includes all patients receiving MV for 48 hours or more in Korea.
In conclusion, mechanically ventilated patients (48 hours or more) in centers with higher case volume (> 500 cases/year) showed significantly lower in-hospital and 1-year mortality compared to those in centers with lower case volume (≤ 500 cases/year). Long-term survival was also superior in high-volume centers.

Notes

Disclosure The authors have no potential conflicts of interest to disclose.

Author Contributions

  • Conceptualization: Ryu HG, Lee H, Oh SY.

  • Data curation: Choi S, Jang EJ, Lee J.

  • Formal analysis: Choi S, Jang EJ, Lee J, Kim D.

  • Methodology: Choi S, Jang EJ, Lee J, Kim D.

  • Software: Choi S, Jang EJ, Lee J, Yoo S.

  • Validation: Ryu HG, Oh SY.

  • Writing - original draft: Lee H, Choi S, Jang EJ, Ryu HG.

  • Writing - review & editing: Lee H, Jang EJ, Ryu HG.

References

1. Needham DM, Colantuoni E, Mendez-Tellez PA, Dinglas VD, Sevransky JE, Dennison Himmelfarb CR, et al. Lung protective mechanical ventilation and two year survival in patients with acute lung injury: prospective cohort study. BMJ. 2012; 344:e2124.
crossref
2. Esteban A, Frutos-Vivar F, Muriel A, Ferguson ND, Peñuelas O, Abraira V, et al. Evolution of mortality over time in patients receiving mechanical ventilation. Am J Respir Crit Care Med. 2013; 188(2):220–230.
3. Mehta AB, Syeda SN, Wiener RS, Walkey AJ. Epidemiological trends in invasive mechanical ventilation in the United States: a population-based study. J Crit Care. 2015; 30(6):1217–1221.
crossref
4. Darmon M, Azoulay E, Fulgencio JP, Garrigues B, Gouzes C, Moine P, et al. Procedure volume is one determinant of centre effect in mechanically ventilated patients. Eur Respir J. 2011; 37(2):364–370.
crossref
5. Bach PB, Cramer LD, Schrag D, Downey RJ, Gelfand SE, Begg CB. The influence of hospital volume on survival after resection for lung cancer. N Engl J Med. 2001; 345(3):181–188.
crossref
6. Nallamothu BK, Saint S, Ramsey SD, Hofer TP, Vijan S, Eagle KA. The role of hospital volume in coronary artery bypass grafting: is more always better? J Am Coll Cardiol. 2001; 38(7):1923–1930.
crossref
7. Kahn JM, Goss CH, Heagerty PJ, Kramer AA, O'Brien CR, Rubenfeld GD. Hospital volume and the outcomes of mechanical ventilation. N Engl J Med. 2006; 355(1):41–50.
crossref
8. Durairaj L, Torner JC, Chrischilles EA, Vaughan Sarrazin MS, Yankey J, Rosenthal GE. Hospital volume-outcome relationships among medical admissions to ICUs. Chest. 2005; 128(3):1682–1689.
crossref
9. Moran JL, Solomon PJ. ANZICS Centre for Outcome and Resource Evaluation of the Australian and New Zealand Intensive Care Society. Mortality and intensive care volume in ventilated patients from 1995 to 2009 in the Australian and New Zealand binational adult patient intensive care database. Crit Care Med. 2012; 40(3):800–812.
crossref
10. Glance LG, Li Y, Osler TM, Dick A, Mukamel DB. Impact of patient volume on the mortality rate of adult intensive care unit patients. Crit Care Med. 2006; 34(7):1925–1934.
crossref
11. Cooke CR, Kennedy EH, Wiitala WL, Almenoff PL, Sales AE, Iwashyna TJ. Despite variation in volume, Veterans Affairs hospitals show consistent outcomes among patients with non-postoperative mechanical ventilation. Crit Care Med. 2012; 40(9):2569–2575.
crossref
12. Lee J, Lee JS, Park SH, Shin SA, Kim K. Cohort profile: The National Health Insurance Service-National Sample Cohort (NHIS-NSC), South Korea. Int J Epidemiol. 2017; 46(2):e15.
crossref
13. Quan H, Sundararajan V, Halfon P, Fong A, Burnand B, Luthi JC, et al. Coding algorithms for defining comorbidities in ICD-9-CM and ICD-10 administrative data. Med Care. 2005; 43(11):1130–1139.
crossref
14. Elixhauser A, Steiner C, Harris DR, Coffey RM. Comorbidity measures for use with administrative data. Med Care. 1998; 36(1):8–27.
crossref
15. van Walraven C, Austin PC, Jennings A, Quan H, Forster AJ. A modification of the Elixhauser comorbidity measures into a point system for hospital death using administrative data. Med Care. 2009; 47(6):626–633.
crossref
16. Wunsch H, Wagner J, Herlim M, Chong DH, Kramer AA, Halpern SD. ICU occupancy and mechanical ventilator use in the United States. Crit Care Med. 2013; 41(12):2712–2719.
crossref
17. Esteban A, Anzueto A, Frutos F, Alía I, Brochard L, Stewart TE, et al. Characteristics and outcomes in adult patients receiving mechanical ventilation: a 28-day international study. JAMA. 2002; 287(3):345–355.
18. Halpern NA, Pastores SM, Greenstein RJ. Critical care medicine in the United States 1985–2000: an analysis of bed numbers, use, and costs. Crit Care Med. 2004; 32(6):1254–1259.
crossref
19. Jones J, Rowan K. Is there a relationship between the volume of work carried out in intensive care and its outcome? Int J Technol Assess Health Care. 1995; 11(4):762–769.
crossref
20. Ewart GW, Marcus L, Gaba MM, Bradner RH, Medina JL, Chandler EB. The critical care medicine crisis: a call for federal action: a white paper from the critical care professional societies. Chest. 2004; 125(4):1518–1521.
21. Schechtman D, He JC, Zosa BM, Allen D, Claridge JA. Trauma system regionalization improves mortality in patients requiring trauma laparotomy. J Trauma Acute Care Surg. 2017; 82(1):58–64.
crossref
22. Young MP, Gooder VJ, Oltermann MH, Bohman CB, French TK, James BC. The impact of a multidisciplinary approach on caring for ventilator-dependent patients. Int J Qual Health Care. 1998; 10(1):15–26.
crossref
23. Brook AD, Ahrens TS, Schaiff R, Prentice D, Sherman G, Shannon W, et al. Effect of a nursing-implemented sedation protocol on the duration of mechanical ventilation. Crit Care Med. 1999; 27(12):2609–2615.
crossref
24. Gajic O, Afessa B. Physician staffing models and patient safety in the ICU. Chest. 2009; 135(4):1038–1044.
crossref
25. Kaplan LJ, Shaw AD. Standards for education and credentialing in critical care medicine. JAMA. 2011; 305(3):296–297.
crossref
26. Popovich MJ. Is lower mortality outcome and higher patient volume a genuine clinical relationship or an application of coin-flip statistics? Crit Care Med. 2012; 40(3):995–996.
crossref
27. Needham DM, Bronskill SE, Rothwell DM, Sibbald WJ, Pronovost PJ, Laupacis A, et al. Hospital volume and mortality for mechanical ventilation of medical and surgical patients: a population-based analysis using administrative data. Crit Care Med. 2006; 34(9):2349–2354.
crossref
28. Kanhere MH, Kanhere HA, Cameron A, Maddern GJ. Does patient volume affect clinical outcomes in adult intensive care units? Intensive Care Med. 2012; 38(5):741–751.
crossref
29. Abbenbroek B, Duffield CM, Elliott D. The intensive care unit volume-mortality relationship, is bigger better? An integrative literature review. Aust Crit Care. 2014; 27(4):157–164.
crossref
30. Shahin J, Harrison DA, Rowan KM. Relation between volume and outcome for patients with severe sepsis in United Kingdom: retrospective cohort study. BMJ. 2012; 344:e3394.
crossref
31. Metnitz B, Metnitz PG, Bauer P, Valentin A; ASDI Study Group. Patient volume affects outcome in critically ill patients. Wien Klin Wochenschr. 2009; 121(1-2):34–40.
crossref
32. Esteban A, Ferguson ND, Meade MO, Frutos-Vivar F, Apezteguia C, Brochard L, et al. Evolution of mechanical ventilation in response to clinical research. Am J Respir Crit Care Med. 2008; 177(2):170–177.
crossref
33. Chao CT, Hou CC, Wu VC, Lu HM, Wang CY, Chen L, et al. The impact of dialysis-requiring acute kidney injury on long-term prognosis of patients requiring prolonged mechanical ventilation: nationwide population-based study. PLoS One. 2012; 7(12):e50675.
crossref
34. Lee MJ, Chen CJ, Lee KT, Shi HY. Trend analysis and outcome prediction in mechanically ventilated patients: a nationwide population-based study in Taiwan. PLoS One. 2015; 10(4):e0122618.
crossref
35. Lieberman D, Nachshon L, Miloslavsky O, Dvorkin V, Shimoni A, Zelinger J, et al. Elderly patients undergoing mechanical ventilation in and out of intensive care units: a comparative, prospective study of 579 ventilations. Crit Care. 2010; 14(2):R48.
crossref
36. Go AS, Chertow GM, Fan D, McCulloch CE, Hsu CY. Chronic kidney disease and the risks of death, cardiovascular events, and hospitalization. N Engl J Med. 2004; 351(13):1296–1305.
crossref
37. Metra M, Cotter G, Gheorghiade M, Dei Cas L, Voors AA. The role of the kidney in heart failure. Eur Heart J. 2012; 33(17):2135–2142.
crossref
38. Anavekar NS, McMurray JJ, Velazquez EJ, Solomon SD, Kober L, Rouleau JL, et al. Relation between renal dysfunction and cardiovascular outcomes after myocardial infarction. N Engl J Med. 2004; 351(13):1285–1295.
crossref
39. Lebiedz P, Knickel L, Engelbertz C, Lüders F, Gebauer K, Berdel WE, et al. Impact of preexisting chronic kidney disease on acute and long-term outcome of critically ill patients on a medical intensive care unit. J Nephrol. 2014; 27(1):73–80.
crossref
40. Song SO, Jung CH, Song YD, Park CY, Kwon HS, Cha BS, et al. Background and data configuration process of a nationwide population-based study using the Korean national health insurance system. Diabetes Metab J. 2014; 38(5):395–403.
crossref

SUPPLEMENTARY MATERIAL

Supplementary Fig. 1

Relation between the average annual volume and mortality. (A) Relation between the average annual volume and 1-year mortality after mechanical ventilation for 48 hours or more. (B) Relation between the average annual volume and 3-year mortality after mechanical ventilation for 48 hours or more. (C) Relation between the average annual volume and 5-year mortality after mechanical ventilation for 48 hours or more.
TOOLS
ORCID iDs

Hannah Lee
https://orcid.org/0000-0002-4001-1826

Seongmi Choi
https://orcid.org/0000-0002-9774-6276

Eun Jin Jang
https://orcid.org/0000-0002-9137-9815

Juhee Lee
https://orcid.org/0000-0003-2307-6107

Dalho Kim
https://orcid.org/0000-0001-8658-6679

Seokha Yoo
https://orcid.org/0000-0003-4679-6027

Seung Young Oh
https://orcid.org/0000-0001-8281-2851

Ho Geol Ryu
https://orcid.org/0000-0001-8952-6049

Similar articles