

 PDF
PDF ePub
ePub Citation
 Print
Print


INTRODUCTION
Atopic dermatitis (AD) is a common problem that affects many people from infancy and is caused by a variety of allergens, including environmental factors and foods [12]. AD is accompanied by intractable itching—a common symptom of systemic diseases—including peripheral and central nervous system itch and pruritoceptive components, such as skin dryness [3]. Under the conditions of central sensitization, painful irritation is usually perceived as itching [4]. Severe itching may also cause a secondary infection. As such, itching is a major part of the pain disorder.
Recent studies have suggested that myoblasts can act as antigen-presenting cells in the immune response in muscles, and have been proposed as potential neoantigens in the inflammatory response [567]. Myoblasts are considered active participants in the immune response and secrete or regulate the expression of various cytokines, chemokines, and cell adhesion molecules such as interleukin 6 (Il6), Il2, Cd4, and Cd8 [789]. For example, the airway smooth muscle can modulate immune responses through cell surface receptor-mediated recognition of various molecules such as Il6, Il8, and Il11 [1011].
Allergen-induced mitochondrial dysfunction and increased production of reactive oxygen species (ROS) have been demonstrated in a variety of allergic rhinitis and AD cases [12]. ROS are byproducts of mitochondrial respiration, which play roles in antibacterial immune signaling and phagocyte bactericidal activity [13]. Furthermore, increased mitochondrial numbers and densities were observed in patients with severe asthma [1415]. This is consistent with a previous study demonstrating that allergeninduced early asthmatic responses are associated with glycolysis, Ca2+ binding, and mitochondrial activity [16], and a genome-wide study of allergic rhinitis that suggested the involvement of a mitochondrial pathway [17]. In addition, the development of atopic allergic diseases in children is strongly associated with genetics [18], particularly maternal atopic history [192021]. Furthermore, sequence changes in the mitochondria, which are maternally inherited, are related to the pathogenesis of asthma and AD [1222]. Thus, recent approaches to treating allergic disease target the mitochondria [23], and we anticipate that this may also be an effective strategy for treating AD.
AD is known to be a representative skin disorder, but it also affects the systemic immune response [2425]. In a recent study, myoblasts were shown to be involved in the immune response as antigen presenting cells; however, other roles of muscle cells in AD are poorly understood. In this study, we used a murine model of atopic dermatitis (NC/Nga) that was induced by house dust mite (HDM) extract to measure changes in skeletal muscle. Specifically, we performed a genome-wide transcriptional analysis, microarray analysis, and quantitative reverse transcription-polymerase chain reaction (qRT-PCR) to measure changes in gene expression and determine differences in protein interaction networks. In addition, we measured the mitochondrial DNA copy number to investigate the mitochondrial changes caused by AD induction.
METHODS
Animals and groups
Nine-week-old female NC/Nga mice weighing 23–27 g were purchased from Central Lab Animal Inc. (Seoul, Korea) and allowed to acclimate for 2 weeks before the experiments were initiated. The mice were divided into the AD-induced group and the no treatment group (n = 2/group). Mice were housed in a standard, controlled environment: 22 ± 3℃, 50 ± 10% humidity, 12-h light-dark cycle, and ventilation 10–15 times/h with a wind velocity of 10–20 cm/s. All animal studies were conducted in accordance with the guidelines for animal testing and were approved by the institutional Ethics Committee of the Chung-Ang University, Korea (approval no. 201800012).
Induction of AD
AD was induced using Biostir AD cream containing Dermatophagoides farinae extract (Central Lab Animal Inc.) following the manufacturer's instructions. Briefly, the hair behind the ears and backs of the mice was removed using scissors and a razor, and 150 µl of 4% sodium dodecyl sulfate solution was evenly dispersed on the shaved skin to create a barrier rupture. The solution was dried using a hair dryer (cold air setting) for 2–3 h, and 100 mg of the cream was uniformly applied on the shaved skin. Biostir AD was applied twice per week for 8 weeks. Before the second treatment, the hair was shaved if it had grown back. Mice were sacrificed under anesthesia and blood samples were collected from the abdominal aorta. Gluteal muscles were rapidly removed and washed at least three times in phosphate-buffered saline.
Microarray
The Affymetrix Whole-transcript Expression array was used according to the manufacturer's protocol (GeneChip Whole Transcript [WT] PLUS reagent kit; Affymetrix, Santa Clara, CA, USA). Complementary DNA was reverse-transcribed from the mouse gluteal muscle tissue using the GeneChip WT amplification kit (Affymetrix) following the manufacturer's instructions. The sense complementary DNA was then fragmented and biotinlabeled with terminal deoxynucleotidyl transferase using the GeneChip WT Terminal labeling kit (Affymetrix). Approximately 5.5 µg of labeled DNA target was hybridized to the Affymetrix GeneChip mouse 2.0 ST Array (Affymetrix) at 45℃ for 16 h. Hybridized arrays were washed and stained on a GeneChip Fluidics Station 450 and scanned on a GCS3000 Scanner (Affymetrix). Fluorescent signal values were measured using the Affymetrix GeneChip Command Console software (Affymetrix).
Determination of a differentially expressed genes (DEGs) interaction network
A protein-protein interaction network analysis was performed to determine the protein-protein interactions between DEGs that had been identified by the microarray analysis. DEGs with fold-change values < 1.5 and p-values < 0.05 were analyzed by Search Tool for the Retrieval of Interacting Genes (STRING) version 10.5 (http://www.string-db.org/) using the highest confidence minimum interaction score of 0.900.
Measurement of mitochondrial DNA copy number
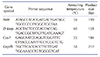
Total DNA was extracted from the mouse gluteal muscle using the QIAamp DNA mini kit (Qiagen, Hilden, Germany) according to the manufacturer's instructions. NADH dehydrogenase 4 (Nd4), D-loop, cytochrome c oxidase I (Cox1), and glyceraldehyde 3-phosphate dehydrogenase (Gapdh) were amplified by realtime PCR using a LightCycler 2.0 (Roche, Mannheim, Germany). Each 10-µl reaction contained 2 mM MgCl2, 0.5 µM of each primer, 1x Light-Cycler DNA Master SYBR Green I (Roche), and 15 ng of DNA template. All primer sequences are listed in Table 1. The reaction conditions were as follows: denaturation (95℃ for 10 min), amplification for 35 cycles (95℃ for 10 sec; 62℃ for 10 sec; 72℃ for 10 sec), a melting curve program (65℃ to 95℃ with a heating rate of 0.1℃/sec), and a cooling step (40℃). The results are expressed as the ratio of mtDNA to gDNA and compared as previously described [26].
Raw data preparation and statistical analysis
The data were summarized and normalized with the robust multi-average method implemented in Affymetrix Power Tools. Gene levels were used to perform the DEG analysis. Statistically significant fold changes were determined using the local pooled error test. The false discovery rate (FDR) was controlled using the Benjamini-Hochberg algorithm. For each DEG set, hierarchical cluster analysis was performed using complete linkage and Euclidean distance as a measure of similarity. Gene-Enrichment and Functional Annotation analysis for the list of significant genes was performed using Gene Ontology (GO; http://geneontology.org) and Kyoto Encyclopedia of Genes and Genomes (KEGG; http://kegg.jp). All data analysis and visualization of DEGs was conducted using R 3.0.2 (www.r-project.org). Statistical significance between the control group and experimental group was determined using Student's t-test, Bonferroni correction, and the FDR. In all cases, p-values < 0.05 were considered significant.
RESULTS
Measurement of gene expression changes in skeletal muscle from the murine HDM-induced AD model by microarray analysis
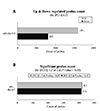
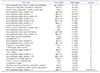
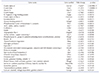
Microarray analysis using mouse gluteal muscle total mRNA was performed for the control and the AD model groups. A total of 35,240 transcripts were detected, and 2,394 DEGs were detected between the two conditions—1591 genes were up-regulated and 803 were down-regulated (FC > 1.5) (Fig. 1A). In comparing the two groups, 421 genes were significantly dysregulated with FC values > 1.5 and p-values < 0.05, and 416 genes were significantly dysregulated with FC values > 2 and p-values < 0.05 (Fig. 1B). The significantly dysregulated 421 DEGs are listed in Supplementary Table 1. The top 30 differentially expressed up-regulated and down-regulated genes between the two conditions and their pvalues are listed in Tables 2 and 3, respectively.
KEGG analysis of the significant pathways altered in AD
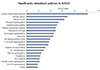
The significantly regulated pathways were determined according to the functions and interactions of DEGs based on the KEGG database. The 2,394 DEGs significantly stimulated by the AD-like condition were correlated with the Database for Annotation, Visualization, and Integrated Discovery and the KEGG pathway mapper to determine the pathways stimulated by AD-like. Based on KEGG pathway analysis, 136 signaling pathways were identified, including cytokine-cytokine receptor interactions, metabolic, nuclear factor (NF)-kappa B signaling, chemokine signaling, B cell receptor signaling, cell adhesion molecules, and T cell receptor signaling (p < 0.001). The top 20 significantly regulated pathways are shown in Fig. 2, including cytokine-cytokine receptor interactions, metabolic pathways, cancer-associated pathways, NF-kappa B signaling, chemokine signaling pathways, leukocyte transendothelial migration, hematopoietic cell lineage, B cell receptor signaling pathway, tuberculosis, cell adhesion molecules, T cell receptor signaling, phagosome, regulation of actin cytoskeleton, Th17 cell differentiation, phosphoinositide-3-kinase (PI3K)-Akt signaling pathway, toxoplasmosis, human T-cell lymphotropic virus type I infection, nucleotide-binding oligomerization domain (NOD)-like receptor signaling pathway, Janus kinase-signal transducers and activators of transcription (Jak-STAT) signaling pathway, and measles.
The top 30 pathways except for disease-related pathways, and the top 10 genes for each pathway with their respective p-values are shown in Supplementary Table 2. The significantly regulated pathways included cytokine-cytokine receptor interaction, metabolic, NF-kappa B signaling, chemokine signaling, leukocyte transendothelial migration, hematopoietic cell lineage, B cell receptor signaling, cell adhesion molecules, T cell receptor signaling, phagosome, regulation of actin cytoskeleton, Th17 cell differentiation, PI3K-Akt signaling pathway, NOD-like receptor signaling pathway, Jak-STAT signaling pathway, primary immunodeficiency, osteoclast differentiation, antigen processing and presentation, Th1 and Th2 cell differentiation, intestinal immune network for immunoglobulin A production, endocytosis, natural killer cell-mediated cytotoxicity, mitogen-activated protein kinase signaling pathway, Toll-like receptor signaling pathway, cardiac muscle contraction, adrenergic signaling in cardiomyocytes, hypertrophic cardiomyopathy, cyclic adenosine monophosphate signaling pathway, tumor necrosis factor signaling pathway, and calcium signaling (p < 0.001).
Specific to cytokine-cytokine receptor interaction pathways, the analysis showed that Cxcl13, interleukin 2 receptor gamma chain (Il2rg), Cd4 , Il7r, chemokine ligand 5 (Ccl5), lymphotoxin B (Ltb), Ccl22 , Lep, Cd27, and chemokine receptor 7 (Ccr7) were significantly altered in the AD model (p = 2.7E-36). Regarding metabolic pathways, the following genes were significantly altered: UDP-glucose ceramide glucosyltransferase (Ugcg), phosphoenolpyruvate carboxykinase 1 cytosolic (Pck1), ADP-ribosyltransferase 2b (Art2b), mannosidase 1 alpha (Man1a), amine Aoc3, phospholipase A2 group 7 (Pla2g7), heparinase (Hpse), phospholipase C gamma 2 (Plcg2), inositol polyphosphate-4-phosphatase type 2 (Inpp4b), and Fasn (p = 7.5E-28).
GO function analysis of the significant pathways altered in AD
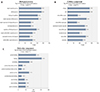
GO function analysis was used to determine the main gene functions affected by HDM treatment. An interaction network of significant GO terms was assembled into a GO map to determine the prominent functional categories. The GO functions of the DEGs were determined according to categories that included biological process, molecular functions, and cellular components. In the biological process category, single-organism, cellular, biological regulation, single-organism cellular, single-organism developmental, developmental, single-multicellular organism, anatomical structure development, and multicellular organismal processes were identified (Fig. 3A). In the cellular component category, extracellular, organelle, membrane-bound, and cytoplasmic function were identified (Fig. 3B). In the molecular component category, protein binding, protein dimerization activity, catalytic activity, anion and cation binding, and metal ion binding functions were identified (Fig. 3C).
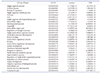
The 30 significantly regulated pathways, their p-values, and FDRs are listed in Table 4. Single-organism process, cellular process, biological regulation, single-organism cellular process, cell part, cell, single-organism developmental process, extracellular region, developmental process, organelle, extracellular region part, regulation of biological process, single-multicellular organism process, anatomical structure development, protein binding, multicellular organismal process, binding, multicellular organismal development, system development, membrane-bounded organelle, response to stimulus, small molecule metabolic process, lipid metabolic process, regulation of multicellular organismal process, regulation of cellular process, organ development, negative regulation of biological process, intracellular part, muscle structure development, and cytoplasmic part were significantly altered in response to HDM treatment (p < 0.001).
Correlation of DEGs in interaction network analysis
Based on the GO and KEGG pathway analysis, the protein interaction analysis was performed to determine the hub genes involved in HDM-induced AD-like in the NC/Nga mouse. We used the STRING database of interactions to reveal a putative protein association network based on the microarray data [27]. Network analysis was performed on 187 significant DEGs, 98 of which were found in STRING (p < 0.01, |FC| < 1.5). The interaction relationship network of genes is shown in Supplementary Fig. 1. The hub genes, Cxcl5, Cxcr13, Ccl5, Ccl21c, Ccr5, Ccr7, actinin alpha 2 (Actn2), actin alpha cardiac muscle 1 (Actc1), troponin I skeletal slow 1 (Tnni1), tropomyosin 3 gamma (Tpm3), myosin light polypeptide 3 (Myl3), myosin heavy polypeptide 7 cardiac muscle beta (Myh7), myosin binding protein C slow-type (Mybpc1), troponin T1 skeletal slow (Tnnt1), troponin C cardiac/slow skeletal (Tnnc1), Cd3d, Cd3e, Cd3g, Cd4, Cd74, histocompatibility 2 class II antigen A alpha (H2-aa), H2-ab1, H2-dma, cathepsin S (Ctss), and protein tyrosine phosphatase non-receptor type 6 (Ptpn6), had more than 10 interactions and were located in the center of the network. The chemokines, Cxcl5, Cxcr13, Ccl5, Ccl21c, Ccr5, and Ccr7, were included [28], as well as genes involved in muscle contraction, such as Actn2, Actc1, Tnni1, Tpm3, Myl3, Myh7, Mybpc1, Tnnt1, Tnnc1, and Tnni1 [29]. The immune and inflammatory response-associated genes, Cd3d, Cd3e, Cd3g, Cd4, H2-aa, H2-ab1, Cd74, H2-dma, Ctss, and Ptpn6, were also included in the network [30].
Mitochondrial function-related gene effects in response to AD
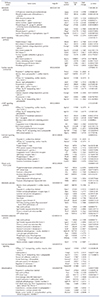
Based on the KEGG and GO analyses shown in Supplementary Tables 2 and Table 4, respectively, the pathways involved in mitochondrial metabolism, such as calcium signaling pathway (KEGG:04020), cardiac muscle contraction (KEGG:04260), tricarboxylic acid cycle (KEGG:0020), oxidation-reduction process (GO:0055114), calcium-mediated signaling (GO:0019722), and mitochondrion (GO:0005739) were significantly stimulated by AD-like. The DEGs in these pathways involved in mitochondrial function are listed in Table 5. Phospholipase C, delta 4 (Plcd4), Plcg2, Tnnc1, PTK2 protein tyrosine kinase 2 beta (Ptk2b), and protein kinase C beta (Prkcb), which are associated with calcium signaling, were significantly stimulated (FDR:0.001338772) by KEGG analysis. For cardiac muscle contraction, Atp2a2, Tnnc1, Tpm2, Tpm3, Tpm4, Actc1, Myh2, Myh3, Myh4, and Myh7 were also significantly stimulated (FDR:2.86478E-09). In the tricarboxylic acid cycle, Pck1, pyruvate dehydrogenase beta (Pdhb), pyruvate carboxylase (Pcx), ATP citrate lyase (Acly), isocitrate dehydrogenase 2 (Ldh2), and dihydrolipoamide dehydrogenase (Dlb) were significantly stimulated (FDR:0.001761341). Acetylcoenzyme A acyltransferase 2 (Acaa2), solute carrier family 25 member 25 (Slc25a25), cytochrome c oxidase subunit VIIIa (Cox8a), cytochrome b-245, beta polypeptide (Cybb), Fasn, mitochondrial amidoxime reducing component 1 (Marc1), extracellular superoxide dismutase 3 (Sod3), Acly, and uncoupling protein 1 (Ucp1), which are mitochondrial metabolism-related genes, were significantly stimulated based on the microarray analysis. The pathways related to mitochondrial function were selected based on previous studies [3132].
Mitochondrial DNA copy number
We performed mitochondrial copy number analysis via qRT-PCR using gluteal muscle isolated from the NC/Nga mice. Mitochondrial copy number measurements were performed three times and averaged. Nd4, D-loop, and Cox1 of mtDNA and 18S of gDNA were intercompared. The results revealed that mtDNA copy numbers were not significantly different between the two groups (p < 0.01) (data not shown).
DISCUSSION
Immunoglobulin E measurements were performed to confirm that HDM-induced AD-like. We found that the AD-like group had increased immunoglobulin E levels compared to the control group (data not shown), which was consistent with a previous study indicating that HDM induces AD [33]. In addition, we found that the expression of immune response-associated genes, cytokines, immunoglobulins, and CDs, were up-regulated in the microarray analysis. Thus, HDM successfully induced AD-dependent responses in the gluteal muscle.
Microarray analysis was performed to determine mRNA expression changes in response to HDM-induced AD-like, which identified 421 genes and 136 pathways that were significantly altered. The top 30 significantly regulated pathways identified by KEGG and GO analyses primarily identified immune response-related genes and pathways. Production of cytokines and responses to these molecules are important for regulating immune and inflammatory processes. Chemokines (Ccl5, Ccl8, Ccl22, Cxcl12, Cxcl13, Ccr7) and interleukins (Il7r, Il2rg) were significantly up-regulated in response to AD-like, which is consistent with previous studies [3435]. In addition, we showed that AD-related phenotype genes, Il18, Il4ra, Il13ra1, Tlr1, Tlr7, Tlr8, Tlr13, Fcer1a, Fcer2a, and Spink5l were upregulated in the microarray analysis [363738]. Hspa1a, Stat1, Adam13, and Adam23 were also upregulated and may be useful inflammatory markers [39404142]. We have also studied other genes considered to play integral roles in AD-like. We predicted Igh-v3609n, Glycam1, Igkv5-48, Igkv6- 17, Igkj1, Apol7c, Trac, Cdh4, Thrsp, Gys2, and Lgals12 to play an important role in the AD pathway by microarray and protein-protein interaction network analysis.
KEGG and GO pathway analyses showed that the pathways represented not only immune response processes but also mitochondrial function. We identified the pathways and genes affected by mitochondria in atopic manifestations and provided a list of mitochondrial-related genes that could be targeted for future treatment of AD-like symptoms. The KEGG pathway analysis showed that the pathways related to calcium signaling, cAMP signaling pathway, cardiac muscle contraction, and citrate cycle were significantly stimulated. The GO pathway analysis showed that the significantly altered genes were related to metabolic process, oxidation-reduction, calcium-mediated signaling, and mitochondrion. Changes in calcium signaling and mitochondrial function-related signaling pathways indicated that AD induction was associated with altered mitochondrial function. Genes involved in the metabolic pathway were Lep, Fasn, Aoc3, Acly, Pck1, Ucp1 and ATPase Na+/K+ transporting beta 1 polypeptide (Atp1b1). Especially, Acly, Pck1, Ucp1, Atp1b1 also have an essential role in the ATP synthase process [43444546].
We performed mtDNA copy number measurements to quantitatively observe the mitochondrial changes in HDM-induced AD-like group via qRT-PCR. As the number of mitochondria increases, mitochondrial functional outputs such as oxygen consumption and ATP production increase. Therefore, it is necessary to determine the function of individual mitochondria by dividing functional output by number of mitochondria. Our results demonstrated that mitochondria copy number did not change in the AD-like group compared to that of the control group. The changes in mitochondrial functional genes are only expected and a numerical increase does not occur.
We performed protein interaction network analysis to identify the hub genes in 187 DEGs, which were screened in GO and KEGG analysis. The protein interaction network of the target gene can reveal the protein-protein interaction of HDM-induced AD-like in NC/Nga mice. Hub proteins identified were included in the chemokine family, muscle contraction process, inflammatory response, and immune response. Several hub proteins in the protein interaction networks might be associated with an AD-like-related pathway, such as Cxcl13, Cd4, Il7, and CCr7 in cytokine interactions (Supplementary Fig. 1).
We identified the association between AD and mitochondrial functions at the gene level and determined the stimulated genes and pathways. In summary, our study deepens our understanding of the genome-wide transcriptional changes of HDM-induced AD-like symptoms in the skeletal muscle of NC/Nga mice, providing to the discovery of genes that could be used as AD clinical biomarkers.
 XML Download