

 PDF
PDF Citation
 Print
Print


BACKGROUND
METHODS
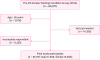
Participants
Measurements
Independent variable: the quality of a direct supervisor's behavior
Dependent variable: depressive mood
Control variables
• Age: Age was classified into 5 groups: 15–24, 25–34, 35–44, 45–54, and 55–64 years.
• Education: Education level was categorized into the following 3 groups: middle school or below, high school, and college or above.
• Health condition: Health condition was evaluated by the question, “How is your health in general?” with 5 response options: very good, good, fair, bad, and very bad. Health condition was further classified into the following 2 groups: healthy (very good, good, or fair) and unhealthy (bad or very bad).
• Psychological factors [21] such as low job satisfaction, job stress, high mental burden of the job, low job autonomy, effort-reward imbalance, and low colleague support and work environment factors [22], such as long working hours, shift work, and night work were reported in previous studies as occupational risk factors for depression.
• Satisfaction with working conditions: Satisfaction with working conditions was evaluated by the question, “Overall, what do you think about the working conditions you work in?” with 4 response options: very satisfied, satisfied, not very satisfied, and not at all satisfied. Working condition satisfaction was classified into the following 2 groups: satisfied (very satisfied or satisfied) and unsatisfied (not very satisfied or not at all satisfied).
• Employment status: Employment status was categorized into the following 3 groups: regular workers, temporary workers, and day laborers.
• Night working status: Night working status was assessed by the question, “How many days a month do you work at night, for at least 2 hours between 10 pm and 5 am?" Night working status was categorized into the following 2 groups: yes (at least one day) and no (never).
• Long working days: Long working days was assessed by the question, “How many days a month do you work more than 10 hours a day?" Long working days was categorized into the following 3 groups: 0 (never), 1–9, and ≥ 10.
• Shift working: Shift working status was classified as yes/no according to the answer of “Do shift work,” which is a sub-question of “What is your work pattern?”
• Income level: Income level was assessed by monthly average income. Income level was classified into 4 groups: < 1, 1–1.99, 2–2.99, and ≥ 3 (/1*106 KRW/month).
• Job stress: Job stress was evaluated by the question, “Do you experience stress in your work?” with 5 response options: always, most of the time, sometimes, rarely, and never. Job stress was classified into the following 2 groups: yes (always, most of the time, or sometimes) and no (rarely or never).
• Colleague support: Colleague support was evaluated by the question, “Do your colleagues help and support you?” with 5 response options: always, most of the time, sometimes, rarely, and never. Colleague support was further classified into the following 2 groups: yes (always, most of the time, or sometimes) and no (rarely or never).
• Effort-Reward Imbalance (ERI): ERI was evaluated by the item, “I am getting adequate reward for the work I do” with 5 response options: strongly agree, agree, neither agree nor disagree, disagree, and strongly disagree. ERI was classified into the following 2 groups: balanced (strongly agree, agree, or neither agree nor disagree) and imbalanced (disagree or strongly disagree).
• Mental burden of the job: Mental burden of the job was assessed by the question, “If you make mistakes in your work, could it cause the following situation?" with 5 sub-questions: i) Physical injury to you; ii) Physical injury to others; iii) Delay work; iv) Give stress to others; and v). Financial loss to your company. Each of the 5 questions is scored on a 5-point Likert scale from 1 (= always) to 5 (= never). Scores are summated, with the continuous variable ranging from 5 to 25. Lower scores indicate higher mental burden of the job.
• Job autonomy: Job autonomy was assessed by the question, “Are you able to choose or change?" with 3 sub-questions: i) Your order of tasks; ii) Your methods of work; and iii) Your speed or rate of work. Each of the 3 questions is scored as 1 (= yes) to 2 (= no). Scores are summated, with the continuous variable ranging from 3 to 6. Lower scores indicate higher job autonomy.
• Occupational group: The 10 categories of occupational groups (managers, professionals, technicians and associated professionals, white-collar workers, service workers, sales workers, skilled agriculture, forestry and fisheries workers, craft and related trades workers, plant/machine operators and assemblers, and simple laborers) were re-categorized into 5 groups: managers/professionals, white-collar workers, service/sales workers, blue-collar workers, and simple laborers.
Statistical analysis
RESULTS
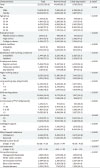
Table 1
General and occupational characteristics of the participants according to depressive mood
![]()
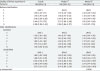
Table 2
Distribution of the quality of direct supervisor's behavior according to depressive mood

![]()
Table 3
ORs for likely depression according to the quality of direct supervisor's behavior stratified by satisfaction with working conditions
![]()
 XML Download