

 PDF
PDF ePub
ePub Citation
 Print
Print


INTRODUCTION
ST-segment elevated myocardial infarction (STEMI) is the catastrophic consequence of an acute thrombotic occlusion of a coronary artery, and a leading cause of cardiac death across the world (1). Serum high-sensitivity troponin T (hs-TnT) levels exhibit a biphasic kinetic profile of release into the blood following a STEMI (2), have demonstrated a prognostic value in determining adverse clinical outcomes after a STEMI (345), and are routinely tracked as a useful biomarker for monitoring myocardial injury.
Cardiac magnetic resonance (CMR) is a well-established non-invasive modality used to image myocardial ischemia (6) as well as acute myocardial infarction (AMI) (78). Infarct size and the presence of microvascular obstruction (MVO) characterized by CMR, as well as the clinical outcomes, are associated with the level of hs-TnT (9). Stress computed tomography myocardial perfusion imaging (CT-MPI) is an alternative method to CMR for detecting myocardial ischemia (10). In contrast to static CT-MPI, dynamic CT-MPI is a novel approach for quantitative evaluation of myocardial circulation (1112). Myocardial blood flow (MBF) quantified by dynamic CT-MPI has been shown to be useful in diagnosing flow-limiting coronary stenosis (131415). However, the clinical value of the quantitative parameters from dynamic CT-MPI in patients with STEMI has not yet been explored. We hypothesized that those parameters might be associated with the severity of acute myocardial injury. Therefore, we aimed to study the association between quantitative myocardial perfusion parameters generated from dynamic CT-MPI and hs-TnT level as well as left ventricle (LV) function.
MATERIALS AND METHODS
Patient Population
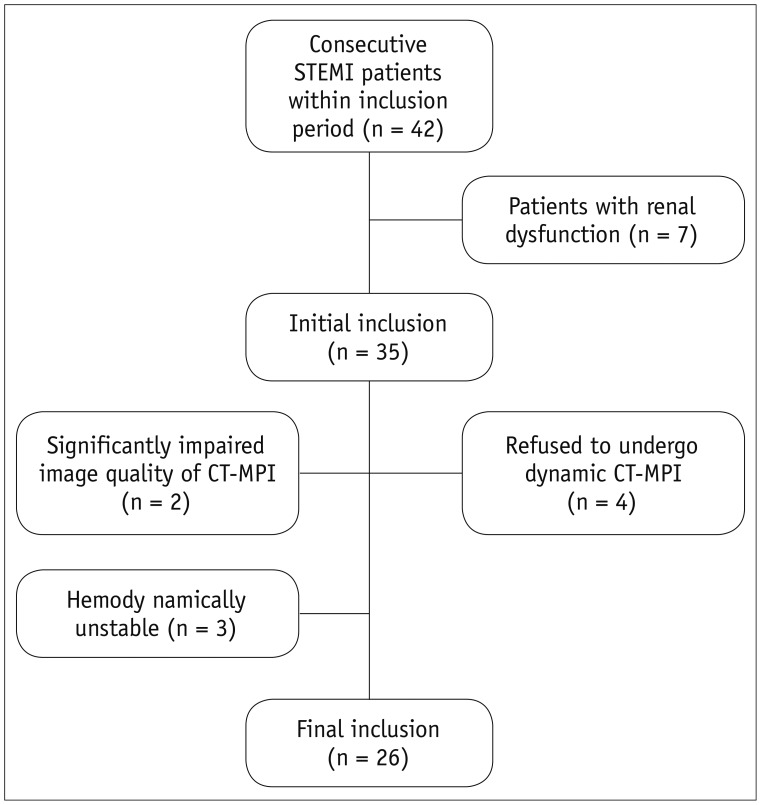
Between November 2017 and February 2018, thirty-five consecutive patients with STEMI and successful reperfusion treatment that had occurred within 1 week of their infarction were consecutively enrolled from the cardiology service. Inclusion criteria were: 1) patients with STEMI confirmed by electrocardiogram and serum biomarkers, for whom percutaneous coronary intervention (PCI) of the culprit lesions had been successfully performed; 2) patients who were hemodynamically stable. Exclusion criteria were: 1) patients who were hemodynamically unstable; 2) patients with renal dysfunction; 3) patients who refused to undergo dynamic CT-MPI; 4) patients whose CT-MPI image quality was significantly impaired; 5) patients with previous history of chronic myocardial infarction (MI); 6) patients with previous history of any type of cardiomyopathy or valvular disease. All patients gave written informed consent, and the study protocol was approved by the hospital ethics committee.
Two patients were excluded because of impaired image quality. Three hemodynamically unstable patients and four patients who refused to undergo CT-MPI were also excluded from the study (Fig. 1). This resulted in 26 patients (mean age, 61 ± 9.8 years; age range, 40–74 years; 21 males [mean age, 59.2 ± 9.1 years, age range, 40–71 years]; and 5 females [mean age, 64.4 ± 10.5 years, age range, 45–74 years; p = 0.41]) were included in our study.
All patients followed up at the 6-month mark and underwent echocardiography to determine their mid-term LV function. Major adverse cardiovascular events (MACE) were also followed up on at an outpatient clinic visit at 6 months. MACE was defined as all-cause mortality, unplanned hospitalization due to heart failure caused by MI, and unplanned hospitalization for chest pain leading to urgent revascularization.
CT-MPI Protocol
A 192-slice third-generation dual-source CT (SOMATOM Force, Siemens Healthineers, Forchheim, Germany) equipped with a fully-integrated circuit detector system (Stellar Infinity, Siemens Healthineers) was employed for CT-MPI acquisition. A cardiac calcium score CT was first performed to calculate the calcification burden of each epicardial vessel. In addition, calcium score images were used to determine the scan range of dynamic CT-MPI in order to precisely cover the entire LV. A bolus of contrast media (50 mL; iopromide, 370 mg iodine/mL, Bayer Healthcare, Berlin, Germany) was injected into the antecubital vein at a rate of 6 mL/s, followed by a 40 mL saline flush using a dual-barrel power injector (Tyco, Cincinnati, OH, USA). CT-MPI was initiated 5 seconds after contrast injection, using an axial scan mode triggered at 250 ms after the R wave (end-systolic). Imaging of the complete LV required a shuttle-mode acquisition technique. By moving the table back and forth after each acquisition, 2 series of images were collected that together covered the entire myocardium. Depending on heart rates, scans were performed every second or third heart cycle, resulting in a series of 10–15 phases acquired over a period of approximately 31 seconds. The acquisition parameters of CT-MPI are listed as follows: collimation = 96 × 0.6 mm, reconstructed slice thickness = 3 mm, reconstructed slice interval = 2 mm, rotation time = 250 ms, tube voltage = 70 kVp and effective current = 250 mAs.
CT-MPI Analysis
The CT-MPI data was reconstructed using a dedicated kernel for reduction of iodine beam-hardening artifacts (Qr36) and analyzed using a CT-MPI software package (Myocardial perfusion analysis, VPCT body, Siemens Healthineers). Motion correction was applied in necessary cases to correct for breathing-related misregistration of the LV. For quantification of MBF, the influx of contrast medium was measured using arterial input function (AIF). The AIF was sampled in the descending aorta by including both cranial and caudal sections. For quantification of MBF and other parameters including myocardial blood volume (MBV), extravascular volume (EVV), time to peak (TTP), and tissue transit time (TTT), the myocardial time attenuation curves were coupled with the AIF using a hybrid deconvolution model (16).
The fusion image of coronary vasculatures and a perfusion map was used to determine the individualized territories of coronary arteries and assign segments to infarction and reference territories. For quantitative analysis, the region of interest (ROI) was manually placed to sample the MBF and other parameters on a segment base according to the 17-segment model (17). The ROIs were manually drawn to cover the entire area of the visible perfusion defect on a color-coded map within the segment, or to cover the entire segment when the perfusion defect was visually absent. The short-axis view of the fused myocardial color-coded map was used for quantification of all segments except the apical segment, which was evaluated on a vertical long-axis view. The mean value of different quantitative parameters, including MBF, MBV, EVV, TTP, and TTT, were measured for each segment of both infarction territories and reference territories. Since CT-MPI studies have demonstrated that the absolute values of myocardial perfusion parameters might vary among patients (1218), we therefore also measured the ratios of these parameters within infarction territories to the parameters within reference territories. MBFratio was defined as the ratio of the mean MBF value of all infarction segments to the mean MBF value of all reference segments. MBVratio, EVVratio, TTPratio, and TTTratio were defined similarly.
Two cardiovascular radiologists (observer 1 with 10 years of experience in cardiac imaging and observer 2 with 6 years of experience in cardiac imaging) who were blinded to clinical histories independently analyzed all CT-MPI data. Forty ROIs from infarction territories and 40 ROIs from reference territories were randomly selected to test the intra-observer and inter-observer variabilities for the two observers. The mean values of quantitative parameters measured by the two observers were used for analysis. Any disagreement between the two observers was resolved by consensus.
Biochemical Methods
Blood samples for hs-TnT measurements were obtained at the time of admission, and again 6, 12, 24, 48, and 72 hours after the onset of symptoms. The hs-TnT levels were determined with sandwich immunoassays using the Cobas Analytics e601 Immunoanalyzer (Roche Diagnostics, Mannheim, Germany) according to the manufacturer's instructions. According to the manufacturer, the limit of the blank with this assay was 3 ng/L and the limit of detection was 5 ng/L. The coefficient of variation was < 10% at 14 ng/L, the 99th percentile upper reference limit for healthy subjects. The peak level was determined as the highest value.
Echocardiography
All subjects underwent two-dimensional transthoracic echocardiographic examination within 3 days of hospitalization and again 6 months after discharge using an Acuson sequoia 512 ultrasound system (Siemens Healthineers) with a 3.5-MHz transducer. LV end-systolic volume and LV end-diastolic volume were measured, and left ventricular ejection fraction (LVEF) was calculated using the modified Simpson's biplane technique (19). Volumetric measurements require manual tracing of the endocardial border. The papillary muscles were excluded from the myocardium in the LV mass calculation. The basal border of the LV cavity area was delineated by a straight line connecting the mitral valve insertions at the lateral and septal borders of the annulus on the 4-chamber view and the anterior and inferior annular borders on the 2-chamber view.
Statistical Analysis
Statistical analysis was performed using commercial statistical software (MedCalc Statistical Software version 15.2.2, MedCalc Software bvba, Ostend, Belgium). Quantitative variables were expressed as the mean ± standard deviation. A one-sample Kolmogorov-Smirnov test was used to check the assumption of normal distribution. Intra-observer and inter-observer agreements of dynamic CT-MPI-derived parameters and LVEF were tested for intraclass correlation coefficients (ICCs). The correlations between CT-MPI-derived parameters and hs-TnT levels, as well as the correlations between CT-MPI-derived parameters and LVEF were assessed by Pearson correlation when the data were normally distributed or by the Spearman's test when the data were not normally distributed. A two-tailed p < 0.05 was considered statistically significant.
RESULTS
Clinical Characteristics
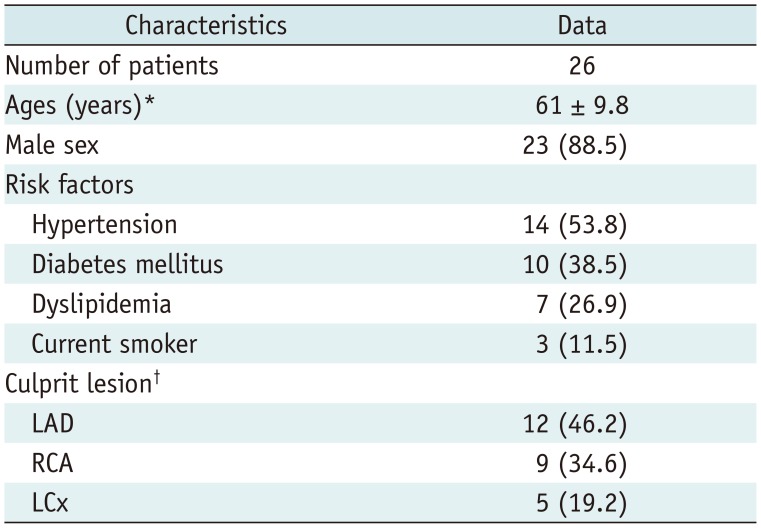
The mean dose length product of dynamic CT-MPI was 225 ± 78.4 mGy·cm (range, 100.2–422.5 mGy·cm) and mean effective dose was 3.2 ± 1.1 mSv (range, 1.4–5.9 mSv). Dynamic CT-MPI was performed 3.2 ± 1.5 days after emergent PCI whereas echocardiography was performed 2.4 ± 1.2 days after emergent PCI. The average acquisition time for dynamic CT-MPI was 15.8 ± 3.4 min. Detailed demographic data is given in Table 1.
Quantitative Parameters Derived from Dynamic CT-MPI in Infarcted Territories and Reference Territories
Of the 26 subjects, 427 segments were included in the final analysis (15 segments were excluded due to incomplete coverage or severely impaired image quality). The inter-observer and intra-observer agreement for CT-MPI-derived parameters were concordant (ICC > 0.9 for all parameters, p < 0.001) (Supplementary Tables 1, 2 in the online-only Data Supplement). Overall, infarcted territories had significantly lower MBF (30.5 ± 7.4 mL/min/100 mL versus 73.4 ± 8.1 mL/min/100 mL, p < 0.001) and MBV (2.8 ± 0.9 mL/100 mL versus 4.2 ± 1.1 mL/100 mL, p = 0.044) values compared with the reference territories (Table 2, Figs. 2, 3). In contrast, there were no significant differences in other CT-MPI-derived indices (EVV, TTT, TTP) between infarcted territories and reference territories (Table 2).
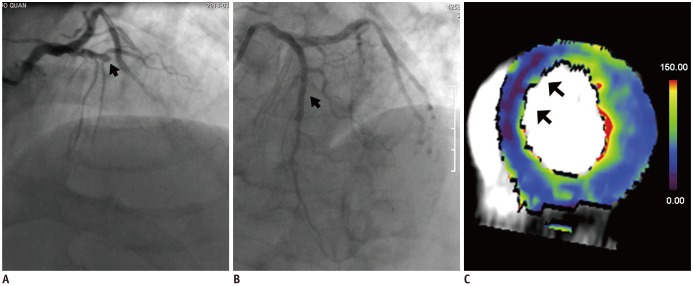
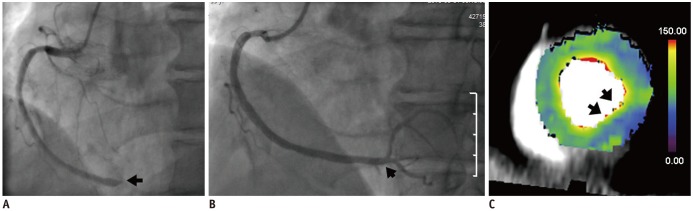
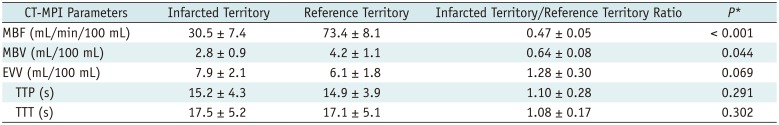
Fig. 2
Representative case of severely reduced MBF and high peak hs-TnT level in 62-year-old male STEMI patient.
A. ICA showed occlusion of proximal LAD (arrow). B. PCI was performed to restore patency to lumen (arrow). C. Color-coded fusion image of short-axis view derived from dynamic CT-MPI showed dramatically reduced MBF of middle anterior and middle anteroseptal segment (mean MBF = 21 mL/100 mL/min) (arrows). Mean MBF of reference territory was 68 mL/100 mL/min. Peak hs-TnT level was 32.6 µg/L. hs-TnT = high-sensitivity troponin T, ICA = invasive coronary angiography, LAD = left anterior descending artery, MBF = myocardial blood flow, PCI = percutaneous coronary intervention
![]()
Fig. 3
Representative case of mildly reduced MBF and low peak hs-TnT level in 67-year-old male STEMI patient.
A. ICA showed occlusion of distal RCA (arrow). B. PCI was performed to restore patency to lumen (arrow). C. Color-coded fusion image of short-axis view derived from dynamic CT-MPI showed mildly reduced MBF of mid inferior segment (mean MBF = 45 mL/100 mL/min) (arrows). Mean MBF of reference territory was 74 mL/100 mL/min. Peak hs-TnT level was 5.4 µg/L. RCA = right coronary artery
![]()
Table 2
Mean Values of Dynamic CT-MPI-Derived Parameters in Infarcted Territory and Reference Territory
![]()
Correlation of hs-TnT Levels and LVEF with CT-MPI-Derived Parameters
The relation between hs-TnT levels and CT-MPI-derived parameters was tested at different time points as shown in Table 3. The CT-MPI-derived MBF was significantly inversely correlated with peak hs-TnT level and hs-TnT levels at 12 and 24 hours (Table 3). Specifically, MBF showed the strongest correlation with the level of peak hs-TnT (r = −0.682, p < 0.001). MBV showed a mild-to-moderate correlation with the level of peak hs-TnT as well as hs-TnT at the time of admission (r = −0.437, p = 0.026; r = −0.393, p = 0.047, respectively); whereas EVV, TTP, and TTT did not show significant correlation with hs-TnT levels (p > 0.05 for all).
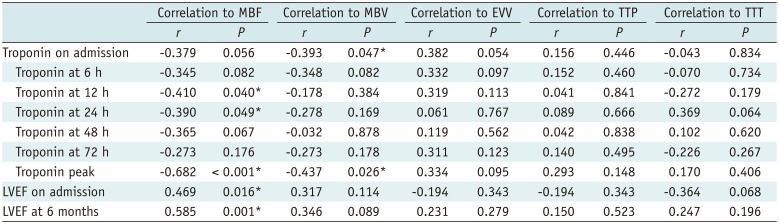
Table 3
Correlation Analysis of hs-TnT Levels and LVEF with Dynamic CT-MPI-Derived Parameters
![]()
As for the relationship between CT-MPI-derived parameters and LVEF evaluated by echocardiography at the time of admission, only MBF was significantly correlated with LVEF (r = 0.469, p = 0.016) (Fig. 4). Other CT-MPI-derived parameters showed nonsignificant correlation with LVEF (p > 0.05 for all) (Table 3). Similar findings were observed for the correlation of hs-TnT levels and LVEF with various parameter ratios (Table 4).
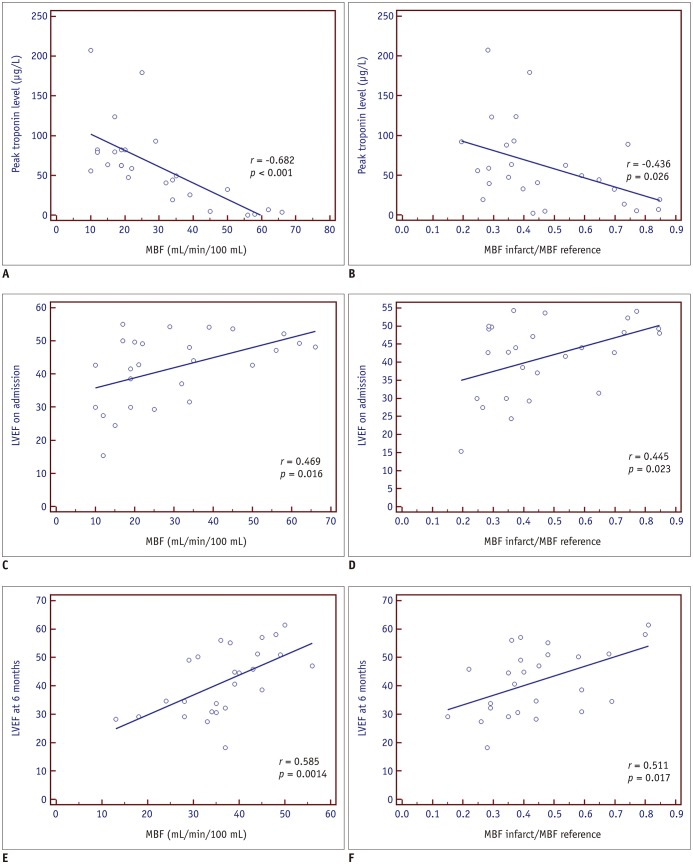
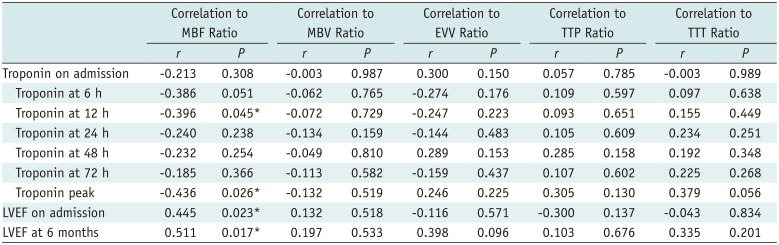
Fig. 4
Correlation of peak hs-TnT level and LVEF (at time of admission and at 6 months) with MBF and MBFinfarct/MBFreference.
Both MBF and MBFinfarct/MBFreference were shown to inversely correlate with peak hs-TnT level and proportionally correlate with LVEF. LVEF = left ventricular ejection fraction
![]()
Table 4
Correlation Analysis of hs-TnT Levels and LVEF with Dynamic CT-MPI-Derived Parameter Ratios†
![]()
Regarding the mid-term follow-up, the mean LVEF at 6 months was 40.9 ± 8.6%, while more than half (65.4%, 17/26) of patients had reduced LV function (LVEF < 50%). Similarly to the above short-term results, only MBF and MBFratio were significantly correlated with LVEF at the 6-month mark (r = 0.585, p = 0.001) whereas other parameters failed to show any correlation (Tables 3, 4). There was one major adverse cardiac event (MACE; acute in-stent thrombosis at 3 days after PCI) observed during the follow-up.
DISCUSSION
The major finding of the present study is that MBF quantified by dynamic CT-MPI is significantly inversely correlated with the level of peak hs-TnT. In addition, patients with lower MBF tended to have more severely impaired LV function at the time of admission and at their 6-month mark follow-up.
Dynamic CT-MPI is an emerging non-invasive imaging modality for absolute quantification of MBF. In addition to evaluating its diagnostic performance for the assessment of myocardial ischemia, few studies have investigated the prognostic value of CT-MPI-derived quantitative parameters in patients with stable angina (2021). The present study, for the first time, evaluated the prognostic value of those parameters in STEMI patients. Interestingly, the values of MBF derived from dynamic CT-MPI were better correlated with peak hs-TnT level and mid-term LV function than any other parameter.
As revealed by one animal study with different grades of coronary stenosis, MBF values derived from dynamic CT-MPI can be used to quantify the actual MBF and has good correlation with microsphere-measured MBF (16). In STEMI patients, the infarcted myocardium suffers not only from the sudden blockage of epicardial coronary flow but also potentially from MVO. In that circumstance, the ischemic injury results in compromised microvessel integrity with intraluminal obstruction of the lumen caused by regional swelling of the endothelial wall as well as intraluminal protrusions and blebs of the endothelial cytoplasm. Furthermore, interstitial myocardial edema compresses capillaries and small arterioles, further decreasing flow through these dysfunctional vessels. Moreover, reperfusion injury further obliterates vessel lumen by neutrophil-platelet aggregates, which in turn produce large amounts of vasoconstrictors and inflammatory mediators (22). Therefore, the myocardial perfusion is almost absent in the infarction core with MVO. According to a porcine model study, MBF quantified by CT-MPI was strongly correlated with the MBF quantified by microsphere and agreed well with the histology findings of AMI with MVO (23). The MBF of infarcted territories in the current study (30.5 ± 7.4 mL/min/100 mL) was similar to the MBF of infarcted myocardium with MVO as determined by histopathology in the above porcine model study (32.2 ± 9.1 mL/min/100 mL) (23). Hence, it is conceivable that the area with lower MBF might represent the infarction core with the presence of MVO, which is associated with higher peak hs-TnT levels, impaired LV function, and unfavorable outcomes (242526).
In line with the previous study by Bamberg et al. (27), MBV is another parameter that showed significant difference between infarcted territories and reference territories in the present study. MBV is defined as the peak enhancement, which is calculated by dividing the maximum point of the time-attenuation curve by the maximum point of the AIF (27). The value of MBV correlates with the capillary density of the myocardium, which is low in the presence of MI. However, compared to the patients with AMI, this decrease is more prominently observed in patients with chronic MI. In the latter circumstance, viable myocardium is replaced by fibrotic tissue which leads to lower peak enhancement (28). Thus, as indicated by the current finding, the MBV value in the acute stage of MI is a less-sensitive parameter that is associated with mid-term LV function. Similarly, other parameters, such as EVV, TTT, and TTP might also reflect the perfusion status in the setting of chronic MI rather than AMI. Therefore, they failed to show any significant difference between infarcted territories and reference territories in the current study.
The potential clinical implication of the present finding is to use MBF derived from dynamic CT-MPI as a sensitive biomarker and predictor that might reflect the severity of myocardial injury and predict clinical outcomes in AMI patients. Similarly to the clinical significance of hs-TnT, patients with lower MBF might have less favorable outcomes and higher incidences of MACE. Although CMR is the non-invasive gold standard modality for imaging the extent of MI as well as risk stratification, it is time-consuming and has more contradictions. AMI patients who are unable to hold their breath or have claustrophobia might be ideal candidates for dynamic CT-MPI imaging. According to the absolute value of MBF in this cohort, CT-MPI is potentially able to identify high-risk patients that have a poor prognosis.
The major limitation of the current study is the lack of CMR correlation. Although we hypothesized that myocardium with lower MBF and higher peak hs-TnT might represent an area of MVO area, it needs to be confirmed by further comparative studies using CMR as the reference standard. In addition, the current MBF value was derived from rest dynamic CT-MPI in patients with STEMI. In other words, this finding might be different from the results of stress dynamic CT-MPI.
In conclusion, MBF quantified by dynamic CT-MPI is significantly inversely correlated with the level of peak hs-TnT. In addition, patients with lower MBF tend to have more severely impaired LV function at the time of admission and at 6 months.
 XML Download