

 PDF
PDF ePub
ePub Citation
 Print
Print


INTRODUCTION
Diffuse lower-grade gliomas (LGGs), which are analogous to World Health Organization (WHO) grade II and grade III gliomas (1), are infiltrative neoplasms that most often arise in the cerebral hemispheres of adults. Although the 2016 update to the WHO classification reflects a combination of phenotypic and genotypic information (2), the therapeutic strategy is still heavily reliant on the WHO grade and patients' prognosis differs significantly according to tumor grade (34). Although some recent studies have suggested that the prognostic differences between grade II and III are not as marked (56), this has not been observed in all studies and grading is still important (7).
Biopsy results are the gold standard for glioma grading. However, the accuracy of biopsy may be limited by tumor heterogeneity and sampling errors, which may result in tumor undergrading (8910). Moreover, biopsy itself is an invasive technique with reported morbidity and mortality rates of up to 3.6% and 1.7%, respectively (1112). Therefore, if grade III LGGs are suspected, a more aggressive surgical resection should be considered to avoid unnecessary biopsy (13). In preoperative grading of LGGs, the presence and degree of contrast enhancement have been traditionally used as a hallmark of grade III gliomas (141516). However, several studies have demonstrated that the absence of enhancement does not necessarily imply WHO grade II glioma (171819), and grade III gliomas have been reported to comprise 34.3–42.3% of nonenhancing LGGs (1318192021), making preoperative grading of nonenhancing LGGs difficult.
Radiomics features show tumor characteristics noninvasively by extracting the high-dimensional quantitative features that reflect tumor morphology and heterogeneity (22). Several studies have reported that radiomics features can be used to predict the genetic subtypes and prognosis of gliomas (2324). However, the role of these features in the prediction of LGG grade has not yet been established. We hypothesized that radiomics features can extract invisible information regarding glioma grade.
The aim of this study was to assess whether radiomics features from multiparametric MRI can predict tumor grade in LGGs by using machine learning. The assessments also focused on the nonenhancing LGG subgroup, which is often classified as WHO grade II glioma on preoperative MRI.
MATERIALS AND METHODS
Patient Population
The Institutional Review Board waived the need for obtaining informed patient consent for this retrospective study. Between September 2007 and January 2017, 231 patients with pathologically diagnosed WHO grade II and III gliomas from our institution were included in this study. Inclusion criteria were as follows: 1) WHO grade II or III gliomas confirmed by histopathology, 2) patients who underwent preoperative MRI, and 3) patients aged ≥ 18 years. The exclusion criteria were as follows: 1) absence of T2-weighted or fluid-attenuated inversion recovery (FLAIR) images (n = 19); 2) a previous history of biopsy or operation for brain tumors (n = 3); and 3) errors in image processing (n = 5). The mean interval between the MRI examination and operation was 13.4 ± 14.1 days. A total of 204 patients were finally enrolled in the institutional cohort. The institutional cohort was semirandomly allocated to training (n = 136) and test (n = 68) sets, with stratification for glioma grade.
The external validation set was collected from the LGG dataset from The Cancer Genome Atlas (TCGA), which is publicly available in The Cancer Imaging Archive (TCIA). For the 199 patients with publicly available magnetic resonance (MR) images from the TCGA cohort, the exclusion criteria were as follows: 1) absence of T2-weighted, FLAIR, or contrast-enhanced T1-weighted (T1C) images (n = 80); 2) previous history of biopsy or resection of tumor (n = 17); 3) severe motion artifact (n = 1); and 4) errors in image processing (n = 2). Finally, 99 patients were enrolled in the TCGA cohort.
For nonenhancing LGG subgroup analysis, 110 of the 204 patients from the institutional cohort were enrolled and semirandomly allocated to training (n = 73) and test (n = 37) sets, with stratification for glioma grade. Similarly, 37 out of the 99 patients from the TCGA cohort were enrolled in the nonenhancing LGG subgroup and used for external validation. The patient enrollment process for the entire LGG group and the nonenhancing LGG subgroup is shown in Figure 1.
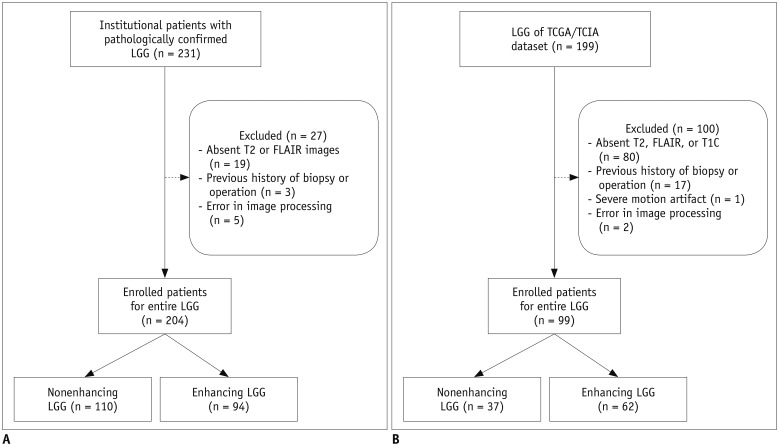
Fig. 1
Patient enrollment process for entire LGG group and nonenhancing LGG subgroup in (A) institutional cohort and (B) TCGA cohort.
FLAIR = fluid-attenuated inversion recovery, LGG = lower-grade glioma, TCGA = The Cancer Genome Atlas, TCIA = The Cancer Imaging Archive, T1C = contrast-enhanced T1-weighted
![]()
Pathological Diagnosis
For pathological diagnosis of glioma grade in the institutional cohort, surgical specimens were fixed in 10% buffered formaldehyde in preparation for light microscopy and stained with hematoxylin-eosin. Histologic grading was performed according to the WHO classification by a neuropathologist (16 years of experience) who was blinded to the clinical information (2). For the TCGA cohort, the histological characteristics and grading of tissues submitted to TCGA were confirmed by a neuropathology review, as previously described (125).
MRI Protocol
Preoperative MRI examinations for the institutional cohort were performed using a 3T MRI scanner (Achieva, Philips Healthcare, Best, The Netherlands) with an eightchannel sensitivity-encoding head coil. The preoperative MRI protocol included T1-weighted (repetition time [TR]/echo time [TE], 1800–2000/10–15 ms; field of view [FOV], 240 mm; section thickness, 5 mm; matrix, 256 × 256), T2-weighted (TR/TE, 2800–3000/80–100 ms; FOV, 240 mm; section thickness, 5 mm; matrix, 256 × 256), and FLAIR (TR/TE, 9000–10000/110–125 ms; FOV, 240 mm; section thickness, 5 mm; matrix, 256 × 256) sequences. Three-dimensional T1C images (TR/TE, 6.3–8.3/3.1–4 ms; FOV, 240 mm; section thickness, 1 mm; and matrix, 192 × 192) were acquired after administering 0.1 mL/kg of gadolinium-based contrast material (gadobutrol [Gadovist], Bayer AG, Toronto, Canada).
The different MRI scanners for the TCGA cohort acquired from five institutions is listed on Supplementary Table 1. Further detailed information on the diverse imaging protocols for this study in available online (https://www.nature.com/articles/sdata2017117/tables/3) (26).
Image Processing and Radiomics Feature Extraction
To overcome the heterogeneity in the different MRI protocols, the T2-weighted images from the institutional and TCGA/TCIA cohorts were resampled to 0.5 × 0.5 mm spatial resolution and 5-mm slice thickness and used as a registration template for FLAIR and T1C images. After skull stripping, the T1C and FLAIR images were registered to the T2-weighted image template by using FMRIB software library (FSL, http://fsl.fmrib.ox.ac.uk/fsl/fslwiki/FSL). Image signal intensities were normalized using the WhiteStripe R package (27). Region-of-interests (ROIs) covering the entire tumor including edema (defined as hyperintense areas on FLAIR), were drawn semiautomatically by using thresholds of signal intensity and by consensus of two neuroradiologists (with 10 years and 7 years of experience, respectively). In total, 250 radiomics features were extracted from the ROIs on T1C, T2-weighted, and FLAIR images, which were related to shape (n = 16), first-order statistics (n = 19), gray level co-occurrence matrix (n = 27), gray level run-length matrix (n = 16), and gray level size zone matrix (n = 16) (Supplementary Table 2). The feature extraction was performed with Pyradiomics 1.2.0 (http://www.radiomics.io/pyradiomics.html) (28).
Statistical Analysis and Machine Learning
The workflow for machine learning after image processing and feature extraction is shown in Figure 2. Various machine learning classifiers were trained to predict the glioma grade in the entire LGG group and the nonenhancing subgroup. For feature selection, Student's t test according to glioma grade was performed for each radiomics feature to filter the features with p < 0.2. In some classifiers, recursive feature elimination (RFE) was additionally performed for those features filtered from the t test. These feature selection methods were combined with the elastic net, random forest (RF), gradient boosting machine (GBM), and linear discriminant analysis (LDA) algorithms, resulting in five combinations: 1) t test, RFE, and RF, 2) t test, RFE, and GBM, 3) t test, RFE, and LDA, 4) t test and elastic net, and 5) t test and RF. Therefore, five radiomics classifiers were trained to classify tumor grade in the entire LGG group. In the nonenhancing LGG subgroup, to overcome data imbalance, subsampling with the random over-sampling examples (ROSE) and synthetic minority over-sampling technique (SMOTE) methods or no subsampling were additionally performed after univariate filtering by the t test and combined with the previously mentioned five radiomics classifiers. Therefore, a total of 15 radiomics classifiers were trained for the nonenhancing LGG subgroup (29). During classifier training, hyperparameters of classification algorithms were optimized by grid search.
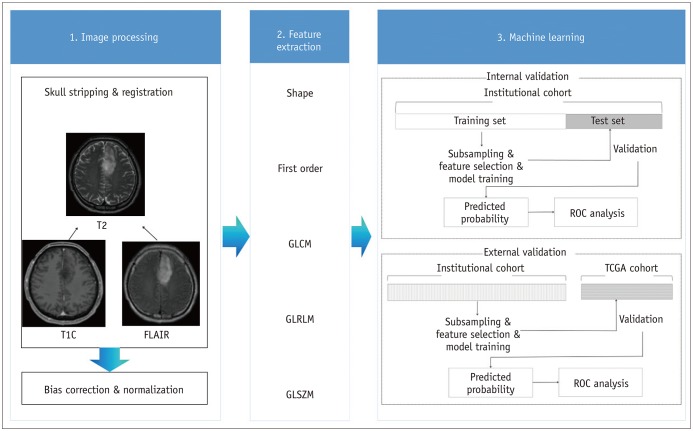
The radiomics classifiers were validated internally on the institutional test set and externally on the TCGA cohort. In the entire LGG group, for internal validation, radiomics classifiers were trained on the institutional training set (n = 136) and validated on the institutional test set (n = 68). For external validation, the classifiers were trained on the entire institutional cohort (n = 204) and validated on the TCGA cohort (n = 99). The radiomics classifier performance was measured by performing receiver operating characteristics analysis and calculating the area under the curve (AUC). The accuracy, sensitivity, specificity, and no-information rate (percentage of the majority class, i.e., the accuracy determined by assuming that all samples belong to majority class) were also calculated for the best classifiers with the highest AUC values. In addition, an one-sided hypothesis test was performed using the “binom.test” function to evaluate whether the radiomics classifier accuracy is significantly higher than the no-information rate.
An identical process of training and validation was performed for 15 machine learning classifiers in the nonenhancing LGG subgroup. For internal validation, machine learning classifiers were trained on the institutional training set (n = 73) and validated on the institutional test set (n = 37). For external validation, the classifiers were trained on the entire nonenhancing institutional cohort (n = 110) and validated on the nonenhancing TCGA cohort (n = 37).
Statistical analysis was performed using the statistical software R (version 3.3.1; R Foundation for Statistical Computing, Vienna, Austria). The RFE feature selection and classification algorithms were implemented using the “caret” R package (30). ROSE and SMOTE subsampling was performed using the “ROSE” and “DMwR” R packages. Statistical significance was set at p < 0.05.
RESULTS
The patient characteristics in the institutional training (n = 136 and 73 for the entire group and nonenhancing LGG subgroup, respectively) and test sets (n = 68 and 37 for the entire group and nonenhancing LGG subgroup, respectively) and the TCGA validation set (n = 99 and 37 for the entire group and nonenhancing LGG subgroup, respectively) are summarized in Tables 1 and 2. The proportion of nonenhancing LGGs differed in the institutional and TCGA cohorts (76% in the institutional cohort and 56.3% in the TCGA cohort for grade II gliomas and 22.4% in the institutional cohort and 19.6% in the TCGA cohort for grade III gliomas).
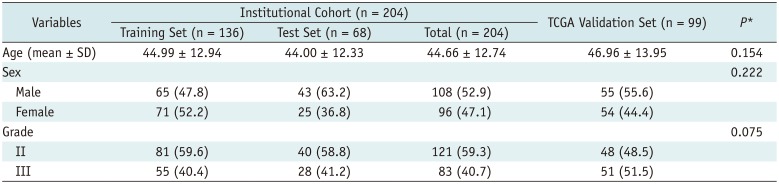
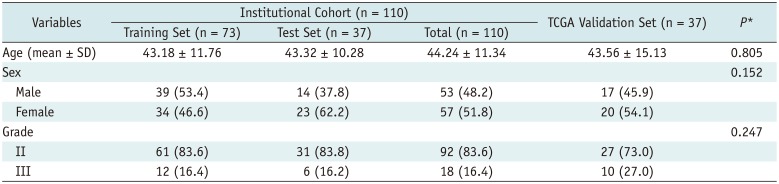
Table 1
Patient Characteristics in Entire LGG Group
Data are number of patients. Numbers in parentheses are percentage. *p values were calculated using Student's t test for continuous variables and chi-square test for categorical variables, to compare patient characteristics of institutional cohort (n = 204) and TCGA validation set (n = 99). LGG = lower-grade glioma, SD = standard deviation, TCGA = The Cancer Genome Atlas
![]()
Table 2
Patient Characteristics in Nonenhancing LGG Subgroup
![]()
The AUC values for predicting glioma grade by various machine learning classifiers are shown in Figure 3. Summaries of the performance of the best machine learning classifiers in the internal and external validation of the entire LGG group and nonenhancing LGG subgroup are presented in Table 3. In internal validation with the entire LGG group, the best performance was shown by a combination of feature selection by the t test and elastic net without subsampling, with an AUC, accuracy, sensitivity, and specificity of 0.85, 79.4%, 92.9%, and 70.0%, respectively. In external validation with the entire LGG subgroup, the best performance was achieved by a combination of feature selection using the t test and RFE and the GBM algorithm, with an AUC, accuracy, sensitivity, and specificity of 0.72, 66.7%, 72.6%, and 60.4%, respectively. The accuracy of the radiomics classifier was significantly higher than the no-information rate in both internal (79.4% vs. 58.8%, p < 0.001) and external (66.7% vs. 51.5%, p = 0.002) validations.
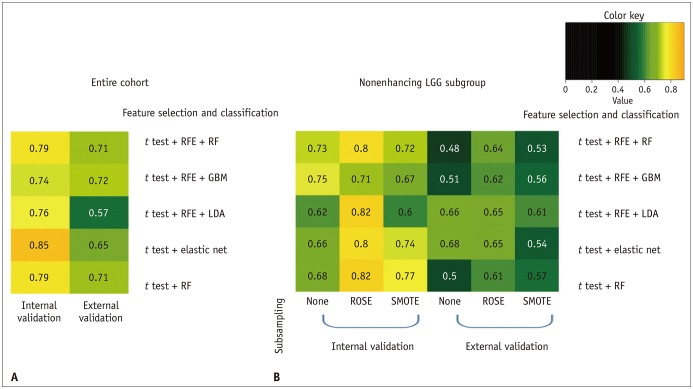
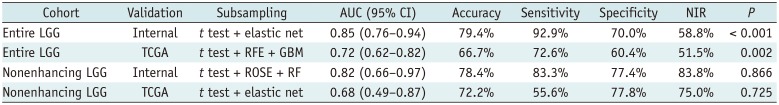
Fig. 3
Heatmap of AUC values.
Heat map of AUC values from machine learning classifier to predict grade (A) in entire LGG group in internal validation for institutional test set (n = 136) after training on institutional training set (n = 68) and entire LGG group in external validation for TCGA validation set (n = 99) after training on entire institutional cohort (n = 204); and (B) in nonenhancing LGG subgroup in internal validation for institutional test set (n = 73) after training on institutional training set (n = 37) and nonenhancing LGG subgroup in external validation on TCGA cohort (n = 37) after training on entire nonenhancing institutional cohort (n = 110). AUC = area under curve, GBM = gradient boosting machine, LDA = linear discriminant analysis, RF = random forest, RFE = recursive feature elimination, ROSE = random over-sampling examples, SMOTE = synthetic minority over-sampling technique
![]()
Table 3
Performance of Best Machine Learning Classifiers in Grade Prediction for Entire LGG Group and Nonenhancing LGG Subgroup in Internal and External Validations
![]()
In internal validation with the nonenhancing LGG subgroup, the best classifier was the combination of t test feature selection, RF algorithm, and ROSE subsampling, with AUC, accuracy, sensitivity, and specificity of 0.82, 78.4%, 83.3%, and 77.4%, respectively. In external validation with the nonenhancing LGG subgroup, however, all 15 machine learning classifiers failed to show good performance (AUC, 0.48–0.68) regardless of subsampling. The best classifier was the combination of t test feature selection and elastic net without subsampling, with an AUC, accuracy, sensitivity, and specificity of 0.68, 72.2%, 55.6%, and 77.8%, respectively.
DISCUSSION
In this study, we aimed to differentiate the LGG grades using radiomics features from routinely obtained MRI sequences. Our results showed that radiomics classifiers are useful to predict the tumor grade of LGGs, although radiomics classifiers may have a limited value for grading the nonenhancing LGG subgroup, especially in a heterogeneous external cohort.
Previous studies have attempted to differentiate the grades of LGG by using various advanced imaging techniques, such as diffusion tensor imaging, perfusion-weighted imaging, MR spectroscopy, and C-methionine positron emission tomography (13181920213132). However, most studies recruited smaller sample sizes and included the entire LGG group regardless of enhancement. Only a few studies analyzed the nonenhancing LGG subgroup and reported a limited performance of the imaging biomarkers in grading nonenhancing LGG (1318). Moreover, many of these studies used advanced imaging techniques that might not be routinely performed and therefore had limited feasibility. In our study, however, routine conventional MR sequences were analyzed using a pipeline that was built completely upon open-source packages. The use of common MR sequences and easily accessible tools may yield a more feasible methodology and reproducible results that can be shared with other institutions. High-throughput quantitative radiomics features are prone to yield information imperceptible to the human eye, reflecting the disruption or compression of normal anatomy by tumors, vasogenic edema, and tumor cellularity. Recent studies have reported that texture analysis is a potentially useful approach for estimating the molecular status in LGGs (3334), and we hypothesized that multiparametric MR features may be also useful in LGG grading.
In this study, we used the institutional training set and the TCGA test set. This allowed us indirectly to assess how the differences in MR protocols can affect the model performance and whether radiomics phenotyping can still provide useful information regarding the LGG grade across the different MR protocols. The accuracy of grading for the entire LGG group was significantly greater than the no-information rate in both internal and external validations. This result implies that radiomics is useful for LGG grading, despite the heterogeneity in the TCGA cohort with the different imaging protocols. Nonetheless, as the AUC in the external validation was lower than that in the internal validation for both the entire LGG group and the nonenhancing LGG subgroup, our results also imply that standardization of MRI protocols is mandatory to achieve optimized performance of radiomics classifiers. In addition, it should be emphasized that although the best radiomics classifier is useful for differentiating LGG grades, a diverse range of performance levels was noted according to the machine learning algorithms and resampling methods used. Therefore, for application in a clinical workflow, preliminary analysis of the data subset may be necessary to identify the most reliable machine learning classifier before training of the entire cohort using a specific machine learning classifier.
As seen in Supplementary Table 1 and the aforementioned online link, the TCGA cohort consisted of heterogeneous imaging protocols from different MRI vendors with different field strengths, which may have contributed to the poor performance in the prediction of nonenhancing LGG grade. Apart from the heterogeneity of the MRI protocols, there are several possible explanations for the poor performance in the prediction of nonenhancing LGG grade in external validation in our study. First, although the absence of enhancement does not always indicate grade II glioma, enhancement is still an important indicator of a highergrade glioma, given that 52–85% of grade III gliomas show enhancement whereas only 47.9–56% of grade II gliomas show enhancement (14171935). In the nonenhancing LGG subgroup, the radiomics classifiers were trained without this information on contrast enhancement. Moreover, the proportion of nonenhancing LGGs differed in the institutional and TCGA cohorts. The absence of crucial information regarding contrast enhancement as well as the discrepant proportion of nonenhancing LGG subgroups between cohorts may have resulted in the lower performance of the radiomics classifier. Second, in the external cohort, glioma grading was performed by various pathologists, which may have resulted in interobserver variability (36). One study has reported that 20–30% of gliomas are reclassified when the tumor material is independently reviewed (36). Histopathologic undergrading of LGGs may have also resulted in poor performance of the machine learning classifiers, especially in the heterogeneous TCGA cohort.
Our study has several limitations. First, it was based on a retrospectively collected dataset without an analysis of prognostic markers. Further studies are necessary to correlate grade and prognostic markers such as overall survival and progression-free survival with radiomics features. Second, although several studies have demonstrated the utility of incorporating advanced imaging techniques such as diffusion-weighted image or perfusion studies in radiomics (2437), such advanced imaging techniques were not included in our analyses. As these imaging techniques are routinely performed in tertiary centers, further studies including these advanced sequences should be performed. Third, the classifier performance in grading the nonenhancing LGG subgroup may have a limited reliability due to the small subgroup size with data imbalance between grade II and III tumors. Even though subsampling was performed to resolve the disparity in the frequencies of non-enhancement, there were variable performance levels according to the subsampling methods and machine learning algorithms, which may limit the reliability of the results. Further studies with a larger number of nonenhancing LGG cases are warranted for better assessment. Fourth, tumor segmentation was performed only at the hyperintense areas on FLAIR in our study. Segmentation for the contrast-enhancing portion of the tumor was not performed because the enhancing area was already included in the aforementioned ROI and its inclusion may lead to feature redundancy that may not be useful for the radiomics classifiers (38). Finally, interpolation was not used to create isotropic voxel spacing, and thus may not gain rotational invariability.
In conclusion, radiomics feature-based classifiers may be useful to predict the grade of LGGs. However, radiomics classifiers may have a limited value in the TCGA external validation cohort of the nonenhancing LGG subgroup.
 XML Download