Journal List > Korean J Radiol > v.20(9) > 1130847

Lee, Kim, Jung, Choi, Park, Shin, and Choi: Evaluation of Flow Pattern in the Ascending Aorta in Patients with Repaired Tetralogy of Fallot Using Four-Dimensional Flow Magnetic Resonance Imaging

Abstract

Objective

To evaluate flow pattern characteristics in the ascending aorta (AA) with four-dimensional (4D)-flow MRI and to determine predictors of aortic dilatation late after tetralogy of Fallot (TOF) repair.

Materials and Methods

This study included 44 patients with repaired TOF (25 males and 19 females; mean age, 28.9 ± 8.4 years) and 11 volunteers (10 males and 1 female, mean age, 33.7 ± 8.8 years) who had undergone 4D-flow MRI. The aortic diameters, velocity, wall shear stress (WSS), flow jet angle (FJA), and flow displacement (FD) at the level of the sinotubular junction (STJ) and mid-AA were compared between the repaired TOF and volunteer groups. The hemodynamic and clinical parameters were also compared between the aortic dilatation and non-dilatation subgroups in the repaired TOF group.

Results

The diameters of the sinus of Valsalva, STJ, and AA were significantly higher in the repaired TOF group than in the volunteer group (p = 0.002, p < 0.001, and p = 0.013, respectively). The FJAs at the STJ and AA were significantly greater in the repaired TOF group (p < 0.001 and p = 0.003, respectively), while velocities and WSS parameters were significantly lower. FD showed no statistically significant difference (p = 0.817). In subgroup analysis, age at TOF repair was significantly higher (p = 0.039) and FJA at the level of the AA significantly greater (p = 0.003) and mean WSS were significantly lower (p = 0.039) in the aortic dilatation group. FD were higher in the aortic dilatation group without statistical significance (p = 0.217).

Conclusion

Patients with repaired TOF have an increased FJA, dilated AA, and secondarily decreased WSS. In addition to known risk factors, flow eccentricity may affect aortic dilatation in patients with repaired TOF.

INTRODUCTION

Tetralogy of Fallot (TOF) is the most common cyanotic congenital heart disease (1). With advancements in the field of surgery and medicine, clinical outcomes have improved and patients generally survive to adulthood after corrective surgery (2). However, late aortic root dilatation is a growing concern among patients after TOF repair, as one of the late complications affecting long-term prognosis (34).
Aortic dilatation has been reported after total correction of TOF in as many as 87% of cases, of which approximately 12% have aortic valve regurgitation and require surgical correction (567). Moreover, some studies have reported that aortic dilatation may progress to aortic aneurysm or aortic dissection (89). However, there have been few reports on the aortic hemodynamic characteristics and associated clinical factors in patients with repaired TOF.
Four-dimensional (4D) flow magnetic resonance imaging (MRI), a time-resolved three-dimensional phase-contrast MRI with three-directional velocity encoding, is an evolving technique for visualization and quantification of vessels of interest (1011). Recently, 4D flow MRI has been used not only for visualizing the vascular flow pattern of interest, but also for measuring quantitative hemodynamic factors like the wall shear stress (WSS) and flow eccentricity (121314).
The aim of our study was to evaluate the characteristics of flow patterns in the ascending aorta (AA) with 4D flow MRI and to determine the possible predictors of aortic dilatation late after TOF repair.

MATERIALS AND METHODS

Study Population

Forty-four adult patients (25 males and 19 females; mean age, 28.9 ± 8.4 years) with repaired TOF were prospectively enrolled and underwent 4D-flow MRI of the heart and thoracic aorta. 4D-flow MRI was added to the standard cardiac MRI, which was clinically indicated. Eleven healthy young adult volunteers (10 males and 1 female, mean age, 33.7 ± 8.8 years) without any history of cardiovascular disease were included as a control group. For patients with repaired TOF, demographic data, echocardiographic measurements, and surgical histories were obtained from electronic medical records. Our Institutional Review Board approved this study, and informed consent was obtained from each participant.
For subgroup analysis, we divided the patients group using ‘threshold regression model’ for detecting change point at nonlinear relationship between aortic dimension and mean WSS. Using the obtained threshold AA dimension and matched mean WSS value, we divided the patients in four subgroups as combination of high or low WSS with aortic dilatation or without aortic dilatation groups. We also divided the patients simply in two groups as aortic dilatation or aortic non-dilatation group using the same threshold value.

MRI Protocol

All patients and volunteers were scanned using a 3T system (MAGNETOM Trio, Siemens Healthineers, Erlangen, Germany) with an 8-channel body-phased array coil. 4D-flow MRI was performed during free breathing with electrocardiogram gating and with a respiratory navigator placed on the lung-liver interface, covering the thoracic aorta. The 4D flow sequence parameters were as follows: velocity-encoding of 200 cm/s in three directions, voxel size: 2.08 × 1.56 × 3 mm3, temporal resolution: 41.2–60.0 ms, echo time/repetition time: 2.58–2.62 ms/2.52–2.64 ms, flip angle: 15°, field of view: 233 × 340 mm, and scan matrix: 99 × 192 mm.

Image Analysis

Using an outsourcing software implemented in MATLAB (MathWorks, Inc., Natick, MA, USA), 4D flow data were analyzed through a semi-automated pipeline (Supplementary Fig. 1). Data were processed according to the developer's original protocol (14). Data analysis included analysis of aortic diameters, velocity, WSS, flow jet angle (FJA), and flow displacement (FD) at the level of the sinotubular junction (STJ) and mid-AA. The definitions of hemodynamic parameters were explained detail in Table 1. In addition to hemodynamic parameters in 4D-flow MRI, we measured aortic diameters at 5 levels (aortic sinus, STJ, AA, proximal descending aorta at pulmonary arterial level, and distal descending aorta at diaphragm level) in 4D flow MRI and conventional cardiac function parameters through standard MRI sequences. Through multi-planar reconstructed 4D flow magnetic resonance images, we measured aortic diameters perpendicular to aortic centerline in peak systolic phase, which we segmented AA in this study.

Statistical Analysis

The Mann-Whitney U test was used to compare 4D-flow parameters between groups. Spearman's correlation test was used to determine whether the diameters at the STJ and AA were significantly correlated with 4D-flow parameters and clinical parameters. The threshold regression model was used to determine the cutoff for parameters at the smoothing spline curve (15). Through this analysis, we obtained the threshold values of WSS_mean and the corresponding aortic diameter that can best delineate the groups with different characteristics at the AA level. For comparisons between subgroups, which were divided by previous thresholds, Fisher's exact test and Mann-Whitney U test were used. Statistical analyses were performed using SPSS software package (version 23.0, IBM Corp., Armonk, NY, USA) and R (version 3.5.0, R Foundation for Statistical Computing, Vienna, Austria). P < 0.05 was considered statistically significant.

RESULTS

Characteristics of the Study Population

There was no significant difference in mean age between the repaired TOF (28.9 ± 8.4 years) and volunteer (33.7 ± 8.8 years) groups. In the repaired TOF group, 5 patients had aortic valve regurgitation (≥ grade I/IV on echocardiography), 4 had residual ventricular septal defect (VSD) at the time of 4D flow MRI, 12 had right-sided aortic arch, and 4 had undergone palliative surgery (e.g., Blalock-Taussig shunt) before total corrective surgery. The mean age at the time of total corrective surgery for TOF was 4.6 ± 7.0 years.

Comparison between Repaired TOF and Volunteer Groups

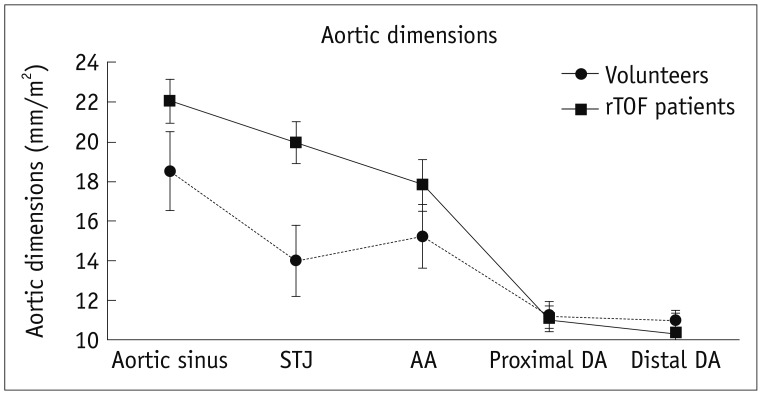
Aortic diameters corrected by body surface area (BSA) at the level of the aortic sinus, STJ, and AA were significantly higher in the repaired TOF group than in the volunteer group (p = 0.002, p < 0.001, and p = 0.013, respectively). However, the diameters of the proximal and distal descending aorta were not significantly different between groups (p = 0.966 and p = 0.643, respectively) (Table 2, Fig. 1).
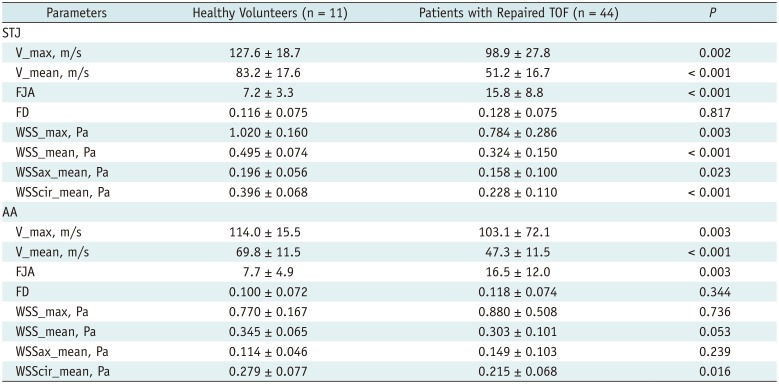
The maximal and mean velocities, maximal and mean WSS, and mean WSS in the axial and circular direction were significantly lower (p = 0.002, p < 0.001, p = 0.003, p < 0.001, p = 0.023, and p < 0.001, respectively) and FJA was significantly higher (p < 0.001) at the level of the STJ in the repaired TOF group. The maximal and mean velocities, and mean WSS in the circular direction were significantly lower (p = 0.003, p < 0.001, and p = 0.016, respectively) and the FJA significantly higher (p = 0.003) at the level of the AA in the repaired TOF group. About the FD, even though there were no statistical significance, we found repaired TOF patients show increased FD compared to healthy volunteers (Table 3).

Correlation between Hemodynamic Parameters and Aortic Dimensions

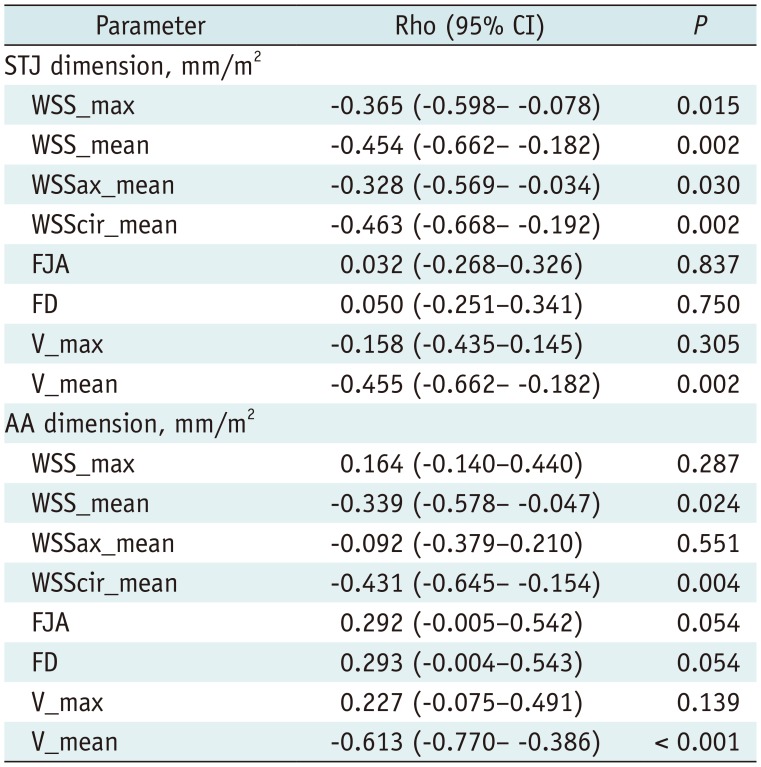
We analyzed the correlation between 4D flow MRI hemodynamic parameters and aortic diameters corrected by BSA. At the level of the STJ, mean velocity and WSS parameters were significantly correlated with STJ diameter (mean velocity: p = 0.002; maximal WSS: p = 0.015; mean WSS: p = 0.002; mean WSS in the axial direction: p = 0.030; mean WSS in the circular direction: p = 0.002). At the level of the AA, mean velocity, mean WSS, and mean WSS in the circular direction were significantly correlated with AA diameter (p < 0.001, p = 0.024, and p = 0.004, respectively) (Table 4, Fig. 2).

Comparison between Aortic Dilatation and Non-Dilatation Groups in the Repaired TOF Patients

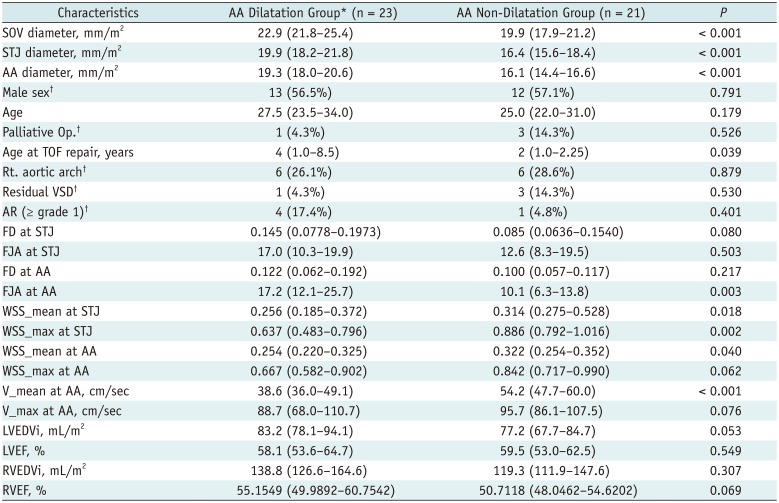
In the threshold regression analysis with smoothing spline curve, a WSS_mean of 0.289 Pa and matched aortic dimension of 17.02 mm/m2 at the level of the AA were obtained as thresholds (Supplementary Fig. 2). Based on these values, we divided the patients into four subgroups: high WSS with or without aortic dilatation and low WSS with or without aortic dilatation (Supplementary Table 1). There were no statistically significant differences between the four groups. However, in the subgroup analysis between aortic dilatation (n = 23) and non-dilatation (n = 21) groups, age at the time of TOF repair was significantly higher (p = 0.039) and FJA at the level of the AA significantly larger (p = 0.003) in the former. And we found that aortic dilatation group showed increased FD compared to aortic non-dilatation group, although there was no statistical significance (Table 5).

DISCUSSION

This study was conducted to evaluate the characteristics of flow patterns in the AA with 4D flow MRI and to determine possible predictors of aortic dilatation late after TOF repair. We found that patients with repaired TOF showed significant aortic dilatation at the level of the aortic root and AA, but not the descending aorta, compared to healthy volunteers. FJA (representing flow eccentricity) was higher at both the STJ and AA, while WSS parameters and velocities were lower, in the repaired TOF group. The age at the time of TOF repair was significantly higher and FJA larger in patients with aortic dilatation than in those without aortic dilatation.
There have been reports on aortic dilatation and associated complications (such as aortic valve regurgitation and aortic dissection) in patients with repaired TOF (5678916). Niwa et al. (317) have reported that factors related to longstanding volume overload to the aortic root before TOF repair—such as severe right ventricular outflow tract obstruction, older age, a larger aortic size at the time of repair, and a history of aorto-pulmonary shunt—as well as male sex and right aortic arch are risk factors for aortic dilatation after TOF repair. However, there have been inconsistent reports on predictors of aortic dilatation after TOF repair (418). In this study, in line with previous reports, the age at the time of TOF repair was significantly higher in patients with aortic dilatation than in those without it. Male sex was correlated with aortic dilatation when uncorrected aortic dimensions were used; however, after correction by BSA, the correlation disappeared. Other clinical factors including history of aorto-pulmonary shunt and right aortic arch were not statistically different between the aortic dilatation and non-dilatation groups, which may be due to the small sample size of our study.
Nagy et al. (19) reported that aortic regurgitation and residual VSD were associated with increased odds of dilatation at the aortic root. In our study, more patients had aortic regurgitation in the aortic dilatation group (though the difference was not significant), which is concordant with results of Nagy et al. (19). However, we obtained a conflicting result for residual VSD, with more patients having residual VSD in the aortic non-dilatation group in our study, though the difference was not significant. The effect of residual VSD on aortic dilatation may be different depending on the size of the residual defect and degree of residual pulmonary stenosis; i.e., the amount of left-to-right shunt. However, it was difficult to identify the relationship between residual VSD and aortic dilatation in our study because only four patients had residual VSD.
To our knowledge, this is the first study to identify hemodynamic factors of aortic dilatation in patients with repaired TOF using 4D flow MRI. Because of the overriding aorta and consequently transformed left ventricular outflow tract anatomy, which is a fundamental feature of TOF, eccentric flow to the aorta is inevitable after TOF repair. This eccentric flow and its effect on the AA are demonstrated by our results of significantly higher FJA in the repaired TOF group than among volunteers, and significantly higher FJA in the aortic dilatation group than in the non-dilatation group. Our results suggest that, in addition to known risk factors for increased aortic flow, flow eccentricity may affect aortic dilatation in TOF patients.
Several previous studies using 4D flow MRI have reported that increased WSS is associated with aortic dilatation (1220). Barker et al. (21) reported that patients with bicuspid aortic valve (BAV) have significantly higher WSS than healthy controls. However, recent studies about WSS, including a longitudinal study, have provided conflicting results. Geiger et al. (22) reported that patients with Marfan syndrome have decreased WSS in the AA, which is the site of aortic dilatation in these patients. Upon follow-up imaging, further decreased WSS was reported with statistical significance. They also reported that decreased WSS is significantly correlated with aortic dilatation and abnormal localized flow pattern (22). Farag et al. (23) reported that BAV patients show a significant negative correlation between AA diameter and peak WSS. They also reported that the surface area of increased WSS was significantly lower in patients with aortic dilatation than in those without it (23).
Our results that patients with repaired TOF have decreased WSS, increased FJA, and significant negative correlation between aortic dimensions and WSS are in line with previous reports. Recent studies have explained the relationship between aortic dilatation and WSS as a hemodynamically adaptive process rather than static state at a point (222324). It has been shown that eccentric flow induced by the pathologic anatomy of patients with repaired TOF is followed by WSS increase and subsequent aortic dilatation is a compensatory response to decrease the WSS. Eccentric flow induced WSS increase can be explained by wall shear rate (WSR), which is a variable of WSS function. WSR is a function of the outermost slope of velocity profile in flowing direction. So, if the central peak velocity zone deviates toward a certain wall side, the WSS of the wall increases and the reciprocal changes can become to the opposite wall. Also, in a constant amount of flow volume, aortic dilatation will decrease the WSS by decreasing peak and mean velocities. The aortic dilatation and the WSS can be in a reciprocal relationship so that can be a cause and a result of the other. Therefore, secondarily decreased WSS with aortic dilatation in these patients is the overall result of an adaptive process.
In summary, we found that dilated aorta of patients group compared to healthy volunteers and dilated aorta of aortic dilatation group patients compared to aortic non-dilatation group show increased FJA and decreased WSS. Also age of total corrective surgery was older in aortic dilatation group compared to aortic non-dilatation group. According to these results, we think flow eccentricity which is demonstrated by increased FJA and longstanding volume overload to AA which is demonstrated by delayed operation age are important factors affecting aortic dilatation. Among the clinical and 4D flow hemodynamic parameters we evaluated, we initially hypothesized that patient's history of palliative operation, right sided aortic arch and residual VSD are possible factors affecting flow eccentricity and longstanding flow overload to AA. However, since only a few patients have these factors, statistical significance was difficult to be revealed. We also found that increased FD in patients group compared to healthy volunteers and aortic dilatation group compared to non-dilatation group, although without statistical significance. It might be because the FD is a normalized value by the aortic diameter. After normalization with significantly dilated aortic diameter, it might be difficult to show sufficient mean difference.
This study has several limitations. First, only 44 patients and 11 healthy volunteers were included. This small sample size was not sufficient to yield statistically significant results for some parameters such as history of palliative operation, right sided aortic arch and FD differences. So future study with larger sample size could clarify small mean difference and the possible factors more precisely. Second, we didn't predetermine the smallest sample size to show the differences between the two groups considering the statistical power when planning the study. However, in the analysis between healthy volunteers and patients group, we can obtain acceptable statistical power value of most significant parameters, which have p value less than 0.05. Third, inter-observer variability in 4D flow MRI analysis was not taken into account. Fourth, and most important, this was a cross-sectional study of adult patients with repaired TOF; therefore, the analysis could be performed only at a single time point, and a time-course analysis was not possible. Further longitudinal studies are needed to elucidate the relationship between WSS and progression of aortic dilatation. Particularly for patients with high WSS without aortic dilatation, future progression of aortic dilatation should be analyzed because of its intrinsic risk.
In conclusion, patients with repaired TOF have a dilated AA and secondarily decreased WSS. In addition to known risk factors for increased aortic flow, flow eccentricity may affect aortic dilatation in TOF patients.

Acknowledgments

We thank Professor Chi Young Shim (Division of Cardiology, Severance Cardiovascular Hospital, Department of Pediatrics, Yonsei University College of Medicine) for the valuable comments and Filippo Piatti (Department of Electronics, Informatics and Bioengineering, Politecnico di Milano, Italy) for the technical support.

Notes

This study was supported by the faculty research grant of Yonsei University College of Medicine (6-2014-0103).

Conflicts of Interest: The authors have no potential conflicts of interest to disclose.

References

1. Therrien J, Webb G. Clinical update on adults with congenital heart disease. Lancet. 2003; 362:1305–1313. PMID: 14575977.
crossref
2. Lillehei CW, Varco RL, Cohen M, Warden HE, Gott VL, DeWall RA, et al. The first open heart corrections of tetralogy of Fallot. A 26–31 year follow-up of 106 patients. Ann Surg. 1986; 204:490–502. PMID: 3767482.
3. Niwa K, Siu SC, Webb GD, Gatzoulis MA. Progressive aortic root dilatation in adults late after repair of tetralogy of Fallot. Circulation. 2002; 106:1374–1378. PMID: 12221055.
crossref
4. Mongeon FP, Gurvitz MZ, Broberg CS, Aboulhosn J, Opotowsky AR, Kay JD, et al. Alliance for Adult Research in Congenital Cardiology (AARCC). Aortic root dilatation in adults with surgically repaired tetralogy of Fallot: a multicenter cross-sectional study. Circulation. 2013; 127:172–179. PMID: 23224208.
5. Dodds GA 3rd, Warnes CA, Danielson GK. Aortic valve replacement after repair of pulmonary atresia and ventricular septal defect or tetralogy of Fallot. J Thorac Cardiovasc Surg. 1997; 113:736–741. PMID: 9104983.
crossref
6. Capelli H, Ross D, Somerville J. Aortic regurgitation in tetrad of Fallot and pulmonary atresia. Am J Cardiol. 1982; 49:1979–1983. PMID: 7081079.
crossref
7. Ordovas KG, Keedy A, Naeger DM, Kallianos K, Foster E, Liu J, et al. Dilatation of the ascending aorta is associated with presence of aortic regurgitation in patients after repair of tetralogy of Fallot. Int J Cardiovasc Imaging. 2016; 32:1265–1272. PMID: 27240599.
crossref
8. Rathi VK, Doyle M, Williams RB, Yamrozik J, Shannon RP, Biederman RW. Massive aortic aneurysm and dissection in repaired tetralogy of Fallot; diagnosis by cardiovascular magnetic resonance imaging. Int J Cardiol. 2005; 101:169–170. PMID: 15860407.
crossref
9. Kim WH, Seo JW, Kim SJ, Song J, Lee J, Na CY. Aortic dissection late after repair of tetralogy of Fallot. Int J Cardiol. 2005; 101:515–516. PMID: 15907429.
crossref
10. Markl M, Frydrychowicz A, Kozerke S, Hope M, Wieben O. 4D flow MRI. J Magn Reson Imaging. 2012; 36:1015–1036. PMID: 23090914.
crossref
11. Sievers HH, Putman LM, Kheradvar A, Gabbert D, Wegner P, Scheewe J, et al. 4D flow streamline characteristics of the great arteries twenty years after Lecompte and direct spiral arterial switch operation (DSASO) in simple TGA. Glob Cardiol Sci Pract. 2016; 2016:e201629. PMID: 29043274.
crossref
12. Meierhofer C, Schneider EP, Lyko C, Hutter A, Martinoff S, Markl M, et al. Wall shear stress and flow patterns in the ascending aorta in patients with bicuspid aortic valves differ significantly from tricuspid aortic valves: a prospective study. Eur Heart J Cardiovasc Imaging. 2013; 14:797–804. PMID: 23230276.
crossref
13. Rodríguez-Palomares JF, Dux-Santoy L, Guala A, Kale R, Maldonado G, Teixidó-Turà G, et al. Aortic flow patterns and wall shear stress maps by 4D-flow cardiovascular magnetic resonance in the assessment of aortic dilatation in bicuspid aortic valve disease. J Cardiovasc Magn Reson. 2018; 20:28. PMID: 29695249.
crossref
14. Piatti F, Sturla F, Bissell MM, Pirola S, Lombardi M, Nesteruk I, et al. 4D flow analysis of BAV-related fluid-dynamic alterations: evidences of wall shear stress alterations in absence of clinically-relevant aortic anatomical remodeling. Front Physiol. 2017; 8:441. PMID: 28694784.
crossref
15. Fong Y, Di C, Huang Y, Gilbert PB. Model-robust inference for continuous threshold regression models. Biometrics. 2017; 73:452–462. PMID: 27858965.
crossref
16. Gräfe D, Gutberlet M, Mende M, Dähnert I, Lücke C, Kostelka M, et al. Cross-sectional areas of the thoracic aorta in children and adolescents with repaired tetralogy of Fallot obtained by cardiac magnetic resonance angiography. J Thorac Imaging. 2018; 33:105–111. PMID: 29232281.
crossref
17. Niwa K. Aortic root dilatation in tetralogy of Fallot long-term after repair--histology of the aorta in tetralogy of Fallot: evidence of intrinsic aortopathy. Int J Cardiol. 2005; 103:117–119. PMID: 16080967.
crossref
18. Bonello B, Shore DF, Uebing A, Diller GP, Keegan J, Burman ED, et al. Aortic dilatation in repaired tetralogy of Fallot. JACC Cardiovasc Imaging. 2018; 11:150–152. PMID: 28412425.
crossref
19. Nagy CD, Alejo DE, Corretti MC, Ravekes WJ, Crosson JE, Spevak PJ, et al. Tetralogy of Fallot and aortic root dilation: a long-term outlook. Pediatr Cardiol. 2013; 34:809–816. PMID: 23080541.
crossref
20. Bieging ET, Frydrychowicz A, Wentland A, Landgraf BR, Johnson KM, Wieben O, et al. In vivo three-dimensional MR wall shear stress estimation in ascending aortic dilatation. J Magn Reson Imaging. 2011; 33:589–597. PMID: 21563242.
crossref
21. Barker AJ, Markl M, Bürk J, Lorenz R, Bock J, Bauer S, et al. Bicuspid aortic valve is associated with altered wall shear stress in the ascending aorta. Circ Cardiovasc Imaging. 2012; 5:457–466. PMID: 22730420.
crossref
22. Geiger J, Hirtler D, Gottfried K, Rahman O, Bollache E, Barker AJ, et al. Longitudinal evaluation of aortic hemodynamics in Marfan syndrome: new insights from a 4D flow cardiovascular magnetic resonance multi-year follow-up study. J Cardiovasc Magn Reson. 2017; 19:33. PMID: 28327193.
crossref
23. Farag ES, van Ooij P, Planken RN, Dukker KCP, de Heer F, Bouma BJ, et al. Aortic valve stenosis and aortic diameters determine the extent of increased wall shear stress in bicuspid aortic valve disease. J Magn Reson Imaging. 2018; 48:522–530. PMID: 29451963.
crossref
24. van Ooij P, Markl M, Collins JD, Carr JC, Rigsby C, Bonow RO, et al. Aortic valve stenosis alters expression of regional aortic wall shear stress: new insights from a 4-dimensional flow magnetic resonance imaging study of 571 subjects. J Am Heart Assoc. 2017; 6:pii: e005959.
crossref
25. Dyverfeldt P, Bissell M, Barker AJ, Bolger AF, Carlhäll CJ, Ebbers T, et al. 4D flow cardiovascular magnetic resonance consensus statement. J Cardiovasc Magn Reson. 2015; 17:72. PMID: 26257141.
crossref
26. Sigovan M, Hope MD, Dyverfeldt P, Saloner D. Comparison of four-dimensional flow parameters for quantification of flow eccentricity in the ascending aorta. J Magn Reson Imaging. 2011; 34:1226–1230. PMID: 21928387.
crossref
27. Garcia J, Barker AJ, Murphy I, Jarvis K, Schnell S, Collins JD, et al. Four-dimensional flow magnetic resonance imaging-based characterization of aortic morphometry and haemodynamics: impact of age, aortic diameter, and valve morphology. Eur Heart J Cardiovasc Imaging. 2016; 17:877–884. PMID: 26377908.
crossref

Supplementary Materials

The Data Supplement is available with this article at https://doi.org/10.3348/kjr.2019.0096.

Supplementary Fig. 1

4D flow data analysis. A. Cropping area including thoracic aorta. B. Obtaining best time frame (i.e., cardiac phase) when AA is best visualized. C. Automated segmentation of AA at every image slice of best time frame. D. Manual adjustment of region of interest after automated segmentation. E. Marking landmarks of pulmonary artery and 1st branch of AA. F. 3D iso-surface image acquisition. G. Semi-automating drawing of centerline when two points are marked. H. Acquisition of quantified 4D-flow data at desired cross-section. AA = ascending aorta, 3D = three-dimensional, 4D = four-dimensional
kjr-20-1334-s001.pdf

Supplementary Fig. 2

Smoothing spline curve in threshold regression test. Threshold WSS_mean value of 0.289 Pa and matched aortic dimension of 17.02 mm/m2 at AA level were obtained. WSS = wall shear stress
kjr-20-1334-s002.pdf

Supplementary Table 1

Characteristics of Subgroups Divided by WSS Threshold at AA
kjr-20-1334-s003.pdf
Fig. 1

Differences in aortic dimensions between patients with rTOF and healthy volunteers.

AA = ascending aorta, DA = descending aorta, rTOF = repaired tetralogy of Fallot, STJ = sinotubular junction
kjr-20-1334-g001
Fig. 2

Representative maximal WSS maps of volunteers and patients with rTOF.

A. Volunteer. B. Aortic dilatation with high WSS group. C. Aortic dilatation with low WSS group. D. Non-aortic dilatation with low WSS group. E. Non-aortic dilatation with high WSS group. WSS = wall shear stress
kjr-20-1334-g002
Table 1

Definitions of Hemodynamic Parameters in 4D Flow MRI (14252627)

kjr-20-1334-i001
Parameter Definition
WSS Viscous shear forces of flowing blood acting tangentially with respect to vessel wall
WSS_max Maximum value of magnitude of WSS vector on considered cross-section
WSS_mean Mean value of magnitude of WSS vector on considered cross-section
WSS_ax Mean value of axial component of WSS, i.e., component with direction parallel to main direction of vessel, on considered cross-section
WSS_cir Mean value of circumferential component of WSS, i.e., component with direction orthogonal to main direction of vessel, on considered cross-section
FJA Angle between mean vector of peak systolic flow and normal to cross-sectional plane
FD Distance between center of lumen and center of velocity of forward flow, which was normalized to lumen diameter

FD = flow displacement, FJA = flow jet angle, WSS = wall shear stress, 4D = four-dimensional

Table 2

Comparison of Demographic Characteristics and Aortic Dimensions between Volunteers and Patients with Repaired TOF

kjr-20-1334-i002
Characteristics Healthy Volunteers (n = 11) Patients with Repaired TOF (n = 44) P
Men, % 90.9 56.8 0.037
Age, years 33.7 ± 8.8 28.9 ± 8.4 0.121
Aortic diameters/BSA, mm/m2
 Aortic sinus 18.5 ± 2.2 22.1 ± 4.0 0.002
 STJ 14.0 ± 2.1 20.0 ± 3.6 < 0.001
 Mid AA 15.2 ± 2.6 17.8 ± 3.2 0.013
 Proximal descending aorta 11.3 ± 1.3 11.1 ± 1.3 0.966
 Distal descending aorta 10.7 ± 1.9 10.3 ± 1.5 0.643

AA = ascending aorta, BSA = body surface area, STJ = sinotubular junction, TOF = tetralogy of Fallot

Table 3

Comparison of 4D Flow Hemodynamic Parameters between Volunteers and Patients with Repaired TOF

kjr-20-1334-i003
Parameters Healthy Volunteers (n = 11) Patients with Repaired TOF (n = 44) P
STJ
 V_max, m/s 127.6 ± 18.7 98.9 ± 27.8 0.002
 V_mean, m/s 83.2 ± 17.6 51.2 ± 16.7 < 0.001
 FJA 7.2 ± 3.3 15.8 ± 8.8 < 0.001
 FD 0.116 ± 0.075 0.128 ± 0.075 0.817
 WSS_max, Pa 1.020 ± 0.160 0.784 ± 0.286 0.003
 WSS_mean, Pa 0.495 ± 0.074 0.324 ± 0.150 < 0.001
 WSSax_mean, Pa 0.196 ± 0.056 0.158 ± 0.100 0.023
 WSScir_mean, Pa 0.396 ± 0.068 0.228 ± 0.110 < 0.001
AA
 V_max, m/s 114.0 ± 15.5 103.1 ± 72.1 0.003
 V_mean, m/s 69.8 ± 11.5 47.3 ± 11.5 < 0.001
 FJA 7.7 ± 4.9 16.5 ± 12.0 0.003
 FD 0.100 ± 0.072 0.118 ± 0.074 0.344
 WSS_max, Pa 0.770 ± 0.167 0.880 ± 0.508 0.736
 WSS_mean, Pa 0.345 ± 0.065 0.303 ± 0.101 0.053
 WSSax_mean, Pa 0.114 ± 0.046 0.149 ± 0.103 0.239
 WSScir_mean, Pa 0.279 ± 0.077 0.215 ± 0.068 0.016

V_max = maximum velocity, V_mean = mean velocity

Table 4

Relationship of Cardiac MRI and Clinical Parameters with Aortic Dimensions

kjr-20-1334-i004
Parameter Rho (95% CI) P
STJ dimension, mm/m2
 WSS_max -0.365 (-0.598– -0.078) 0.015
 WSS_mean -0.454 (-0.662– -0.182) 0.002
 WSSax_mean -0.328 (-0.569– -0.034) 0.030
 WSScir_mean -0.463 (-0.668– -0.192) 0.002
 FJA 0.032 (-0.268–0.326) 0.837
 FD 0.050 (-0.251–0.341) 0.750
 V_max -0.158 (-0.435–0.145) 0.305
 V_mean -0.455 (-0.662– -0.182) 0.002
AA dimension, mm/m2
 WSS_max 0.164 (-0.140–0.440) 0.287
 WSS_mean -0.339 (-0.578– -0.047) 0.024
 WSSax_mean -0.092 (-0.379–0.210) 0.551
 WSScir_mean -0.431 (-0.645– -0.154) 0.004
 FJA 0.292 (-0.005–0.542) 0.054
 FD 0.293 (-0.004–0.543) 0.054
 V_max 0.227 (-0.075–0.491) 0.139
 V_mean -0.613 (-0.770– -0.386) < 0.001

CI = confidence interval

Table 5

Comparison between Aortic Dilatation and Non-Dilatation Groups

kjr-20-1334-i005
Characteristics AA Dilatation Group* (n = 23) AA Non-Dilatation Group (n = 21) P
SOV diameter, mm/m2 22.9 (21.8–25.4) 19.9 (17.9–21.2) < 0.001
STJ diameter, mm/m2 19.9 (18.2–21.8) 16.4 (15.6–18.4) < 0.001
AA diameter, mm/m2 19.3 (18.0–20.6) 16.1 (14.4–16.6) < 0.001
Male sex 13 (56.5%) 12 (57.1%) 0.791
Age 27.5 (23.5–34.0) 25.0 (22.0–31.0) 0.179
Palliative Op. 1 (4.3%) 3 (14.3%) 0.526
Age at TOF repair, years 4 (1.0–8.5) 2 (1.0–2.25) 0.039
Rt. aortic arch 6 (26.1%) 6 (28.6%) 0.879
Residual VSD 1 (4.3%) 3 (14.3%) 0.530
AR (≥ grade 1) 4 (17.4%) 1 (4.8%) 0.401
FD at STJ 0.145 (0.0778–0.1973) 0.085 (0.0636–0.1540) 0.080
FJA at STJ 17.0 (10.3–19.9) 12.6 (8.3–19.5) 0.503
FD at AA 0.122 (0.062–0.192) 0.100 (0.057–0.117) 0.217
FJA at AA 17.2 (12.1–25.7) 10.1 (6.3–13.8) 0.003
WSS_mean at STJ 0.256 (0.185–0.372) 0.314 (0.275–0.528) 0.018
WSS_max at STJ 0.637 (0.483–0.796) 0.886 (0.792–1.016) 0.002
WSS_mean at AA 0.254 (0.220–0.325) 0.322 (0.254–0.352) 0.040
WSS_max at AA 0.667 (0.582–0.902) 0.842 (0.717–0.990) 0.062
V_mean at AA, cm/sec 38.6 (36.0–49.1) 54.2 (47.7–60.0) < 0.001
V_max at AA, cm/sec 88.7 (68.0–110.7) 95.7 (86.1–107.5) 0.076
LVEDVi, mL/m2 83.2 (78.1–94.1) 77.2 (67.7–84.7) 0.053
LVEF, % 58.1 (53.6–64.7) 59.5 (53.0–62.5) 0.549
RVEDVi, mL/m2 138.8 (126.6–164.6) 119.3 (111.9–147.6) 0.307
RVEF, % 55.1549 (49.9892–60.7542) 50.7118 (48.0462–54.6202) 0.069

Other data are medians, with interquartile ranges in parentheses. *AA dilatation threshold value = 17.02 mm/m2, Data are numbers, with percentage in parentheses. AR = aortic regurgitation, LVEDVi = indexed left ventricular end-diastolic volume, LVEF = left ventricular ejection fraction, Op. = operation, RVEDVi = indexed right ventricular end-diastolic volume, RVEF = right ventricular ejection fraction, SOV = sinus of Valsalva, VSD = ventricular septal defect

TOOLS
Similar articles