

 PDF
PDF ePub
ePub Citation
 Print
Print


INTRODUCTION
Pulmonary arterial hypertension (PAH) is a fatal disease, characterized by elevation of the pulmonary artery pressure.1) PAH is a multifactorial disease involving endothelial dysfunction and pulmonary arteriole remodeling.2) Many signaling molecules, including endothelin (ET)-1, ET receptor, and the endothelial-derived vasoactive molecules such as nitric oxide, play a critical role in the pathophysiology of the disease.3)
ET-1 is a strong vasoconstrictor that induces proliferation of vascular smooth muscle cells,4) and has been targeted for therapy of numerous hypertensive diseases. ET-1 exerts pathophysiological changes in PAH by stimulating the constriction of pulmonary vessels and uncontrolled proliferation of vascular smooth muscle cells. The ET system is activated in plasma and lung tissues in both the PAH animal model as well as in PAH patients.5) Cells exhibit 2 types of receptors to facilitate binding of ET: type A and B. Smooth muscle cells express both type A and B, whereas endothelial cells express only type A receptors. Stimulation of ET receptors type A and B on the surface of smooth muscle cell promotes vasoconstriction and proliferative effects of ET. However, stimulation of the ET receptor type B induces production of nitric oxide and prostacyclin, which in turn induce vasodilation and anti-proliferating effects.6)
Endothelial nitric oxide synthase (eNOS) and nicotinamide adenine dinucleotide phosphate oxidase (NOX) modulate reactive oxygen species, stimulation of vasoconstriction and vascular remodeling in PAH.7) In the experimental PAH model, there is increased expression and activity of NOX4, which is identified to be responsible for modulating the production of the reactive oxygen species.8) In our previous study, we noticed that NOX4 protein expression level was increased by ET-1 treatment in pulmonary arterial smooth muscle cells.9) It has also been found that ET-1 increases vascular superoxide via NOX in deoxycorticosterone acetate–salt hypertension rat model.10) Likewise, lung biopsy samples from PAH patients also reveal an imbalance in the levels of reactive oxygen species.11)
Ambrisentan, an orally active diphenyl propionic acid derivative, is a potent ET receptor type A selective antagonist, having a half-life of 9 to 15 hours, that enables a once-daily dosing.12)13)
However, to date, there are no reports on the effect of ambrisentan on NOX4. Therefore, we considered it worthwhile to investigate the effects of ambrisentan treatment on NOX4 production in animal models. This study therefore investigated the effects of ambrisentan by evaluating the pathophysiology in PAH.
METHODS
Animals
Six-week old male Sprague Dawley rats were purchased from Orient Bio (Orient Bio Inc., Seongnam, Korea). The rats were maintained under climate-controlled conditions with a 12:12-hour light:dark cycle, with free access to standard chow and water. All animals were treated in accordance with the guidelines of the Institutional Animal Care and Use Committee (IACUC) at the Ewha Womans University (IACUC approval No. ESM16-0356).
Experimental protocols
The rats were classified into 3 groups: control group (C), monocrotaline group (M) and ambrisentan group (Am). Saline was injected subcutaneously to the C. To the both M and Am, monocrotaline (MCT) 60 mg/kg were injected subcutaneously at day 0. Subsequently, from day 1 onwards, ambrisentan was administered (0.2 mg/kg, per os) to the Am group, every day for 4 weeks. The rats were sacrificed at weeks 2 and 4. Body and organ weight were measured, and the ratio was calculated as follows; organ / body weight (g) ×10000. The tissues were harvested and immediately frozen in liquid nitrogen for western blot, or fixed in 10% formalin for pathological examination.
Hemodynamics
To evaluate the effects of ambrisentan, right ventricle (RV) pressure was measured in anesthetized rats. Briefly, the rats were anesthetized and placed on a thermostatically controlled heating box for maintaining the body temperature. A catheter was inserted into the right external jugular vein, and the mean RV pressure was measured in this study.
Pathological changes in the pulmonary arteries
For histopathological evaluation, the lung tissues were embedded in paraffin and sectioned. The sections were cut into 3–5 μm thickness and stained with hematoxylin-eosin and Victoria blue. More than 20 fields of pulmonary arterioles ranging 25–100 μm in diameter were observed. This method was based on our previous reports.14)
Western blot analysis
The harvested tissues were homogenized in lysis buffer (Proprep; IntRON Biotechnology, Gyeonggi, Korea) on ice. After 1 hour, the samples were centrifuged at 12,000 rpm in 4°C. The protein content in supernatant was quantified with an enzyme-linked immunosorbent assay reader (Molecular Devices, Sunnyvale, CA, USA) at 562 nm, based on a bovine serum albumin (BSA) standard curve. The amount of supernatant containing 25–35 μg of protein was used for 8–12% sodium dodecyl sulfate polyacrylamide gel electrophoresis. Proteins resolved on the acrylamide gel by electrophoresis were transferred onto nitrocellulose membranes. The membranes were blocked with 5% BSA in tris-buffered saline containing 0.1% tween 20, for 1 hour at room temperature. Membranes were then washed, incubated overnight at 4°C with appropriate primary antibodies of ET-1 (Abcam, Cambridge, MA, USA), endothelin receptor A (ERA; Santa Cruz Biotechnology, Santa Cruz, CA, USA), eNOS (Santa Cruz Biotechnology) and NOX4 (Santa Cruz Biotechnology) separately, after which the probed membranes were incubated with the corresponding secondary antibodies. Membranes were then washed and visualized by subjecting to a chemiluminescent reaction using an enhanced chemiluminescence detection kit (GE Healthcare, Piscataway, NJ, USA).
Statistical analysis
Statistical analysis was performed using PRISM 5 (GraphPad Software, San Diego, CA, USA). A Kruskal-Wallis test was used for the comparison of differences in the 3 groups and a Mann-Whitney test was used for comparisons between groups with Bonferroni correction. Animals were randomized within each experimental group. All data are presented as mean±standard deviation. A p value of <0.05 is considered statistically significant.
RESULTS
RV pressure in 3 groups
MCT administration significantly increased the RV pressure in the M as compared to the C at weeks 2 (C vs. M; 10.33±1.76 mmHg vs. 27.00±1.47 mmHg, p=0.001) and 4 (C vs. M; 12.33±0.33 mmHg vs. 32.40±0.76 mmHg, p<0.001). Early concurrent oral administration of ambrisentan significantly decreased the right ventricular systolic pressure at weeks 2 (M vs. Am; 27.00±1.47 mmHg vs. 16.60±0.40 mmHg, p<0.001) and 4 (M vs. Am; 32.40±0.76 mmHg vs. 14.67±0.80 mmHg, p<0.001) (Figure 1).
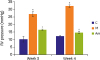 | Figure 1RV pressure in MCT-induced PAH model after ambrisentan treatment. RV pressure increased in the M compared to the C at weeks 2 and 4. The RV pressure decreased in the Am compared with the M at weeks 2 and 4.RV = right ventricle; MCT = monocrotaline; PAH = pulmonary arterial hypertension; C = control group; M = monocrotaline group; Am = ambrisentan group.
*p<0.05 as compared with the C; †p<0.05 as compared with the M.
|
Changes of the body weight in 3 groups
At week 4, the body weight (BW) decreased significantly in the M group as compared to the C group (C vs. M; 441.25±7.77 g vs. 327.30±9.92 g, p<0.001). Recovery in the BW was observed in the Am group at week 4 (M vs. Am; 327.30±9.92 g vs. 394.33±10.82 g, p<0.001) (Table 1). With the onset of RV hypertrophy, the RV/[left ventricle (LV)+septum (S)] weight ratio increased in the M at weeks 2 (C vs. M; 0.30±0.02 vs. 0.41±0.02, p=0.005) and 4 (C vs. M; 0.32±0.02 vs. 0.93±0.09, p<0.001), which decreased significantly in the Am at weeks 2 (M vs. Am; 0.41±0.02 vs. 0.36±0.01, p=0.035) and 4 (M vs. Am; 0.93±0.09 vs. 0.61±0.04, p=0.007). Furthermore, the RV weight/BW ratio decreased in the Am at week 4 (M vs. Am; 19.80±1.73 vs. 13.82±0.85, p=0.010).
Table 1
Changes of BW and organ weight/BW ratio after low-dose ambrisentan treatment

BW = body weight; RV = right ventricle; LV = left ventricle; S = septum; K = kidney; C = control group; M = monocrotaline group; Am = ambrisentan group.
*p<0.05 as compared with the C; †p<0.05 as compared with the M.
![]()
The lung weight/BW ratio increased in the M at week 4 (C vs. M; 39.18±1.30 vs. 68.01±2.17, p<0.001), and decreased in the Am (M vs. Am; 68.01±2.17 vs. 55.64±3.22, p=0.014) (Table 1).
Lung pathology in 3 groups
MCT-induced PAH resulted in pulmonary arteriole remodeling, characterized by medial wall thickening and angiogenesis. The lung pathology data are presented in Figure 2. Compared to the C, increased medial wall thickness was observed in the M at weeks 2 (C vs. M; 21.99±1.95 vs. 38.43±0.94, p<0.001) and 4 (C vs. M; 23.60±2.17 vs. 38.25±0.66, p<0.001). The number of intra-acinar arteries also increased in the M at weeks 2 (C vs. M; 0.70±0.14 vs. 1.60±0.12, p=0.002) and 4 (C vs. M; 0.77±0.14 vs. 2.05±0.08, p<0.001). Conversely, medial wall thickening and angiogenesis decreased in the Am. Medial wall thickness decreased in the Am at week 4 (M vs. Am; 38.25±0.66 vs. 33.58±1.78, p=0.008), and the number of intra-acinar arteries also decreased in the Am at week 4 (M vs. Am; 2.05±0.08 vs.1.50±0.13, p=0.008).
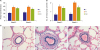 | Figure 2Pulmonary pathology in MCT-induced PAH model after ambisentan treatment (400× images). (A, C) Pulmonary arteriole medial wall thickness was decreased in the Am at week 4. (B) The number of intra-acinar arteries was reduced in the Am at week 4.MCT = monocrotaline; PAH = pulmonary arterial hypertension; C = control group; M = monocrotaline group; Am = ambrisentan group.
*p<0.05 as compared with the C; †p<0.05 as compared with the M.
|
ET-1 and ERA protein expression levels in lung tissues in 3 groups
Administration of MCT injection significantly increased the ET-1 and ERA protein expression levels from week 1 (Figure 3 and 4). However, ambrisentan treatment resulted in decreased ET-1 expression as compared to the M at week 2 (M vs. Am; 2.03±0.43 vs. 1.28±0.19, p=0.025) and 4 (M vs. Am; 1.45±0.21 vs. 0.96±0.06, p=0.043). The protein expression levels of ERA also decreased at week 4 (M vs. Am; 2.93±0.48 vs. 0.98±0.30, p=0.006).
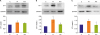 | Figure 3ET-1 protein expression level in lung tissues of MCT-induced PAH model after ambrisentan treatment. ET-1 protein expression decreased significantly in lung tissues of PAH rat model 2 weeks after ambrisentan treatment.ET = endothelin; MCT = monocrotaline; PAH = pulmonary arterial hypertension; C = control; M = monocrotaline; Am = ambrisentan.
*p<0.05 as compared with the C; †p<0.05 as compared with the M.
|
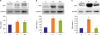 | Figure 4ERA protein expression level in lung tissues of MCT-induced PAH model after ambrisentan treatment. ERA protein expression decreased in lung tissues of PAH rat model 4 weeks after ambrisentan treatment.ERA = endothelin receptor A; MCT = monocrotaline; PAH = pulmonary arterial hypertension; C = control; M = monocrotaline; Am = ambrisentan.
*p<0.05 as compared with the C; †p<0.05 as compared with the M.
|
eNOS protein expression levels in the lung tissues in 3 groups
Decrease in the eNOS protein level was observed in the M, as compared with the C, from week 1 (Figure 5). The decreased eNOS levels were dramatically recovered in the Am at weeks 2 (M vs. Am; 0.46±0.02 vs. 0.87±0.07, p<0.001) and 4 (M vs. Am; 0.10±0.02 vs. 0.69±0.21, p=0.004).
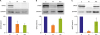 | Figure 5eNOS protein expression level in lung tissues of MCT-induced PAH model after ambrisentan treatment. Two weeks after ambrisentan treatment, eNOS protein expression increased significantly compared with the M in lung tissues of MCT-induced PAH rat model.eNOS = endothelial nitric oxide synthase; MCT = monocrotaline; PAH = pulmonary arterial hypertension; C = control group; M = monocrotaline group; Am = ambrisentan group.
*p<0.05 as compared with the C; †p<0.05 as compared with the M.
|
NOX4 protein expression levels in the lung tissues in 3 groups
Protein expression level of NOX4 increased at weeks 2 (C vs. M; 1.00±0.00 vs. 1.74±0.17, p=0.005) and 4 (C vs. M; 1.00±0.00 vs. 1.54±0.14, p=0.007). However, no subsequent changes of NOX4 protein expression levels were observed after ambrisentan administration (Figure 6).
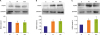 | Figure 6NOX4 protein expression in lung tissues of MCT-induced PAH model level after ambrisentan treatment. There were no significant changes in NOX4 protein expression level.NOX = nicotinamide adenine dinucleotide phosphate oxidase; MCT = monocrotaline; PAH = pulmonary arterial hypertension; C = control; M = monocrotaline; Am = ambrisentan.
*p<0.05 as compared with the C.
|
DISCUSSION
Taken together, our results show that oral administration of low-dose ambrisentan effectively recovers or slows down the progression of PAH in the MCT-induced animal model. Ambrisentan is an established drug used in the multifactorial disease PAH, but efficacy of low dose treatments in an animal model is yet to be researched. In this study, the administration of ambrisentan, an ETA-selective receptor antagonist, improved the RV pressure and pulmonary pathology, and induced changes in the expression levels of proteins involved in vasoconstriction in the lung tissues of MCT-induced PAH rat model.
Results from the current study reveal that oral administration of low dose ambrisentan reduced the RV pressure and RV hypertrophy at weeks 2 and 4 after administration. Recovery in the BW, and decrease in the medial wall thickness of pulmonary arteriole and the number of intra-acinar arteries were observed at week 4. Protein expression levels of ET-1 and eNOS were recovered in the lung tissues of MCT-induced PAH rat model at weeks 2 and 4, whereas protein expression of ERA was decreased at week 4. However, the NOX4 expression remained unchanged in the lung tissues of MCT-induced PAH rat after ambrisentan administration.
In the present and previous studies, ET-1 and ERA protein expression levels were increased at weeks 2 and 4 after MCT injection, suggesting their importance in the progression of cardiopulmonary pathology in MCT-induced PAH rat model.14) In the 2016 study by Lee et al.15), plasma ET-1 levels were found to be significantly increased in the MCT model.16) The protein expression level of eNOS decreased from 1 week after the MCT injection, whereas the NOX4 protein level was increased at week 4 in lung tissues of the MCT treated rat model. The 2016 study by Lee et al.15) further reported that eNOS protein expression level in lung tissues was significantly decreased, and plasma cyclic guanosine monophosphate level was also decreased in the MCT rat model.17) However, other studies have reported increased eNOS expression level in PAH. It is thought that the changes in the expression correspond to the progression of the disease.18)
Elevated expression of the NOX4 protein in lung tissues were observed at weeks 2 and 4 in the MCT-induced PAH rat model. The 2017 study by Wu et al.19) reported increased expression levels of the NOX2 and NOX4 proteins. Since NOX4 is the major isoform expressed in PAH, its increased level have been reported in the lung tissues of PAH patients.20) Furthermore, elevated levels of NOX4 were also reported in the endothelium and fibroblasts of pulmonary arteries.21) They suggested the involvement of NOX4 in the characteristic changes associated with fibroblasts, vascular remodeling and development of PAH.22)
The present study revealed attenuation of RV pressure, RV hypertrophy and pulmonary arteriole vessel wall thickening after treatment of ambrisentam. The effect of ambrisentan in this study was similar to that of bosentan in our previous study, with respect to lowering the RV pressure at week 4.23) This finding is consistent with a previous report by Kosanovic et al.24) in 2011, who reported that a selective ERA antagonist TBC3711 improved the ratio of RV/(LV+S) weight, RV weight and medial wall thickness of pulmonary arterioles in the MCT-induced PAH model. The ET-1 and ERA protein expression levels were significantly reduced after a 4-week treatment of ambrisentan in our study, indicating that the inhibitory effects of ambrisentan in the MCT model influenced not only ERA inhibition but also the protein expression levels of ET-1, ERA and eNOS. A 2003 study by Jasmin et al.25) revealed significant increase in the endothelin receptor B (ERB) density in RV tissues of the MCT model but interestingly, the altered ET system was attenuated by a selective ERA antagonist. In the current study, the protein expression level of eNOS recovered in the Am at weeks 2 and 4. Nitric oxide is a well-known vasodilator generated by eNOS, and the imbalance of this enzyme elicits abnormal blood pressure.26) In another study by Dubois et al.,27) impaired eNOS activity resulted in the dysregulation of vascular tone, leading to PAH. Our current study demonstrates that the ETA blocker ambrisentan effectively alleviates eNOS expression in lung tissues.
The half-life of ambrisentan is longer than that of the other drugs (15 hours); the half-life of bosentan and sitaxsentan is 5.4 and 10 hours, respectively.27) However, it is still controversial as to which type of blocker is more beneficial for the treatment of PAH: the ERA selective blocker or the dual receptor blocker. Theoretically, an ERA selective blocker, such as ambrisentan, acts on the ETA in vascular smooth muscle cells and inhibits vasoconstriction and mitogenic effects. On the other hand, an ERA/ERB dual blocker, such as bosentan, acts not only on the smooth muscle cells but also on ERB in endothelial cells, and suppresses vasodilation by ET clearance and inhibiting the activation of nitric oxide and prostacyclin.13)
Although an approved drug in experimental and clinical pulmonary hypertension, low-dose administration of ambrisentan has not been studied in animal models. Ambrisentan (Letaris®; Gilead, Foster City, CA, USA; Volbris®; GSK, Brentford, UK) was approved by the United States Food and Drug Administration in 2007. Oral administration of 5–10 mg/day dose is recommended for humans, and 10–15 mg/kg/day dose is mainly used in animal efficacy studies.28) Ambrisentan is known to improve hemodynamic changes and to increase the exercise capacity in patients with PAH.29) In this study, administration of 0.2 mg/kg/day ambrisentan showed efficacy in improving the RV pressure, pulmonary pathological changes, and eNOS levels in lung tissues. The 2015 study by Iglarz et al.30) reported that 1 mg/kg dose of ambrisentan decreased the mean pulmonary artery pressure to 11 mmHg in the Dahl salt-sensitive rat model. These studies clearly indicate that low dose ambrisentan effectively decreases the RV pressure and reduces the progression of medial wall thickening of pulmonary arterioles in the MCT-induced PAH rat model.
In conclusion, MCT-induced PAH rats have characteristic RV hypertrophy and PAH. Imbalance of ET-1, ERA, eNOS and NOX4 protein expression levels are also observed in the lungs of MCT induced PAH rats, suggesting that excessive pulmonary artery contraction may be involved in the ET-1 pathway.
Our study revealed that treatment with low dose ambrisentan suppresses the ET-1 and ERA levels, and improves the eNOS level in the lung tissue of MCT-induced PAH rats. Further research is required to identify the optimum dosage of ambrisentan, and evaluate its dose-dependent effects in low dose treatment.
 XML Download