

 PDF
PDF ePub
ePub Citation
 Print
Print


INTRODUCTION
The goal of root coverage procedures in periodontal surgery is to regenerate the periodontal supporting tissues, such as connective-tissue attachments, cementum, and the alveolar bone. However, conventional treatments yield a wide spectrum of outcomes, ranging from the formation of new attachments to the formation of long junctional epithelia [1]. Guided tissue regeneration has been considered the most successful of these conventional periodontal treatment modalities, since it provides space for the ingrowth of progenitor cells with the use of a barrier membrane. Even though excellent preclinical and clinical outcomes in resolving intrabony and furcation defects have demonstrated the successful results that can be obtained by using guided tissue regeneration, the sensitivity of this technique has also produced a wide range of clinical outcomes, including membrane exposure and postoperative infections resulting in the severe loss of periodontal structures [23].
Novel research methods using progenitor cells have also produced histologic evidence of the formation of new periodontal attachments, albeit with some limitations [4567891011]. In our previous in vivo experiment, periodontal attachments between bone and dental root surfaces were formed de novo in a replanted tooth model by directly adhering cultured periodontal ligament (PDL) progenitor cells onto the root surface [12]. However, this regenerated tissue clearly differed from the pristine PDL in terms of both its thickness and density, and in the orientation and insertion into both sides of the bone and root cementum. No previous study has utilized an appropriate methodology or scaffolding biomaterial for carrying cells, which might explain the aforementioned limitations.
Collagen matrix has recently been introduced in clinical applications for focused indications of root coverage and gingival augmentation based on its ability to provide space for soft-tissue augmentation, as demonstrated in several preclinical studies [131415]. Collagen matrix is a candidate carrier of progenitor cells in dehiscence defects, such as in root coverage techniques with the goal of achieving genuine periodontal regeneration, rather than simply periodontal repair.
With this theoretical background, it was hypothesized that PDL progenitor cells carried by a collagen substitute can promote the formation of periodontal attachments at periodontally impaired root surfaces. Therefore, the purpose of this study was to obtain histologic measurements of periodontal healing after applying a collagen matrix with or without PDL progenitor cells to a dehiscence defect model in beagle dogs.
MATERIALS AND METHODS
Animals
Six male beagle dogs (15–20 months old, weighing 10 kg) with complete dentition and a sound periodontium were used in this study. The animal selection, supervision, preparation, and surgical protocols were approved by the Animal Care and Use Committee of Yonsei Medical Center, Seoul, Korea (Approval No. 2015-0233).
PDL progenitor cell culture
We used the bilateral maxillary first molars for the primary culture of PDL progenitor cells. After meticulously removing dental plaque and calculus and applying iodopovidone, the teeth were sectioned and then gently extracted under combined general and local anesthesia. The isolation and culturing of PDL progenitor cells were performed using protocols that we have described previously [12]. In summary, the PDL was carefully isolated from the root surface at the apical and middle regions of the dental roots using a scalpel, and we ground the tissue into pieces that were as small as possible. The ground PDL was dissolved for five 30-minute periods in α-Minimum Essential Medium (α-MEM; Gibco, Grand Island, NY, USA) including 100 U/mL type I collagenase (Wako, Tokyo, Japan) and 2.5 U/mL dispase (Gibco) at 37°C. Single-cell suspensions were acquired by passing the solution through a strainer with a 70 μm pore size (Falcon, BD Labware, NJ, USA). Then, 5×10⁵ cells were scattered on cell-culture flasks (T75, BD Biosciences, NJ, USA) including α-MEM with the addition of 100 μM L-ascorbic acid 2-phosphate (Sigma-Aldrich, MO, USA), 2 μM L-glutamine (Gibco), 100 μg/mL streptomycin (Gibco), 100 U/mL penicillin, and 15% fetal bovine serum (FBS; Gibco). After that, the cells were cultivated at 37°C with 5% CO2 atmosphere. After 3–7 days, single-cell colonies were discovered and we cultivated PDL progenitor cells at passage P0. We used P3 and P4 cells for the experiment.
Characteristics of isolated PDL progenitor cells
Colony-forming-units assay
We plated the cells at 1×10³ cells/10 mL on the 100-mm culture dishes (Nunc; Thermo Scientific, Waltham, MA, USA) with growth medium. Fixation was conducted with 4% formaldehyde. Staining was performed with crystal violet (Sigma-Aldrich). At 14 days after seeding, we observed the cells with light microscopy (CK40; Olympus Optical, Tokyo, Japan).
Osteogenic and adipogenic differentiation
We scattered the cells in 6-well plates (Nunc; Thermo Scientific) with a density of 1×10⁵ cells/well and cultivated them until they reached a subconfluent condition. We used osteogenic differentiation culture medium composed of α-MEM, including 2 mM β-glycerophosphate (Sigma-Aldrich), 10–8 M dexamethasone (Sigma-Aldrich), 1.8 mM KH2PO4 (Sigma-Aldrich), 2 mM L-glutamine (Gibco), 15% FBS (Gibco), 100 U/mL penicillin (Gibco), 100 mg/mL streptomycin (Gibco), 100 mM L-ascorbic acid 2-phosphate, and 55 mM 2-mercaptoethanol (AMRESCO, Solon, OH, USA). The culture medium was refreshed at 3-day intervals. The adipogenic differentiation culture medium was composed of α-MEM, including 5 mM hydrocortisone (Sigma-Aldrich), 60 mM indomethacin (Sigma-Aldrich), 500 mM isobutyl-methylxanthine (Sigma-Aldrich), 10 mM insulin (Sigma-Aldrich), 100 mM L-ascorbic acid 2-phosphate, 15% FBS, 2 mM L-glutamine, 100 mg/mL streptomycin, and 100 U/mL penicillin. Osteogenic differentiation was achieved after 2 weeks and adipogenic differentiation was achieved after 4 weeks. Staining of the cells to evaluate osteogenic differentiation was performed with alizarin red (Sigma-Aldrich), and staining for adipogenic differentiation was performed using Oil Red O (Sigma-Aldrich).
Collagen matrix as a carrier of PDL progenitor cells
The collagen matrix (20 mm×40 mm×2 mm; Collagen Graft, Genoss, Suwon, Korea) consisted of 2 pure bovine collagen layers differing in density: a thick spongious layer and a thin compact layer [14]. For evaluating progenitor cell adhesion, scanning electron microscopy (SEM; S-300N, Hitachi, Tokyo, Japan) was applied after a short period of incubation (0, 10, or 30 minutes) following cell seeding (1×10⁶ cells) to a collagen matrix of standardized size (10 mm×10 mm).
Study design and protocols
A surgically created dehiscence model was used, and the following 3 experimental groups were constructed:
• Sham control (CTL) group, in which a dehiscence defect was induced but had no biomaterial grafted into it.
• Collagen matrix (COL) group, in which a dehiscence defect was induced and grafted with collagen matrix.
• PDL progenitor cells with collagen matrix (COL/CELL) group, in which a dehiscence defect was induced and grafted with PDL progenitor cells carried by a collagen matrix.
The bilateral first, second, and third maxillary premolars of the 6 beagle dogs were involved in this experiment, and the 3 groups were allocated rotationally to ensure an even distribution of experimental sites for each group. Single roots of the first premolar and both mesial and distal roots of the second/third premolars were included, but the individual teeth were involved as the experimental unit for each group. The numerical distribution of the involved teeth was even for each group, and 12 teeth (20 dental roots) were included in 6 animals.
After elevating a full-thickness mucoperiosteal flap in the experimental region, dehiscence defects with a standardized size (5 mm long) were surgically created in all dental roots of the included premolars. Alveolar bone was carefully removed using a diamond bur attached to a high-speed rotary tool to expose the dental root surface over a length of 5 mm from the cementoenamel junction (CEJ), and the surface was finally planed using hand-operated instruments to completely remove the pre-existing cementum. The experimental biomaterial was applied onto the dehiscence defect area as appropriate for the allocated group for each site, with collagen matrix trimmed to the standardized size (10 mm×10 mm) in the COL and COL/CELL groups, and incubated for 30 minutes after seeding 1×10⁶ PDL progenitor cells on the collagen matrix in the COL/CELL group. The mucoperiosteal flap was relocated and sutured closely at the CEJ, enveloping the grafted materials by applying a monofilament nylon suture (Monosyn, B. Braun, Melsungen, Germany) (Figure 1). A commonly-used intramuscular antibiotic (cefazoline sodium [20 mg/kg]; Yuhan, Seoul, Korea) was given to the dogs. Additionally, they received 0.2% chlorhexidine solution (hexamidine; Bukwang Pharmaceutical, Seoul, Korea) for 14 days. We removed the monofilament nylon suture material 7 days after surgery.
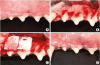 | Figure 1Clinical photographs of the surgical procedure. (A) Preoperative view of the first, second, and third premolars. (B) A dehiscence defect with a size of 5×5 mm (width × length) was surgically created. (C) Each site of the dehiscence defect was grafted with collagen matrix with PDL progenitor cells (COL/CELL group), grafted with collagen matrix alone (COL group), or left without any material (CTL group). (D) Primary closure was then performed.COL group: collagen matrix group, COL/CELL group: PDL progenitor cells with collagen matrix group, PDL: periodontal ligament, CTL group: sham control group.
|
Histologic processing
Eight weeks after surgery, the dogs were sacrificed by administering an overdose of pentobarbital sodium (90–120 mg/kg intravenously; Entobar; Hanlim Pharmaceutical, Seoul, Korea). The fixation of block sections containing the study sites was performed for 10 days with 10% neutral buffered formalin. All the sites of the experimental and control groups were dissected along with the surrounding soft and hard tissues. The specimens were demineralized with a specific solution containing formic acid (Rapid-Cal; BBC Biochemical, Mount Vernon, WA, USA), trimmed, dehydrated, and embedded in paraffin. Serial sections with a thickness of 6 μm were prepared in the buccolingual plane. Staining was performed with hematoxylin-eosin and Masson trichrome.
Histologic and histomorphometric analysis
Histologic and histometric analyses were carried out applying both incandescent- and polarized-light microscopy (BX41, Olympus, Tokyo, Japan) and a PC-based image analysis system (Adobe Photoshop CS3, Adobe Systems, CA, USA). The bottom of the defect was set at the most apical point of the planed root surface where the preexisting cementum had been removed, and the following measurements were made (Figure 2):
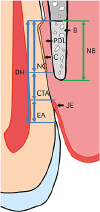 | Figure 2Schematic drawing of measurements. The bottom of the defect was set at the most apical point of the planed root surface, the most coronal point of newly formed cementum on the root surface was marked by a straight line, and the most apical point of the long junctional epithelium was also marked by a straight line. The newly formed bone was distinguished from the preexisting alveolar bone by its color.B: bone, PDL: periodontal ligament, C: cementum, JE: junctional epithelium, DH: defect height, NC: new cementum, CTA: connective-tissue adhesion, EA: epithelial adhesion, NB: new bone.
|
• Defect height, corresponding to the distance between the bottom of the defect and CEJ.
• New cementum length, corresponding to the distance from the bottom of the defect to the most coronal point of newly formed cementum on the root surface.
• New cementum width, corresponding to the average width of newly formed cementum measured at 3 different levels: the most coronal, most apical, and middle levels of the whole length of newly formed cementum.
• New bone, corresponding to the distance from the bottom of the defect to the most coronal point of newly formed bone alongside the root surface.
• Connective-tissue adhesion, corresponding to the distance from the most apical point of the long junctional epithelium to the most coronal point of the new cementum.
• Epithelial adhesion, corresponding to the distance from the most apical point of the long junctional epithelium to the CEJ.
Statistical analysis
The statistical analysis was conducted using a standard software program (SPSS version 25.0; IBM Corp., Armonk, NY, USA). We applied one-way analysis of variance and the Tukey post hoc multiple-comparisons test to detect significant differences between the groups. The Kolmogorov‐Smirnov test confirmed the normality of the distribution of the data (P>0.05). Statistical tests were performed with an alpha level of 0.05. Measured data are presented as mean±standard deviation.
RESULTS
Characterization of PDL progenitor cells
After 7–14 days, we observed adherent clonogenic clusters of fibroblast-like cells in the single-cell suspension that was obtained from the PDL of the animals. This confirmed the multipotent capacity of the PDL progenitor cells. We observed long spindle-like fibroblastic cells at 7–14 days after cell plating and 60–100 single colonies were obtained from 1×10³ single cells. P4 cells also produced numerous single colonies on culture plates, although fewer single colonies were observed at high passage numbers. Osteogenic differentiation was observed with alizarin-red–positive cells and adipogenic differentiation of the cells was observed with Oil-Red-O–positive cells. This demonstrated the multipotency of PDL progenitor cells (Figure 3).
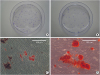 | Figure 3Characterization of PDL progenitor cells as mesenchymal stem cells. (A, B) Colony-forming-units assay revealed colony formation at 14 days after cell plating (stained with crystal violet). Although the colony formation decreased from (A) P3 to (B) P4, the size of the colonies was similar at (C) P3 and (D) P4. Adipogenic and osteogenic differentiation were induced after 4 and 2 weeks, respectively.PDL: periodontal ligament; P: passage.
|
SEM analysis of collagen matrix seeded with PDL progenitor cells
Cell adhesion to the collagen matrix was observed by SEM at 0, 10, and 30 minutes after seeding PDL progenitor cells. Cuboidal cells were dispersed among a network of collagen fibrils, and a fine microfibrous network in which the cells were caught and maintained could be observed on samples incubated for 10 minutes. This network was increasingly observed on the samples incubated for 30 minutes, and cellular surface irregularities indicating initial cellular processes were evident. Although no cellular processes clearly attached onto the surfaces of the collagen matrix, most of the cells were stably maintained with the microfibrous network (Figure 4).
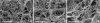 | Figure 4Scanning electron microscopy photographs showing collagen matrix with periodontal ligament progenitor cells in the experimental group at observation periods of (A) 0 minutes, (B) 10 minutes, and (C) 30 minutes . The number of cells tended to decrease from 0 to 30 minutes, with some cells showing a spindle-like appearance.
|
Clinical observations
All study sites healed uneventfully. There were no adverse effects such as infection or root resorption. After the surgical experiment, the healing was equivalent in the control and experimental groups.
Histologic and histomorphometric results
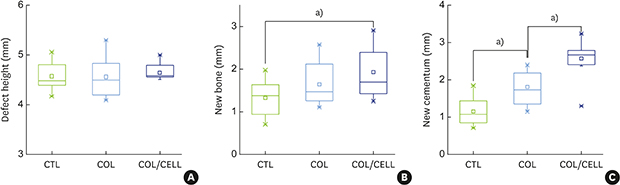
All sites in the 6 animals showed newly formed bone and cementum alongside the surgically created tooth dehiscence defects (Figures 5 and 6). No inflammatory cell infiltration was observed at the sites of all animals, and there was limited evidence of a collagen matrix at all test sites. There was no significant intergroup difference in the defect height from the CEJ to the most apical point of cementum removal (4.57±0.28, 4.56±0.41, and 4.64±0.27 mm in the CTL, COL, and COL/CELL groups, respectively). The sulcular depth with epithelial adhesion from the CEJ was smaller in the test sites that received collagen and PDL progenitor cells, and the corresponding epithelial adhesion values differed significantly across the CTL, COL, and COL/CELL groups (1.41±0.51, 0.85±0.29, and 0.30±0.41 mm, respectively; P<0.05); however, there were no significant differences in connective-tissue adhesion, with values of 2.01±0.11, 1.90±0.14, and 1.77±0.40 mm, respectively.
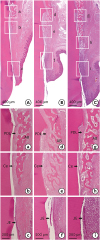 | Figure 5Photomicrographs of the buccolingual section in the dehiscence defects of periodontal tissue in the (A) CTL, (B) COL, and (C) COL/CELL groups, displaying the sites from the apical extension of the surgically created defect (apical insert; a, d, and g) along the root surface to the coronal extension of the newly formed alveolar bone and cementum (midroot insert; b, e, and h), and the apical extension of epithelial adhesion (c, f, and i; hematoxylin-eosin stain).PDL: periodontal ligament, AB: alveolar bone, Ce: cementum, JE: junctional epithelium, COL group: collagen matrix group, COL/CELL group: PDL progenitor cells with collagen matrix group, CTL group: sham control group.
|
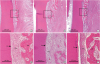 | Figure 6Low-magnification photographs of the buccolingual section of the dehiscence defects of periodontal tissue in the (a) CTL, (b) COL, and (c) COL/CELL groups, along with high-magnification photographs from the sites of the dehiscence defects of periodontal tissue in the (A) CTL, (B) COL, and (C) COL/CELL groups. The newly formed PDL did not differ across the 3 groups (hematoxylin-eosin stain).Ce: cementum, PDL: periodontal ligament, AB, alveolar bone, CTL group: sham control group, COL group: collagen matrix group, COL/CELL group: PDL progenitor cells with collagen matrix group.
|
Newly formed bone appeared to have grown from the base of the defect, and also had the appearance of immature woven bone with limited lamellation and no osteon formation. These patterns were shown in all experimental groups without significant differences. The heights of new bone regeneration were 1.32±0.44, 1.65±0.52, and 1.93±0.61 mm in the CTL, COL, and COL/CELL groups, respectively. The COL/CELL group showed significantly greater new bone formation than the CTL group (P<0.05), but there were no qualitative differences in newly formed bone between the groups. The PDL was draped across the newly formed bone and the surface of the dental root. Additionally, it was shown that collagen fibers were inserted perpendicularly into the newly formed bone and cementum (Figure 6).
New cementum was formed on the exposed dental root, dentin surfaces, and appeared as a layer of mineralized tissue with or without cellular impaction within the layer. The length of new cementum regeneration varied across the CTL, COL, and COL/CELL groups (at 1.15±0.42, 1.81±0.46, and 2.57±0.56 mm, respectively; P<0.05). However, the intergroup differences in the width of new cementum were not statistically significant, with values of 11.66±3.23, 12.80±3.43, and 14.44±2.98 μm, respectively. Table 1 and Figure 7 summarize the histometric results.
Table 1
Results of histometric analyses of periodontal tissue formation after surgery (1-way analysis of variance)
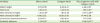
PDL: periodontal ligament, SD: standard deviation.
Data are mean±SD values, in millimeters; a)P<0.05 compared with sham control; b)P<0.05 compared with collagen matrix; c)Data are mean±SD values, in micrometers.
![]()
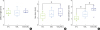 | Figure 7Comparison of periodontal tissue formation. (A) The defect height did not differ significantly across the 3 groups (P=0.84). (B) New bone formation did not differ significantly across the 3 groups (P=0.058). However, the Tukey post hoc test revealed a significant difference between the CTL and COL/CELL groups (P=0.046). (C) New cementum formation differed significantly across the 3 groups (P=0.001).CTL group: sham control group, COL group: collagen matrix group, COL/CELL group: PDL progenitor cells with collagen matrix group.
a)P<0.05.
|
DISCUSSION
The purpose of this study was to conduct a histologic assessment of the recovery of periodontal tissue healing after grafting a collagen matrix with PDL progenitor cells on surgically created dehiscence bone defects in beagle dogs. The PDL progenitor cells carried by the collagen matrix were found to significantly enhance periodontal regeneration, including the growth of cementum and alveolar bone. This result can be interpreted in light of recent findings that the multipotential capacity of PDL progenitor cells enhanced periodontal regeneration, including cementum formation [16171819202122]. Seo et al. [23] reported that the multipotential capacity of PDL progenitor cells from human PDL could enhance periodontal tissue regeneration. Those authors found that PDL progenitor cells could differentiate into cementoblast-like cells, adipocytes, osteocytes, and collagen-forming cells. When transplanted into immunocompromised rodents, PDL progenitor cells showed the ability to form a cementum/PDL-like tissue and contributed to periodontal tissue regeneration.
Several animal studies also have provided evidence that PDL progenitor cells can safely and effectively enhance periodontal regeneration [24252627]. Akizuki et al. [17] applied PDL cell sheets with a reinforced hyaluronic acid carrier to surgically created dehiscence defects in beagle dogs. That study observed periodontal tissue regeneration containing bone, PDL, and cementum in the experimental group, and found that there was significantly more newly formed cementum in the experimental group than in the group with only the hyaluronic acid carrier. Murano et al. [28] transplanted PDL progenitor cells into class III furcation defects in dogs, and demonstrated that new cementum regenerated around the entire root surfaces of class III furcations, with new bone filling, whereas the no-treatment group showed reduced epithelial growth and furcation defects filled with connective tissue.
Successful periodontal regeneration requires the utilization and recruitment of progenitor cells that can differentiate into specialized cells with a regenerative capacity, followed by the proliferation of these cells and the synthesis of specialized materials that can maintain the required space [13]. Collagen matrix is a scaffolding material for soft-tissue augmentation that was originally developed as a replacement of an autogenous connective-tissue graft, and it can provide space to stimulate the growth of fibroblasts and blood vessels. It was reported by Mathes et al. [29] that prototype collagen matrices in vitro showed primary human fibroblast growth and the expression of extracellular matrix proteins such as collagen type I, as well as an increase in fibronectin. The application of collagen matrix allows the regenerative ability of cells existing within the periodontium to be utilized.
In the present study, we applied collagen matrix with PDL progenitor cells to surgically created dehiscence defects in beagle dogs. The histometric analyses showed that the formation of cementum in the group that received PDL progenitor cells with collagen matrix was significantly greater than that in the sham control and collagen matrix groups. Functional insertion of collagen fibers into the newly formed cementum was found evenly in all samples from all 3 experimental groups. The histometric analyses also suggested that newly formed bone was significantly greater in the group with PDL progenitor cells and collagen matrix than in the sham control group. This result suggested that PDL progenitor cells have a multipotential ability that contributes to the regeneration of periodontal tissue and implies that a collagen matrix can facilitate cell adhesion and proliferation and provide room for space management.
An important issue in this study was the outcome of the transplanted cells and the effectualness of the cell delivery system. SEM revealed stably clustered PDL progenitor cells that were enmeshed in the web of the collagen fiber network, with few cellular tentacles. Even though more time for cellular attachment and other metabolic cycles could clearly enhance the delivery of PDL progenitor cells, only a short period of cellular application was used due to the vulnerability of the collagen matrix to resorption within the cellular medium [14]. Despite the short time of cellular application, periodontal regeneration was clearly enhanced in the in vivo experiment, and we also obtained evidence of its advantages as an optimal cell delivery system for periodontal healing.
Within the limitations of this study, the present results suggest that PDL progenitor cells carried on a synthetic collagen matrix can enhance periodontal regeneration, including cementum formation and new bone formation, even with a protocol involving a short period of cell application (30 minutes). Collagen matrices should therefore be considered as a promising candidate carrier for PDL progenitor cells in periodontal tissue engineering.
 XML Download