

 PDF
PDF Citation
 Print
Print


INTRODUCTION
The natural history of cirrhosis is related to elevated portal pressure.1 Portal hypertension (PHT) is a clinical syndrome characterized by a pathologically elevated portal perfusion gradient.23 Measuring the hepatic venous pressure gradient (HVPG) is safe and has been found to be useful in the diagnosis of PHT and for risk stratification, assessment of prognosis, monitoring of treatment, and identification of patients with hepatocellular carcinoma (HCC) who are candidates for liver resection.45678910 An HVPG of > 20 mmHg in acute variceal hemorrhage is indicative of a high probability of 1-year mortality.11 The HVPG has been shown to have an independent role in survival in addition to the model for end-stage liver disease (MELD) score, with each 1-mmHg increase contributing to a 3% increase in mortality.9
A previous report suggested that specific stages within the classification of chronic liver disease can be associated with histological, clinical, hemodynamic, and biological stages.61213 For example, a hemodynamic stage (HS) with HVPG ≥ 6 mmHg indicates PHT (stage 1), while HVPG ≥ 10 mmHg represents clinically significant PHT (stages 2–4).61415 Previous reports have suggested that HS utilizing the HVPG score is closely associated with the clinical stage according to the presence of clinical complications.1617 However, considering that there are various causes of cirrhosis, regional and gender differences, and dynamic disease progression such as acute-on-chronic liver failure, few studies have evaluated survival prediction according to clinical characteristics and HS using the HVPG score in patients with PHT.18
The present study investigated the current real-life setting in which patients with cirrhosis receive standard therapies for the different complications, with the aim of quantifying survival according to the HVPG grade and the prognostic value of HVPG grades and other prognostic factors.
METHODS
Patients
Between January 2008 and June 2013, 1,025 cirrhotic patients were consecutively collected at 4 academic hospitals. All of the patients had a previous histological confirmation of cirrhosis19 or a diagnosis of cirrhosis suspected on the basis of standard clinical, ultrasonographic, and biochemical parameters.20 All of the patients had stable hemodynamic parameters and were not active drinkers. Active drinkers were defined as patients who drink alcohol more than 140 grams/week (women), or 210 grams/week (men).21 HVPG measurements were used to establish the diagnosis of cirrhosis or to assess baseline portal pressure, prior to primary prophylaxis or secondary prophylaxis of variceal bleeding. The patients were enrolled after confirming the presence of an HVPG of ≥ 6 mmHg. The exclusion criteria were HVPG < 6 mmHg (58 patients), presence of HCC (99 patients) and cholangiocarcinoma (1 patient), gastric variceal bleeding (27 patients), acute decompensation state such as bilirubin levels > 5 mg/dL (41 patients) and recent esophageal variceal bleeding within 2 weeks (168 patients), serum creatinine levels > 1.5-fold the upper normal limit (7 patients), portal vein thrombosis (1 patient), and loss to follow-up within 28 days (51 patients). Gastric varices are not correlated with HVPG level and patients who have recent esophageal variceal bleeding could be critically ill patients. Finally, 572 non-critically-ill cirrhotic patients were analyzed (Fig. 1). Especially in case of alcohol related cirrhosis patients, alcohol abstinence for at least 6 months prior to participating in this study were considered eligible for the study to avoid the influence of inflammation by recent alcohol consumption. The follow-up was performed up to December 31, 2013.
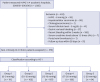 | Fig. 1Patient enrollment diagram. Clinical data of 1,025 cirrhotic patients with HVPG measurements were collected retrospectively between January 2008 and June 2013. After excluding 453 patients, 572 non-critically-ill cirrhotic patients were analyzed. The severity of HVPG was divided into the following five HS groups according to previously reported cutoffs: group 1, 6–9 mmHg; group 2, 10–12 mmHg; group 3, 13–16 mmHg; group 4, 17–20 mmHg; and group 5, > 20 mmHg. Clinical stages were defined according to the classification by D'Amico et al.1417HVPG = hepatic venous pressure gradient, HS = hemodynamic stage, UNL = upper normal limit.
|
HVPG measurement
All vasoactive drugs were discontinued at least 72 hours before performing the hemodynamic assessments. The HVPG was measured by operators (hepatologists or interventional radiologists) who had previously performed > 100 HVPG measurements. Under fluoroscopic guidance, a 6-French balloon-tip catheter (Arrow International, Cleveland, OH, USA) was inserted into the right hepatic vein via the internal jugular vein. The free hepatic venous pressure was measured within 5 cm of the junction of the right hepatic vein and inferior vena cava. After balloon inflation, the examiner checked for the absence of a venovenous shunt, then measured the wedged hepatic venous pressure at the same location where the free hepatic venous pressure had been measured. Each measurement was repeated three times, with the results reported as mean values for these three measurements. The HVPG was determined by subtracting the free hepatic venous pressure from the wedged hepatic venous pressure.
HVPG subgroup, clinical stage, and MELD score
HS-1 was classified as follows according to HVPG grades based on previously reported cutoffs: group 1, 6–9 mmHg; group 2, 10–12 mmHg; group 3, 13–16 mmHg; group 4, 17–20 mmHg; and group 5, > 20 mmHg.1 The following four clinical stages were defined according to the classification by D'Amico et al.14: stage 1, no ascites and varices; stage 2, esophageal varices without hemorrhage and no ascites; stage 3, ascites without a history of esophageal variceal hemorrhage; and stage 4, gastrointestinal bleeding with or without ascites. Decompensated cirrhosis was defined as stage 3 or 4. The MELD score was calculated for each patient on the day of HVPG measurement using the following equation22: 9.57 × loge (creatinine, mg/dL) + 3.78 × loge (bilirubin, mg/dL) + 11.2 × loge (prothrombin time, international normalized ratio) + 6.43.
The MELD-Na score was calculated as MELD score − sodium level − 0.025 × MELD score × (140 − sodium level) + 140.23 We defined cutoff MELD scores of 10 and 15 with reference to a previous study24 and the worldwide consensus for those patients who need to receive liver transplantation, thereby categorizing MELD scores into the following three groups: low, 6–9; intermediate, 10–15; and high, ≥ 16.
Statistical analysis
Statistical analyses and graphic production were performed with SPSS (version 18.0; SPSS, Chicago, IL, USA). Descriptive statistics were produced for the demographic, clinical, and laboratory characteristics of the study patient sample. Continuous and categorical variables were expressed as mean ± standard deviation (SD, range) and number (%) values, respectively. The patient characteristics were compared according to HS using the χ2 test and one-way analysis of variance with Scheffe's test. To evaluate mortality according to the Child-Pugh (CP) class, clinical stage, and HS, the Kaplan-Meier method with the log-rank test was used to calculate survival, with Bonferroni correction applied to P values according to the number of groups.
Based on the results of the survival analysis of our data, we simplified HS-1 into HS-2 as follows: group A, 6–12 mmHg; group B, 13–20 mmHg; and group C, > 20 mmHg. To assess the prognostic predictors of long-term mortality, variables including gender, age, use of beta-blockers, platelet count, albumin, bilirubin, prothrombin time, creatinine, sodium level, CP score, clinical stage, HS-2, MELD score, and MELD-Na score were used in Cox regression models to obtain hazard ratios (HRs) for independent predictive factors. Variables that were significant in the univariate variables were analyzed by stepwise Cox multivariate regression. For the subgroup analyses in the hypoalbuminemia and MELD groups, hypoalbuminemia was defined as a serum albumin level of ≤ 3.5 mg/dL, and MELD groups were divided into three groups. P values of < 0.05 were considered to be statistically significant.
RESULTS
Baseline characteristics of patients
The baseline characteristics and the results of biochemical examinations are summarized in Table 1. The patients were aged 53.0 ± 9.7 years. The causes of liver cirrhosis were alcohol consumption in 344 (60.1%) patients, viral hepatitis in 157 (27.5%), viral hepatitis and alcohol consumption in 38 (6.6%), and others in 33 (5.8%). There were 439 (76.8%) men patients, 105 (18.4%) at clinical stage 1, 173 (30.2%) at clinical stage 2, 253 (44.2%) at clinical stage 3, and 41 (7.2%) at clinical stage 4. The overall MELD score and HVPG were 10.3 ± 3.4 and 14.5 ± 5.2 mmHg, respectively (Table 1).
Table 1
Clinical characteristics of enrolled patients
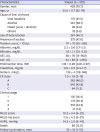
Data are number (%) or mean ± standard deviation (range) values.
ALT = alanine aminotransferase, AST = aspartate aminotransferase, CP = Child-Pugh, HVPG = hepatic venous pressure gradient, INR = international normalized ratio, MELD = model for end-stage liver disease.
![]()
Patient characteristics according to the severity of PHT
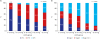
The patient characteristics according to HS-1 are summarized in Table 2. Higher HVPG grades were associated with higher frequency of alcoholic liver disease, serum bilirubin levels, prothrombin time, and prognostic scores such as the CP score, MELD score, MELD-Na score, and decompensated stage, but lower platelet count, serum albumin, and serum sodium (all P < 0.001). The CP class and clinical stages were negatively correlated with the HVPG grade (Fig. 2A and B, respectively).
Table 2
Patient characteristics and prognostic stages according to HS-1 groups
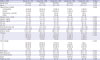
Data are number (%) or mean ± SD values. χ2 test and P trend or one-way analysis of variance as appropriate. Hemodynamic stage-1 (HS-1) groups 1–5 were defined as 6–9, 10–12, 13–16, 17–20, and > 20 mmHg, respectively.
ALT = alanine aminotransferase, AST = aspartate aminotransferase, CP = Child-Pugh, INR = international normalized ratio, MELD = model for end-stage liver disease.
![]()
Cumulative survival according to CP class, clinical stage, and HVPG grade
During the follow-up period of 25 ± 18 months (range, 1–73 months), 86 (15.0%) patients died (Table 1). The causes of death were bleeding (n = 25, 29.1%), hepatic failure (n = 18, 20.9%), hepatorenal syndrome (n = 13, 15.1%), infection including spontaneous bacterial peritonitis (n = 10, 11.6%), hepatic encephalopathy (n = 9, 10.5%), HCC that developed from precancerous lesion such as liver cirrhosis (n = 2, 2.3%), intracranial hemorrhage (n = 5, 5.8%), and others (n= 4, 4.7%). Two patients underwent liver transplantation due to hepatic encephalopathy (10 months) and hepatic failure (20 months) and were counted as death.
The mortality rates differed significantly between CP classes A, B, and C (all P < 0.017, log-rank test with Bonferroni correction) (Fig. 3A), but not between clinical stages 3 and 4 (Supplementary Fig. 1). However, the cumulative survival rate was significantly higher for both clinical stages 1 and 2 than for the decompensated stage (both P < 0.017) (Fig. 3B).
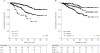 | Fig. 3Cumulative survival according to CP class and clinical stage. (A) The mortality rate differed significantly between CP classes A, B, and C (all P < 0.001, log-rank test). (B) The cumulative survival rate was significantly higher for both clinical stages 1 and 2 than for the decompensated stage (both P < 0.001, log-rank test).CP = Child-Pugh.
|
The numbers of deaths in HS-1 groups 1–5 during the follow-up period were 7 (6.3%), 7 (6.9%), 30 (18.0%), 20 (15.6%), and 22 (34.4%), respectively (P < 0.001). The cumulative survival differed significantly between the following HS-1 groups: group 1 vs. group 3, group 1 vs. group 5, group 2 vs. group 5, and group 4 vs. group 5 (all P < 0.005, log-rank test with Bonferroni correction) (Fig. 4A). However, the use of the traditional HVPG cutoffs of 10 and 16 mmHg did not improve the discrimination of mortality. Dividing HS into the three groups for HS-2 (Supplementary Table 1) resulted in significant differences in the 1- and 3-year cumulative survival rates between HS-2 groups A, B, and C: 96.6% vs. 94.0% vs. 84.1% for the 1-year cumulative survival, respectively, and 91.4% vs. 75.3% vs. 57.1% for the 3-year cumulative survival (P < 0.017) (Fig. 4B).
 | Fig. 4Cumulative survival according to HVPG groups with hemodynamic stage-1 (HS-1) and HS-2. (A) The cumulative survival differed between following HS-1 groups: group 1 vs. 3, group 1 vs. 5, group 2 vs. 5, and group 4 vs. 5 (all P < 0.001, log-rank test). (B) However, the use of the traditional HVPG cutoffs of 10 and 16 mmHg did not improve the discrimination of mortality. Dividing HS into three groups for HS-2 (6–12, 13–20, and > 20 mmHg) resulted in significant differences in the 1- and 3-year cumulative survival rates: 96.6%, 94.0%, and 84.1% for the 1-year cumulative survival, respectively, and 91.4%, 75.3%, and 57.1% for the 3-year cumulative survival (P < 0.001, log-rank test).HVPG = hepatic venous pressure gradient, HS = hemodynamic stage.
|
Predictors of long-term mortality
In the univariate analysis for death, the presence of ascites, serum albumin, bilirubin, serum alanine aminotransferase, prothrombin time, sodium level, CP score, CP class, decompensated stage (clinical stage 3 or 4), HVPG 13–20 mmHg or > 20 mmHg, MELD score, and MELD-Na score were related to long-term mortality (all P < 0.05). The multivariate analysis used a Cox regression model that considered the serum albumin, serum sodium, CP class, and HS-2. Even when applying multiple models, the long-term mortality risk increased approximately two- and fourfold for HVPG 13–20 and > 20 mmHg, respectively (Table 3).
Table 3
Cox regression analysis of variable factors and HVPG grades for mortality
Model 1: including sex, age, use of beta-blocker, presence of ascites, albumin, bilirubin, ALT, INR, sodium level, and HVPG grade; Model 2: including sex, age, use of beta-blocker, ALT, sodium level, CP class, and HVPG grade; Model 3: including sex, age, use of beta-blocker, albumin, ALT, sodium level, clinical stage 3 or 4, MELD score, and HVPG grade; Model 4: including sex, age, use of beta-blocker, albumin, ALT, clinical stage 3 or 4, MELD-Na score, and HVPG grade
ALT = alanine aminotransferase, AST = aspartate aminotransferase, CI = confidence interval, CP = Child-Pugh, HR = hazard ratio, HVPG = hepatic venous pressure gradient, INR = international normalized ratio, MELD = model for end-stage liver disease.
![]()
Survival analysis in the presence of hypoalbuminemia and MELD groups
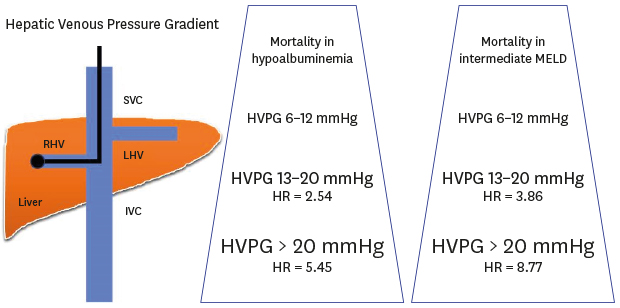
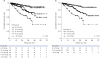
According to Cox regression, albumin was an independent risk factor for predicting a poor long-term survival (Table 3). The mortality rates were significantly higher for HVPG = 13–20 mmHg (HR, 2.54; 95% confidence interval [CI], 1.28–5.06; P = 0.008) and HVPG > 20 mmHg (HR, 5.45; 95% CI, 2.55–11.62; P < 0.001) than for HVPG 6–12 mmHg in patients with hypoalbuminemia (Fig. 5A). In contrast, there were no significant differences in mortality rates between HVPG groups in patients without hypoalbuminemia (Supplementary Fig. 2).
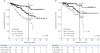 | Fig. 5Cumulative survival according to patients with hypoalbuminemia and an intermediate MELD score. (A) The mortality rates was significantly higher for HVPG 13–20 mmHg (HR, 2.54; 95% CI, 1.28–5.06; P = 0.008) and HVPG > 20 mmHg (HR, 5.45; 95% CI, 2.55–11.62; P < 0.001) than for HVPG 6–12 mmHg in patients with hypoalbuminemia. (B) When we divided the MELD scores into three groups (6–9, 10–15, and ≥ 16), in the intermediate-MELD-score group (score of 10–15), the mortality rates was significantly higher for HVPG 13–20 mmHg (HR,3.86; 95% CI, 1.16–12.91; P = 0.028) and HVPG > 20 mmHg (HR, 8.77; 95% CI, 2.41–31.94; P = 0.001) than for HVPG 6–12 mmHg.CI = confidence interval, HR = hazard ratio, HVPG = hepatic venous pressure gradient, MELD = model for end-stage liver disease.
|
After dividing the patients into three MELD groups, the mortality rates in the intermediate-MELD-score group (score of 10–15) was significantly higher for HVPG 13–20 mmHg (HR, 3.86; 95% CI, 1.16–12.91; P = 0.028) and HVPG > 20 mmHg (HR, 8.77; 95% CI, 2.41–31.94; P = 0.001) than for HVPG 6–12 mmHg (Fig. 5B).
DISCUSSION
This large-scale retrospective cohort study was designed to evaluate the natural course of various stages of non-critically-ill cirrhotic patients and the clinical implications of HVPG values on the long-term prognosis in real-life situations. Several previous Western studies have found the HVPG to be clinically significant in the prognosis of compensated and decompensated cirrhotic patients,191425 but it had not been determined in a large population study whether this is also the case in Asians. The present study investigated the factors that influence the survival of cirrhotic patients and the clinical value of the HVPG in non-critically-ill Asian cirrhotic patients. We excluded patients in an active state related to hemodynamic instability, and measured the HVPG in the highly stable, non-critically-ill situation to reflect the real baseline PHT condition in each patient.
As we expected, the presence of compensation or decompensation exerted absolutely different effects on the prognosis. In the presence of compensation, survival was significantly better in patients without varices (stage 1) than in patients with varices (stage 2), but it did not differ between clinical stage 3 (ascites with/without variceal hemorrhage) and stage 4 (variceal hemorrhage with/without ascites). This finding is similar to recent Western data,26 and it suggests that primary treatment and secondary prophylaxis of variceal bleeding and antibiotics improve the outcome of variceal hemorrhage over a timescale of years, whereas the treatments applied to ascites have not changed or improved over a timescale of several decades. This finding is also consistent with the categorical HVPG stages (i.e., HS). As HS increases, the compositions of clinical stage 3 (ascites) also increase, while those of clinical stage 4 do not show any trend with HS. This finding is also consistent with previous data that not only PHT but also hepatic insufficiency and other factors such as infection and low-grade inflammation induced by bacterial translocation might be more important in decompensated cirrhosis.18 The HVPG therefore appears to have a greater prognostic meaning in compensated cirrhosis than in decompensated cirrhosis.1
The present study also found that the traditional HVPG cutoffs of 10 and 16 mmHg did not produce an appropriate discriminative ability for the prognosis. Even though we measured the HVPG in a highly controlled state, hemodynamics can be affected by various factors throughout the lifetime. Therefore, adopting a single critical HVPG cutoff for various clinical situations and etiologies appears to be too strict and less reliable in real clinical practice; for example, the differences between CP scores of 6 and 7 or 9 and 10 are not weighted in a real clinical situation. The HVPG interval between 10 and 12 mmHg is also too narrow to distinguish between compensation with varices formation and decompensation with variceal hemorrhage.1 Applying the same HVPG cutoff to the risks of variceal hemorrhage and ascites development is also questionable given the differences in their developmental pathophysiologies.27 For these reasons, we applied categorical values of the HVPG severity as for the CP class. According to HS-2, each of HVPG groups A, B, and group C showed excellent discriminative ability for the long-term mortality in any models, including traditional prognostic factors (Table 3). This categorical model can be helpful for developing more reliable noninvasive surrogate markers for estimating the severity of PHT and the treatment response in future clinical practice.
An HVPG of 10 mmHg has been accepted as an absolute cutoff for clinically significant PHT in many previous studies, especially for the development of varices and the progression from compensated to decompensated cirrhosis. However, we did not use this cutoff of 10 mmHg in the present study for several reasons. First, an HVPG of 10 mmHg did not show prognostic value for long-term mortality in our cohort. An HVPG cutoff of 10 mmHg is based on varix development, and it is relatively low and therefore not appropriate for predicting the long-term mortality in cirrhotic patients. The recent decrease in variceal hemorrhage-related mortality and relative increases in the rates of death and acute decompensation related to ascites such as spontaneous bacterial peritonitis, refractory ascites, or hepatorenal syndrome have also increased the need to increase the HVPG cutoff.
Comparing the usefulness of the HVPG and MELD score for determining the long-term prognosis in cirrhotic patients is controversial.2628 The advantage of the HVPG over the CP or MELD score in predicting prognosis is that it reflects PHT and the hemodynamic component directly, and hence the HVPG has been accepted as the most important predictive parameter especially in compensated cirrhosis.14 In contrast, the prognostic ability of HVPG in decompensated cirrhosis is more controversial because, as mentioned above, extrahemodynamic factors such as hepatic insufficiency and cardiorenal insufficiency have greater influences on the prognosis, and so the MELD or MELD-Na score has been accepted as a more reliable index in this phase. However, combining the use of the HVPG and the MELD/MELD-Na score has been considered to not improve the prognostic accuracy.9 In general, a MELD score of > 15 is accepted as indicating the need for liver transplantation, but the clinical meaning of an intermediate MELD score (10–15) is not clear, and there have been difficulties in predicting the prognosis and making clinical decisions in this group.
In the present study, the new categorical staging of HS-2 showed an additional discriminative ability in this intermediate-MELD-score group, with the 3-year survival rates for HVPG 13–20 and > 20 mmHg being only 71% and 58%, respectively. This finding suggests that additional information about the HVPG stages can be helpful for identifying patients in the intermediate-MELD-score group who should be considered for early liver transplantation. Additionally, the new HS-2 staging was also helpful in discriminating patients with hypoalbuminemia at risk of early mortality. The combination of the MELD score and HVPG also showed additive prognostic values in the low- and high-MELD-score groups in this study. Patients with an HVPG of > 12 mmHg in the low-MELD-score group (MELD score < 10) and those with an HVPG of > 20 mmHg in the high-MELD-score group (MELD score > 15) also exhibited a trend for poor prognoses (Supplementary Fig. 3).
This study was subject to some limitations: 1) the data were collected retrospectively, and the effects of medical treatment such as antiviral therapies could not be analyzed although the proportion of patients who received this treatment was small; 2) only survival data were collected and we did not analyze the development of new acute decompensation during the follow-up; 3) the HVPG was measured by a different operator in each institute and we were unable to calculate the interoperator variability; however, all operators were experts who had sufficient experience in this field and 4) the new HS-2 standard is validated in only specific cohorts and it could not be applied to all the cirrhotic patients. And finally, this study is cross-sectional and only one-time point of HVPG was measured. Therefore, this study could not analyze the prospective effect of other prognostic factors such as ingrowing bacterial translocation as well as treatment of cirrhosis etiology or non-selective beta blocker application as time goes by.
In conclusion, the present study has validated the natural course of cirrhosis and the role of the HVPG in a large Asian population cohort. The presence of compensation or decompensation of cirrhosis showed absolutely different prognoses; however, the stratification of decompensation according to the presence of variceal hemorrhage or ascites was not appropriate for discriminating the prognosis. The new categorized HS staging showed a good prognostic predictive ability, with indeed the combination of the MELD score and HS-2 in the intermediate-MELD-score population providing significant improvements in the prediction of prognosis. These findings suggest that this categorical HS can be helpful in estimating the severity of PHT and treatment responses on the basis of real clinical practice.
 XML Download