

 PDF
PDF ePub
ePub Citation
 Print
Print


INTRODUCTION
Organ transplantation is the treatment of choice for patients with end-stage organ failure. However, there is a huge imbalance between the supply and demand of organs. ABO-incompatible transplantation is an emerging solution to this problem and is expected to increase organ supply by as much as 25% [123]. Antibody-mediated rejection, caused by anti-ABO antibodies, has been the most challenging hurdle for ABO-incompatible transplantation. ABO blood group antigens are carbohydrate antigens, and anti-ABO antibody responses are known to show different patterns from anti-HLA antibody responses, which are a part of the conventional anti-peptide antibody response [4]. Anti-ABO antibody responses are “T-independent” antibody responses that do not require the involvement of T cells. However, it remains unclear which B cell subsets are the main cells that produce anti-ABO antibodies and whether those B cells require help from innate-type T cells [5].
Previous studies have shown that B1 cells produce anti-ABO antibodies [67]. Murine B1 cells have innate phenotypes, express CD11b and surface IgM, and mainly reside in the peritoneal cavity [8]. These murine B1 cells are sub-divided into CD5+ B1a cells and CD5− B1b cells [8]. In contrast to the well-defined phenotypes of mouse B1 cells, the phenotype of human B1 cells is unclear. A recent study proposed that CD20+ B cells that simultaneously express CD43 and CD27 are B1 cells [9]. These cells continuously secrete IgM, maintain tonic signaling, and can help T cell activation and are therefore functionally similar to murine B1 cells [9]. Similar to murine B1 cells, human B1 cells are subdivided based on the expression of CD5 and CD11b [1011]. Marginal zone B (MZB) cells are another type of innate B cells that are involved in the production of anti-alpha-Gal, a type of anti-carbohydrate antibody [12]. Human MZB cells are also present in the spleen and peripheral blood and express both CD27 and CD1c [1314]. Therefore, MZB cells may constitute another candidate for the production of anti-human ABO antibodies together with B1 cells.
We identified B1 and MZB cell populations in human peripheral blood according to previous classification methods [914]. This is the first study to investigate the correlation between human blood group A-specific B cells expressing and producing anti-A antibodies and anti-A antibody levels in the peripheral blood, and to identify the main human B cell subset that produces anti-A antibodies.
METHODS
Sample preparation
The study was prospectively performed between 2014 and 2018 at Seoul National University Hospital, Seoul, Korea, in accordance with the Declaration of Helsinki, and its protocol was approved by Seoul National University Hospital's Institutional Review Board (H-1411-020-623) Ten milliliters of peripheral blood were extracted from 43 healthy volunteers, 13 kidney transplant patients, and 18 peritoneal dialysis patients with blood group B or O after they provided informed consent. Peripheral blood of ABO-incompatible kidney transplant patients was extracted before (N=8) and one yr after (N=10) transplantation. One liter of peritoneal fluid was also collected from peritoneal dialysis patients. Peritoneal cells were obtained by centrifugation of whole fluid obtained from the peritoneal dialysis patients when their peritoneal cavity was washed, two weeks after catheter insertion. Peripheral blood mononuclear cells (PBMCs) were isolated by gradient centrifugation using Ficoll (GE Healthcare, Cleveland, OH, USA). PBMCs and peritoneal cells were subjected to red blood cell-lysis using BD Pharm Lyse (BD Biosciences, San Diego, CA, USA).
Flow cytometric analysis
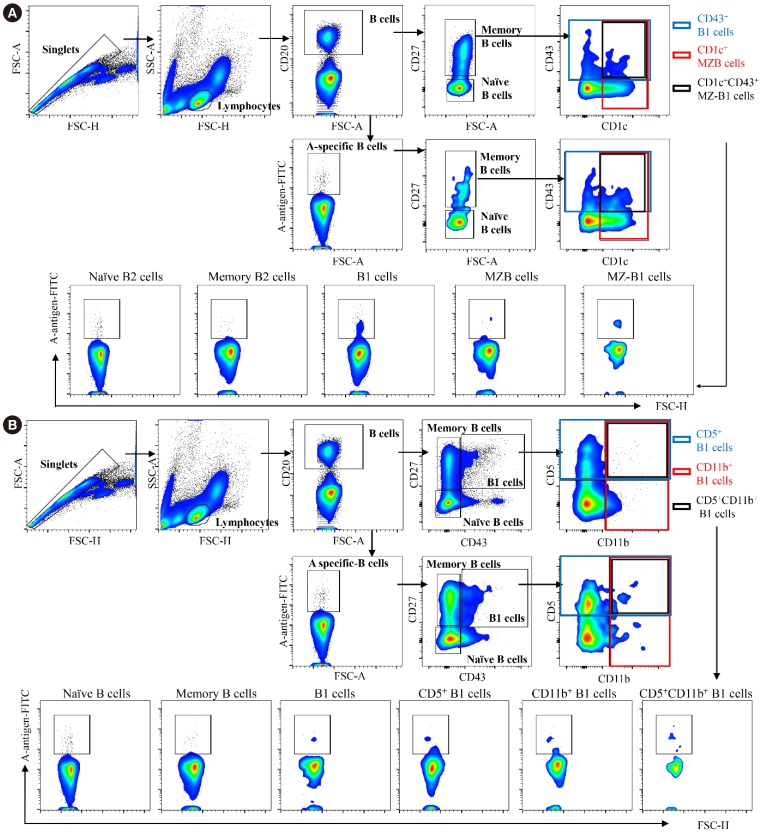
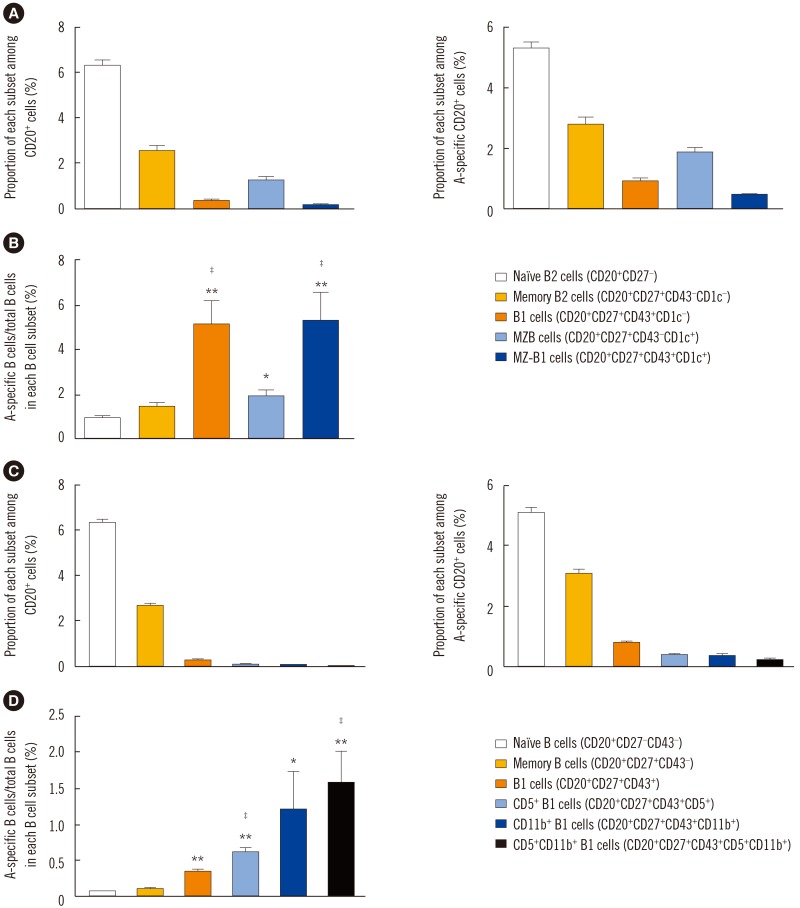
PBMC and peritoneal cells were stained with the following anti-human antibodies: blood type (tri)- PAA-fluor (GlycoTech, Gaithersburg, MD, USA), anti-CD20 (L27), anti-CD27 (M-T271), anti-CD43 (MEM-59), anti-CD5 (L17F12), anti-CD11b (ICRF44), anti-CD1c (L161) (BioLegend, San Diego, CA, USA). Flow cytometric analyses were performed using a BD FACS Canto II flow cytometer (BD Biosciences), and data was analyzed using FlowJo (Tree Star, Ashland, OR, USA). Briefly, at least 1×10⁶ PBMCs and peritoneal cells were subjected to FACS acquisition. Next, approximately 1–5×10⁵ singlet lymphocytes were acquired based on the forward scatter (FSC)-A, FSC-H, and side scatter (SSC)-A. The lymphoid compartment contained approximately 15–30% CD20+ B cells. Based on a previous classification strategy [9], the CD20+ B cells were divided into naïve B2 (CD43−CD27−), memory B2 (CD27+CD43−CD1c−), B1 (CD20+CD27+CD43+CD1c−), MZB (CD27+CD43−CD1c+), and marginal zone-B1 (MZ-B1, CD27+CD43+CD1c+) cells according to CD27, CD43, and CD1c expressions (Fig. 1A, upper panel). CD27+CD43+ B1 cells were subdivided into CD11b+CD5− B1 cells, CD11b−CD5+ B1 cells, and CD11b+CD5+ B1 cells based on CD5 and CD11b expressions (Fig. 1B, upper panel) [1011]. Next, blood group A-specific B cells capable of binding to the blood group A antigen-Fluorescein isothiocyanate (FITC) complex were gated from total B cells (Fig. 1A, lower panel; Fig. 1B, lower panel). Similarly, blood group A-specific B cells were divided into B cell subsets according to CD27, CD43, CD1c, CD5, and CD11b expressions. According to these classification strategies, the proportions of each B cell subset among total and blood group A-specific B cells , and the proportion of blood group A-specific B cells among each B cell subset were analyzed (Fig. 2).
Measurement of anti-blood group A antibody titers
A gel card method (ID-System DiaMed; Bio-Rad, Hercules, CA, USA) was used to measure human blood group A-specific IgM and IgG [15]. Briefly, 50 µL of 0.8% red blood cells (RBCs) and 25 µL of serially diluted serum samples were added to the gel card and incubated at room temperature (20–25℃, IgM) or 37℃ (IgG) for 15 minutes. After centrifugation for 10 minutes, the presence of trapped agglutinates on the top of or dispersed throughout the gel matrix was considered a positive result. A single sediment found at the bottom of the gel matrix was considered a negative result. The highest dilution point that showed a positive result was considered the final titer.
Statistical analysis
Data were presented as mean±standard error of the mean (SEM) or median with range. Both age and proportions of B cell subsets followed a normal distribution, but titers of anti-blood group A antibodies did not. Continuous variables were analyzed using Student's t-tests, and correlations were analyzed using Pearson's correlation analysis. Degree of correlation was regarded as weak if the correlation coefficient (R) was <0.4, moderate if R was between 0.4 and 0.6, and strong for R≥0.6 [16]. P<0.05 was considered statistically significant. All analyses were performed using SPSS (version 20.0, IBM Corporation, Armonk, NY, USA).
RESULTS
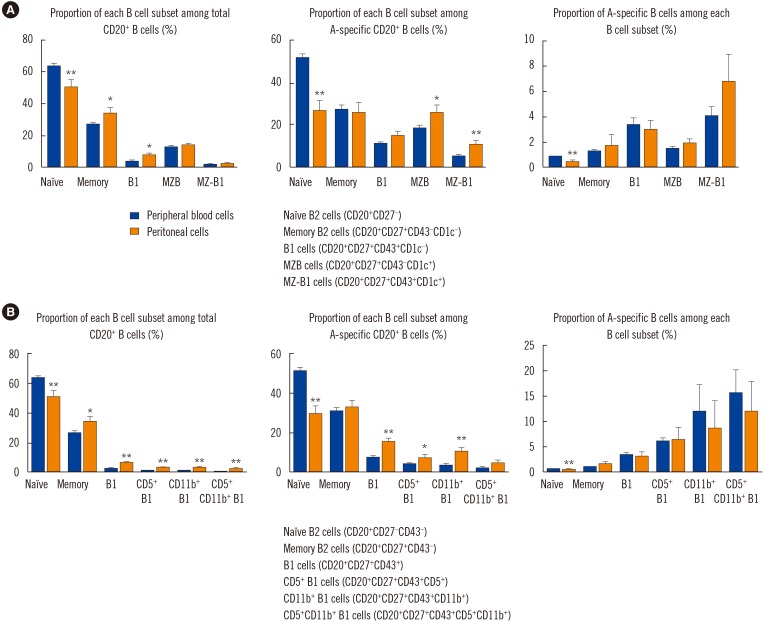
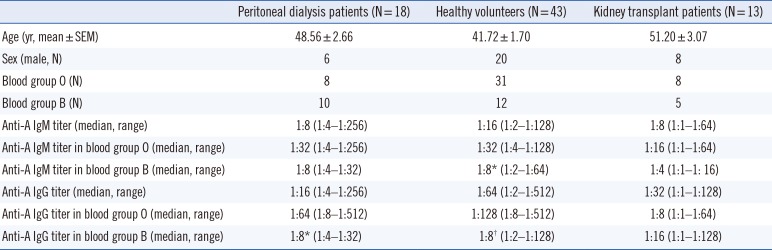
Demographic characteristics of study subjects and anti-A antibody titers are summarized in Table 1. Blood group A-specific B cells were enriched in B1 and MZ-B1 cells in peripheral blood. We first assessed the frequency of B1 cells and MZB cells in the peripheral blood of the healthy volunteers. CD43+ B1 and CD1c+ MZB cells accounted for 3.27±0.29% and 12.97±1.03% of the entire CD27+ B cell population, respectively (Figs. 1A and 2A). Interestingly, MZ-B1 cells expressing both CD43 and CD1c (1.68±0.26%) were also identified (Fig. 2A, left panel). When each B cell subset was measured among the blood group A-specific B cells, the overall trend was similar to the proportion of each B cell subset among the total B cells (Fig. 2A, right panel). Analysis of the proportion of blood group A-specific B cells among each B cell subset suggested that the blood group A-specific B cells in the B1 (5.13±1.06%) and MZ-B1 (5.27±1.28%) cells were significantly higher than those in naïve (0.96±0.11%) and memory (1.45±0.18%) B2 cells (Fig. 2B). The proportion of blood group A-specific B cells was also slightly higher in the MZB cells than in naïve or memory B2 cells (Fig. 2B).
Next, the CD43-expressing B1 cells were subdivided based on CD5 and CD11b expression (Fig. 2C). When the proportion of blood group A-specific B cells among each B1 cell subset was analyzed, the blood group A-specific B cells were enriched in the total CD27+CD43+ B1 cells and B1 subpopulations, such as CD5+, CD11b+ and CD5+CD11b+ B1 cells, compared with naïve and memory B2 cells (Fig. 2D).
B1 cells were the main blood group A-specific B cells in ABO-incompatible kidney transplant patients, in agreement with data obtained from healthy volunteers (Supplemental Data Fig. S1).
Taken together, these data confirmed that B1, MZB, and MZ-B1 cells are present in peripheral blood and demonstrated that blood group A-specific B cells were enriched in B1 cells, including CD5+, CD11b+, and CD5+CD11b+ B1 cells, as well as MZ-B1 cells.
Correlation between the proportion of blood group A-specific B cell subset and anti-A antibody titer
The anti-A IgM and IgG titers of healthy volunteers were 1:16 (1:2–1:128) and 1:64 (1:2–1:1,512), respectively (Table 1). The anti-A IgM and IgG titers in blood group O donors were significantly higher than those in blood group B donors (IgM, P=0.012; IgG, P<0.01, Table 1). There was no significant difference in the anti-A IgM or IgG titers between healthy volunteers and peritoneal dialysis patients.
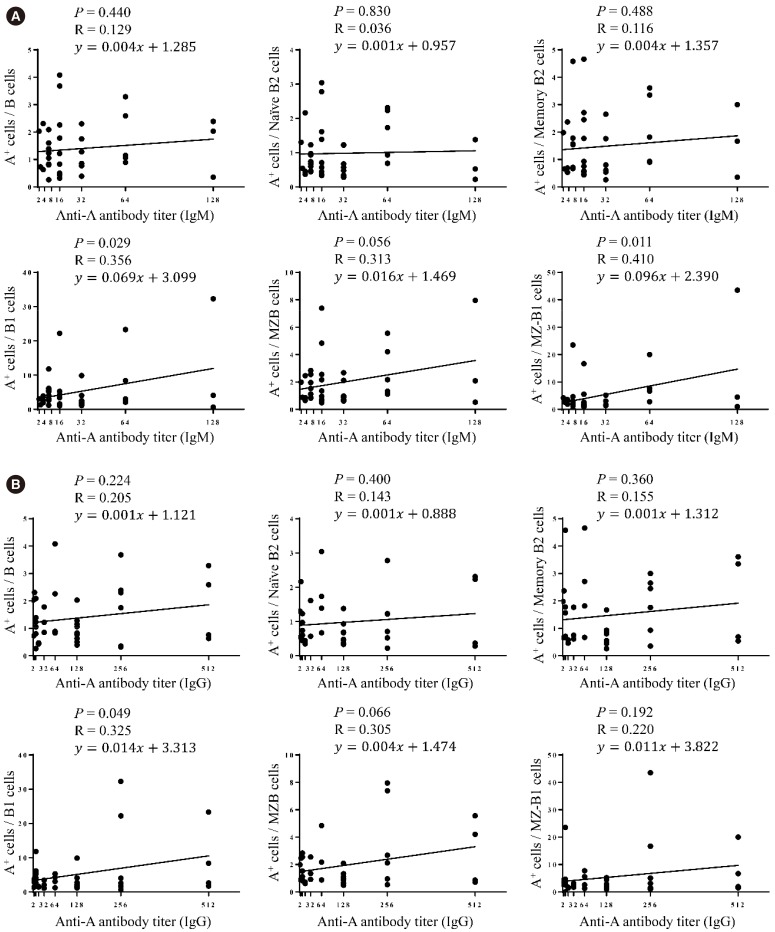
When we examined the correlation between anti-A antibody titer and the proportion of blood group A-specific B cells within each B cell subset, a weak positive correlation was observed between the anti-A IgM and IgG titers and B1 cells (P=0.029 and R=0.356 for IgM, Fig. 3A; P=0.049 and R=0.325 for IgG, Fig. 3B). The MZ-B1 cells showed a moderately positive correlation only with the anti-A IgM titer (P=0.011 and R=0.410, Fig. 3A), and the MZB cells showed a positive correlation trend with the anti-A antibody titer (Fig. 3A and 3B).
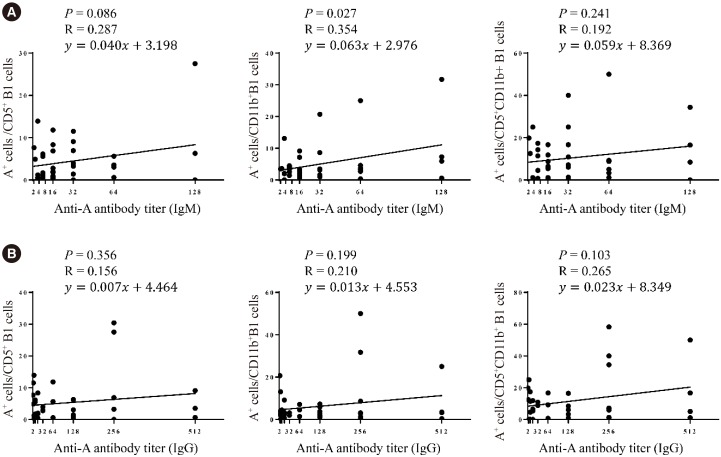
When the B1 cell subpopulations were analyzed, CD11b+ B1 cells were weakly correlated with the anti-A IgM titer (P=0.027, R=0.354, Fig. 4A), while the CD5+ B1 cells showed only a trend of positive correlation with anti-A IgM titer (P=0.086, R=0.287, Fig. 4A). There was no statistically significant correlation between individual B1 subpopulations and the anti-A IgG titer (Fig. 4B). Overall, blood group A-specific B1 cells were positively correlated with anti-A antibody titers.
Human B1 cell enrichment in the peritoneal cavity
When we compared B cell subsets between peripheral blood and peritoneal cells, the proportions of total B1, CD5+ B1, CD11b+ B1, and CD5+CD11b+ B1 cells were higher in the peritoneal cavity than in peripheral blood, similar to the proportions in mice (Fig. 5A and 5B, left and middle panels). However, blood group A-specific B cell enrichment did not differ between peripheral blood cells and peritoneal cells (Fig. 5A and 5B, right panels).
DISCUSSION
The present study showed that blood group A-specific B cells were enriched in CD27+CD43+CD1c− B1, CD11b+ B1, and CD27+ CD43+CD1c+ MZ-B1 cells in peripheral blood, as well as in the peritoneal cavity and that A-specific B1, CD11b+ B1, and MZ-B1 cells were positively correlated with anti-A antibody titer in peripheral blood. Taken together, these data suggest that B1 cells are the key blood group A-specific B cells involved in the production of anti-blood group A antibodies.
In the current era of ABO-incompatible transplantation, rituximab has been used to eradicate total B cells and reduce anti-ABO antibody titer, thereby suppressing anti-ABO antibody-mediated rejection [17]. However, non-specific depletion of broad B cell subsets by rituximab increases opportunistic infection in ABO-incompatible transplant patients [17]. Based on our study, targeted therapy towards B1 cells, instead of total B cells, could be a promising strategy for reducing the anti-A antibody titer with fewer adverse effects.
In general, B1 cells continuously produce low affinity IgM without antigen stimulation [18]. Recent studies on B1 cells have shown that IgG can be produced without antigen stimulation, although IgG production levels are lower than in blasts [19]. Therefore, the positive correlation between the frequency of A-specific B1 cells and anti-A IgM and IgG titers in our study suggests that B1 cells may be involved in the production of anti-A IgM and IgG. CD11b+ B1 cells have been reported to have weaker IgM secretory function but higher expression of CD86 than CD11b− B1 cells, which contributes to the proliferation of T cells in systemic lupus erythematosus patients [10]. Considering the ability of B1 cells to promote T cell proliferation by interacting with T cells, it is likely that CD11b+ B1 cells will be activated with the help of T cells. Our previous study has shown that CD49dhigh CD4+ T cells can help B1 cells secrete IgM and IgG [20]. Therefore, with the help of T cells, CD11b+ B1 cells are likely to secrete anti-A antibodies.
Our study had a few limitations. First, we assessed blood group A-specific B cells by counting B cells that could bind to the A antigen. However, we were unable to confirm whether these cells could actually produce anti-A antibody specifically. As the proportion of B1 cells was very low in the peripheral blood, it was difficult to isolate them and perform functional analysis for antibody production against the A antigen. However, there was a strong correlation between the frequency of blood group A-specific B cells and anti-A antibody titer, and these findings support the functional significance of blood group A-specific B cells indirectly. Second, the peritoneal cells were isolated from initial washing fluid from peritoneal dialysis patients instead of healthy individuals because of practical difficulties. No significant differences were observed between the B cell subsets in the peripheral blood of peritoneal dialysis patients and healthy volunteers (data not shown); therefore, we hypothesize that the peritoneal B cell composition might not significantly differ between the two populations. Third, we did not evaluate the correlation between blood group B-specific B cells and anti-B antibody titers. Further studies are necessary to extend the current findings to blood group B-specific B cells. Finally, the R values were generally low in this small-scale study; therefore, this correlation should be confirmed in further studies using independent validation sets with a larger sample size.
Nonetheless, this study confirmed the importance of B1 cells in anti-blood group antibody response, using two different classification systems, and demonstrated moderate correlations between the frequency of B1 cells and anti-ABO antibody titer for the first time. Therefore, B1 cells could constitute a potential therapeutic target for desensitization in ABO-incompatible transplantation.
 XML Download