

 PDF
PDF ePub
ePub Citation
 Print
Print


INTRODUCTION
Tuberculosis (TB) is one of the most important chronic diseases, causing significant mortality and morbidity in immunocompromised patients worldwide. Korea is one of the top 30 countries with a high TB burden [1]. TB develops in only 5–10% of people exposed to the pathogen; the remaining 90% become latently infected for life without developing active TB. Latent TB infection (LTBI) is a clinical state that is currently defined by immunological evidence of Mycobacterium tuberculosis infection accompanied by the absence of clinical and radiographic evidence of TB-related symptoms and pathology [2]. As 5–15% of LTBIs are known to be active, it is important to diagnose LTBI as well as acute TB [3]. In Korea, screening for LTBI using the tuberculin skin test (TST) and/or an interferon gamma (IFN-γ) releasing assay (IGRA) has been performed in high-risk groups, such as military personnel, school children, anti-tumor necrosis factor users, and healthcare workers (HCWs), as a governmental policy since 2017 [4].
Two IGRAs have been approved by the US Centers for Disease Control and Prevention (CDC) for diagnosing LTBI: the QuantiFERON-TB Gold In-Tube (QFT-GIT) assay (Qiagen, Germantown, MD, USA) and the T-SPOT-TB assay (Oxford Immunotec, Oxford, UK) [5]. The QFT-GIT assay is a whole-blood IGRA using M. tuberculosis-specific synthetic antigens, early secreted antigenic target 6 (ESAT-6), culture filtrate protein 10 (CFP-10), and TB 7.7, which stimulate T lymphocytes to release IFN-γ [6]. QFT-GIT assay results are more reliable than TST results, with a higher sensitivity and stronger correlation with exposure to M. tuberculosis [78]. Although QFT-GIT assay has several advantages over the TST, this assay uses microplate ELISA, which has some disadvantages in clinical laboratories such as labor-intense and time-consuming steps and the need for standard serial dilutions for every microplate. Therefore, a Korean manufacturer (LG Life Sciences, Seoul, Korea) has developed a simple, automated chemiluminescent immunoanalyzer (CLIA), AdvanSure I3, to measure IFN-γ levels for IGRA. This new format has several advantages such as ease of use for small assay volumes, rapid turn-around time, high analytical measurement ranges, and good precision. We compared the results of this new simple automated CLIA-IGRA with those of the classic QFT-GIT assay. This is the first study to evaluate the analytical performance of CLIA-IGRA.
Go to : 
METHODS
Samples
This study involved a short-term prospective analysis carried out at Severance Hospital, Seoul, Korea. We used 341 non-duplicated blood samples obtained from HCWs (n=283) and patients (n=58) screened for LTBI and TB infection from June to July 2017. This study was approved by the Institutional Review Board (IRB) of Yonsei University Health System, Severance Hospital, Seoul, Korea, and informed consent was obtained from all subjects (IRB 1-2017-0066).
IGRA
Blood sample collection, tube distribution, mixing, and incubation were simultaneously performed using the processes of both assays. A total of 12 mL of blood was drawn into two lithium heparin tubes, one for CLIA-IGRA and the other for QFT-GIT assay. We distributed the samples in 1-mL aliquots into each set of manufacturer-specific tubes within six hours: negative control (NC), TB antigens, and positive control (PC) tubes. The assay tubes were inverted at least 10 times to allow for sufficient mixing of the blood sample with the antigens attached to the tube wall. After mixing, sample tubes were kept upright and incubated within one hour. Tubes were handled at a temperature range of 17–25℃ before incubation. After incubation for 16–24 hours at 37℃, samples were immediately centrifuged at 2,000–3,000×g to separate the plasma. The CLIA-IGRA tubes were centrifuged for five minutes and the QFT-GIT assay tubes for 15 minutes.
AdvanSure I3 (LG Life Sciences) is a one-step sandwich CLIA designed to quantitatively detect IFN-γ using an automated analyzer. Fifty microliters of incubated plasma from each of the three tubes were placed into the CLIA-IGRA analyzer cartridge. Three cartridges per subject were run together in the analyzer; the quantitative results of each tube along with the interpretation (positive or negative for TB infection) were displayed after 15 minutes. A pair of anti-human IFN-γ (anti-hIFN-γ) antibodies was used for detection: magnetic particles coated with an anti-IFN-γ antibody captured IFN-γ from the sample and an acridinium-conjugated anti-hIFN-γ antibody attached to the IFN-γ-antibody complex. The intensity of the chemiluminescent signal was calculated as relative light unit (RLU), which correlated to the amount of IFN-γ. The assay was calibrated against non-WHO reference material, IFN-γ (National Institute for Biological Standards and Control [NIBSC] code: 87/586).
The CLIA-IGRA results were compared with those of QFT-GIT assay. QFT-GIT assay was performed manually, and detection was performed using BEP III (Siemens, Marburg, Germany). Qiagen Analysis Software (version 2.50) was used for data calculation. A duplicated four-point standard curve was used for QFT-GIT assay using standard material (8.0 IU/mL) provided with the QFT-GIT assay kit.
Results from both assays were interpreted as follows: positive, NC value was ≤8.0 IU/mL and the TB antigen minus the NC IFN-γ value was ≥0.35 IU/mL and ≥25% of the NC value; negative, the PC-NC value was >0.5 IU/mL, the NC value was <8.0 IU/mL, and the TB antigen minus the NC IFN-γ value was <0.35 IU/mL or ≥0.35 IU/mL and ≥25% of the NC value. Other conditions were considered indeterminate. All experiments were performed according to the manufacturers' instructions. The characteristics of each assay are compared in Table 1.
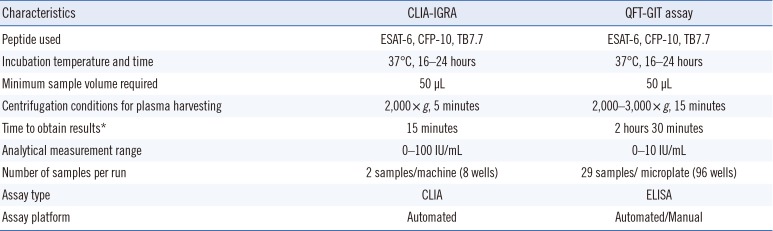
Table 1
Comparison of assay characteristics
![]()
Analytical evaluation
The analytical performance of CLIA-IGRA was evaluated according to the CLSI EP5-A3 protocol for precision [9]. Precision profile was estimated by analyzing four samples diluted with the IFN-γ standard and negative material control (human plasma, ID: 23197-PJ; PlasmaLab International, Everett, WA, USA) in two runs per day, two replicates per run, for a total of 20 days (N=80) at two different sites. Repeatability was calculated based on the results obtained by assaying replicates for a given sample in a single run. Data were expressed as CV and reported as percentage (%); the acceptable criterion for total % CV was considered <10%.
The CLSI EP17-A2 protocol was used to determine limit of blank (LoB), limit of detection (LoD), and limit of quantification (LoQ) [10]. LoB was obtained by assaying an IFN-γ-negative solution 84 times and calculated as the value of the 95th ranked sample. LoD was determined by assaying four IFN-γ sample pools with very low IFN-γ levels (0.12–0.15 IU/mL) 80 times; the LoD was calculated for each level, and the highest value among the samples was chosen. LoQ was calculated using eight very low to low IFN-γ level samples (0.12–2.5 IU/mL) and determined as the highest level with a total error of <10%.
Using the diluted IFN-γ standard, we obtained serial dilutions within a set range (0.25–200 IU/mL), and two determination replicates were performed for recovery analysis. Recovery percentage was calculated by dividing the mean observed value by the mean expected value.
The CLSI EP12-A2 protocol was used for comparing positive or negative results [11]. For discordant results between the two assays, we repeated both assays and reviewed the medical records of the subjects (for age, sex, TB infection history, TST results, chest X-ray, and TB-PCR) to evaluate which assay results were consistent with the subjects' clinical status.
The CLSI EP09-A3 protocol was used for comparing the quantitative IFN-γ values of the CLIA-IGRA to those of QFT-GIT assay as a reference method [12]. Among the 341 samples, 38 samples with IFN-γ values >10 IU/mL by QFT-GIT and >100 IU/mL by CLIA-IGRA were excluded as these values were above the analytical measurement range of each assay. Thus, a total of 303 blood samples were compared. Comparisons were also performed in subgroups with samples with a background-corrected TB antigen QFT-GIT value <5, <2, or <1 IU/mL to determine the correlation near the cut-off value (0.35 IU/mL).
Statistical analysis
Statistical analysis was performed using Microsoft Excel (Microsoft Corporation, Redmond (WA), USA) and Analyse-it Method Evaluation Edition version 5.11 software (Analyze-it Ltd., Leeds, UK). The correlation between the IFN-γ values of the TB antigen tube obtained by CLIA-IGRA and QFT-GIT assay was evaluated using the Passing–Bablok model and Pearson's correlation coefficient (R). Cut-off value of CLIA-IGRA was validated by ROC curve analysis assuming the positive result of the reference method, QFT-GIT assay, as true acute TB or LTBI. Area under the curve (AUC) was reported with 95% confidence interval (CI). Kappa values of <0.40, 0.40 to <0.60, 0.60 to <0.80, and >0.80 were interpreted as fair, moderate, substantial, and near perfect agreement, respectively [13]. P<0.05 was considered statistically significant.
Go to :
RESULTS
Analytical characteristics of CLIA-IGRA
The target values of the control materials were 1.05, 2.47, 34.30, and 90.21 IU/mL, and the repeatability and within-laboratory precision showed a % CV of 4.86–7.00% and 5.43–7.80%, respectively. Reproducibility showed a % CV of 6.36–7.88%, which met the criterion of % CV<10% (Table 2). The LoB, LoD, and LoQ values were 0.02, 0.07, and 0.25 IU/mL, respectively. To evaluate dilution linearity, a serial dilution from 200 to 0.25 IU/mL was performed, and the recovery percentage ranged from 92.57% to 109.51%.
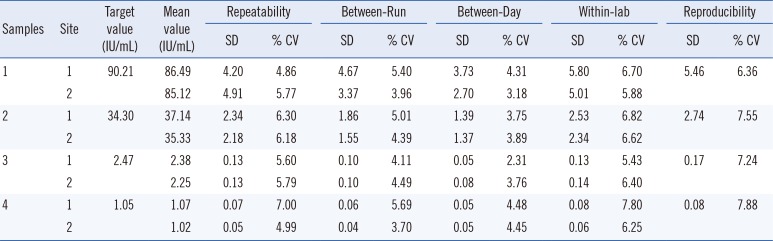
Table 2
Total precision of chemiluminescent immunoanalyzer-based interferon gamma releasing assay
![]()
Comparison of results between CLIA-IGRA and QFT-GIT assay
The CLIA-IGRA showed near perfect agreement (kappa=0.98) with QFT-GIT assay and had an overall agreement of 338/341 (99.12%) among all samples (Table 3). There were three discordant samples with negative CLIA-IGRA and positive QFT-GIT assay results. To confirm the discrepancy in these three samples, we repeated both assays with the same sample and found agreement between the results of the initial and the second tests. To determine which result was consistent with the subjects' clinical diagnosis, we reviewed their medical records. The three discordant cases included an HCW diagnosed as having LTBI by QFT-GIT assay (subject 1) and an HCW with a resolved active TB infection (subject 3). The medical record of subject 2 was not available (Table 4).
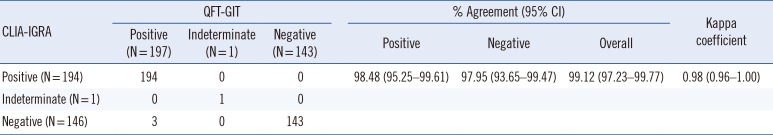
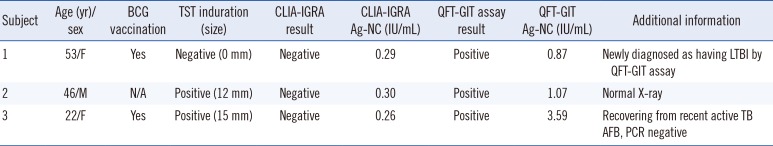
Table 3
Qualitative comparison of CLIA-IGRA and QFT-GIT assay results in health care workers and patients (N=341)
![]()
Table 4
Clinical information of subjects with discordant CLIA-IGRA and QFT-GIT assay results
Abbreviations: M, male; F, female; BCG, Bacillus Calmette-Guérin; TST, tuberculin skin test; Ag, antigen; ANC, negative control; TB, tuberculosis infection; AFB, acid-fast stain; N/A, not available; CLIA-IGRA, chemiluminescent immunoanalyzer-based interferon gamma releasing assay; QFT-GIT, QuantiFERON-TB Gold In-Tube; LTBI, latent tuberculosis infection.
![]()
Correlation of IFN-γ levels from the TB antigen tube between CLIA-IGRA and QFT-GIT assay
A total of 303 samples with TB antigen tube results within the analytical range of each assay were evaluated. Thirty-eight samples with quantitative results above the analytical measurement range were excluded since the value above the range was not validated. A moderate correlation was observed between the IFN-γ levels in the CLIA-IGRA and QFT-GIT TB antigen tubes (R=0.75). In addition, the subgroup with background-corrected TB antigen values <5 IU/mL showed a linear regression slope of 0.57 (R=0.83), whereas the subgroup with values <1 IU/mL, near the cut-off value for diagnosing infection, showed a linear regression slope of 1.02 (R=0.89) (Fig. 1).
 | Fig. 1Comparison of the calculated IFN-γ value of the TB antigen tube minus the negative control between QFT-GIT and the CLIA-IGRA. The correlation between the two assays was determined for three subgroups: samples with a calculated IFN-γ value of (A)<5 IU/mL, (B)<2 IU/mL, and (C)<1 IU/mL.Abbreviations: IFN-γ, interferon gamma; TB, tuberculosis; QFT-GIT, QuantiFERON-TB Gold In-Tube; CLIA-IGRA, chemiluminescent immunoanalyzer-based IFN-γ releasing assay; R, Pearson's correlation coefficient.
|
AUC results are shown in Fig. 2. The AUC value was 1.00 (95% CI=0.99–1.00), and the cut-off value with the maximal sum of sensitivity and specificity was 0.30 IU/mL (99.49% sensitivity and 99.30% specificity). Using the manufacturer-suggested cut-off value of 0.35 IU/mL, the result showed comparable sensitivity (97.95%) and specificity (100.00%).
 | Fig. 2ROC curve of the CLIA-IGRA to diagnose latent tuberculosis infection. Infection was assessed based on the results of the QFT-GIT assay.Abbreviations: AUC, area under the curve; CI, confidence interval; CLIA, chemiluminescent immunoanalyzer-based interferon-gamma releasing assay; QFT-GIT, QuantiFERON-TB Gold In-Tube.
|
Go to :
DISCUSSION
We compared the analytical performance of CLIA-IGRA with that of the widely used QFT-GIT assay. Our results showed that CLIA-IGRA detects samples with very low levels of IFN-γ (LoQ=0.25 IU/mL) in a wide linear dilution range (0.25–200 IU/mL). This is in accordance with previous reports that a CLIA with magnetic microparticles has many advantages over ELISA [141516].
We found a moderate correlation across the analytical measurement range between the quantitative values obtained from both assays. In addition, we evaluated the correlation of value differences between the IFN-γ levels of the TB and NC tubes, which determine the status of infection. We found that the slope of the correlation model was 1.02, indicating a strong correlation despite the different measuring methods of the two assays.
AUC analysis indicated the cut-off value of CLIA-IGRA (0.35 IU/mL), which was the same as that of QFT-GIT assay, is acceptable for application. As the same cut-off value was applied to CLIA-IGRA and QFT-GIT assay, there is continuity in assay results; therefore, there will be less confusion for physicians and technicians when they analyze the assay results.
Of the 341 samples, three were discordant (0.88%) with negative CLIA-IGRA values bordering on the 0.35 IU/mL cut-off value, ranging from 0.26 to 0.30 IU/mL. Subject 1 was an HCW without any clinical symptoms and with a normal chest X-ray but was diagnosed as having LTBI solely by positive QFT-GIT assay. Woo, et al. [17] reported the conversion of results with borderline range, and no other assay, such as PCR, was performed for this sample, so it is difficult to conclude that the negative CLIA-IGRA result is incorrect. Subject 2 was also an HCW without medical records or additional laboratory results. Considering the positive TST induration results, the possibility of TB infection should be considered, although false positive results due to BCG vaccination cannot be excluded. As we could not evaluate the progress of the disease in this subject, we considered this case inconclusive. Subject 3 was diagnosed as having an active TB infection eight months prior to this study. Subject 3 received six months of medication, and other laboratory results, such as acid-fast bacillus (AFB) stain and PCR, were negative, indicating complete resolution of the infection. However, previous studies have described persistent IFN-γ response after LTBI treatment [1819]. High variation between studies on IGRA reversion rates after treatment has also been reported [2021]; thus, the use of IGRA for monitoring the treatment of TB remains controversial.
Our study had a number of limitations. The number of blood samples was small, and a limited number of discordant results was observed for the two assays. Of the three samples with discordant results, one was inconclusive owing to a lack of medical records. Availability of medical records with long term follow-up of discrepant subjects may be necessary for future studies to determine which of the two assays agrees with patients' clinical characteristics. In addition, samples were collected from HCWs and patients, which could have resulted in a higher proportion of positive results by both assays compared with the general population [2223]. Further investigations are required to explore the usefulness of the new CLIA-IGRA in a large population. We applied the recommended CLIA cut-off value to our study population, which included HCWs and patients; previous studies have reported the need for a higher cut-off value for IGRA in HCW settings [2425]. Therefore, future studies with a new cut-off value used in a large population comprising only HCWs are needed.
Finally, QFT-GIT assay is currently undergoing a transition to QuantiFERON-TB Gold Plus (QFT-Plus), with a four-sample tube system [26]. However, when our study was designed, QFT-GIT assay was widely used as a reference method; thus, we performed a comparison with QFT-GIT, which has the same three-tube system as the new CLIA-IGRA, to determine the speed and convenience of the new assay for providing acceptable results. Recent comparisons between QFT-GIT assay and QFT-Plus revealed that QFT-Plus shows better sensitivity in detecting recent TB contact [242728]. This is important for determining the relevance of CLIA-IGRA with respect to QFT-Plus in future studies.
In conclusion, automated CLIA-IGRA with the same cut-off value as QFT-GIT assay has continuity with existing assay results and comparable diagnostic performance. Thus, CLIA-IGRA can be a good alternative to QFT-GIT assay for LTBI diagnosis. CLIA-IGRA has a rapid turn-around time, is user-friendly, has the option of on-site analysis, and is best suited for a small clinic setting.
Go to :
 XML Download