

 PDF
PDF ePub
ePub Citation
 Print
Print


INTRODUCTION
MATERIALS AND METHODS
1. Subjects and ethics statement
2. Lower urinary tract symptoms/benign prostatic hyperplasia assessments
3. Metabolic syndrome assessment
4. Hormonal assay
5. Statistical analysis
RESULTS
1. Patient characteristics
Table 1
Participants' characteristics (n=5,582)
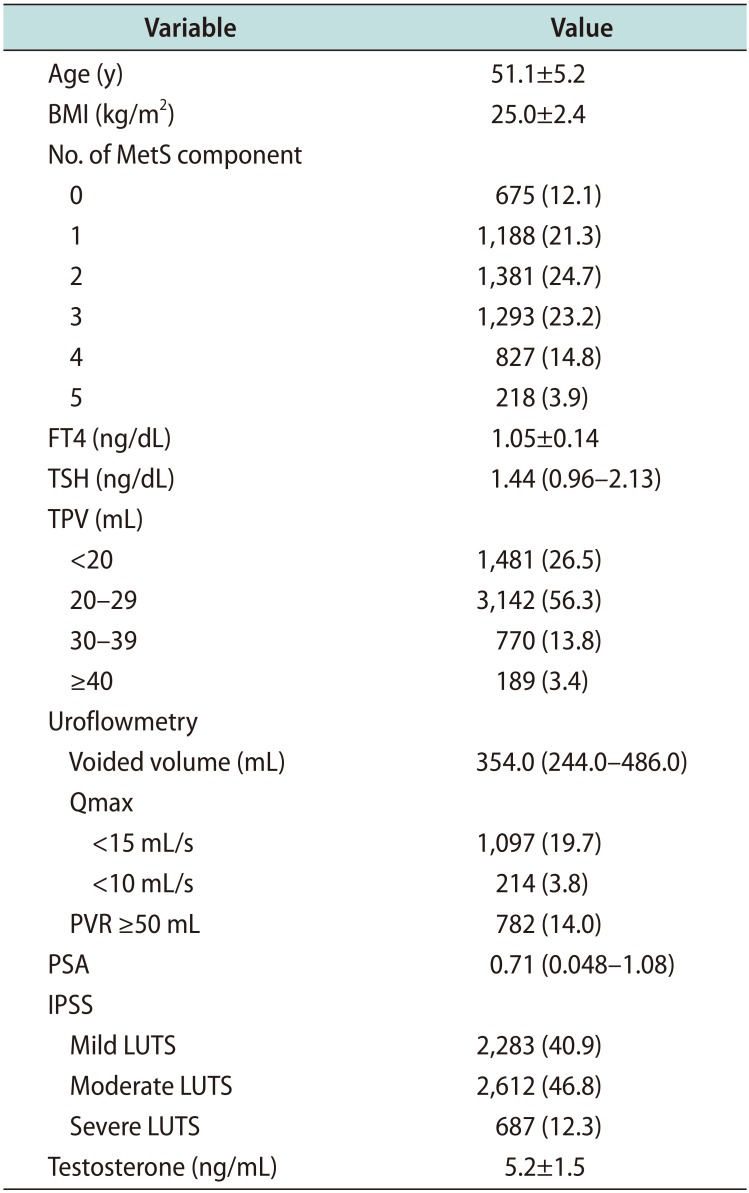
Values are presented as mean±standard deviation, number (%), or median (interquartile range).
BMI: body mass index, MetS: metabolic syndrome, FT4: free thyroxine, TSH: thyroid stimulating hormone, TPV: total prostate volume, Qmax: maximal flow rate, PVR: postvoid residual urine volume, PSA: prostate specific antigen, IPSS: international prostate symptom score, LUTS: lower urinary tract symptoms.
![]()
2. Free thyroxine and lower urinary tract symptoms/benign prostatic hyperplasia
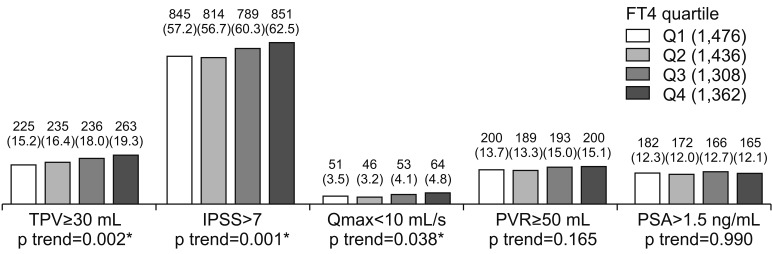 | Fig. 1Relationships between FT4 and LUTS/BPH measurements. Values are presented as number (%). Cochran-Armitage trend test were used for statistical analysis. FT4: free thyroxine, LUTS: lower urinary tract symptoms, BPH: benign prostatic hyperplasia, TPV: total prostate volume, IPSS: international prostate symptom score, Qmax: maximal flow rate, PVR: postvoid residual urine volume, PSA: prostate specific antigen, Q1: first quartile, Q2: second quartile, Q3: third quartile, Q4: fourth quartile. *p-value statistically significant <0.05.
|
Table 2
Adjusted ORs of FT4 for LUTS/BPH measurement
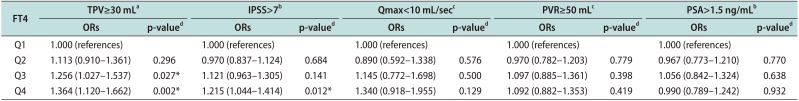
Values are presented as adjusted ORs (5%–95% confidence interval).
ORs: odds ratios, FT4: free thyroxine, LUTS: lower urinary tract symptoms, BPH: benign prostatic hyperplasia, TPV: total prostate volume, IPSS: international prostate symptom score, Qmax: maximal flow rate, PVR: postvoid residual urine volume, PSA: prostate-specific antigen, Q1: first quartile, Q2: second quartile, Q3: third quartile, Q4: fourth quartile.
aAdjusted for age, body mass index (BMI), testosterone level, and number of metabolic syndrome components. bAdjusted for age, BMI, testosterone level, number of metabolic syndrome components, and total prostate volume. cAdjusted for age, BMI, testosterone level, number of metabolic syndrome components, total prostate volume, and voided volume during uroflowmetry. dLogistic regression analysis. *p-value statistically significant <0.05.
![]()
3. Thyroid-stimulating hormone and lower urinary tract symptoms/benign prostatic hyperplasia
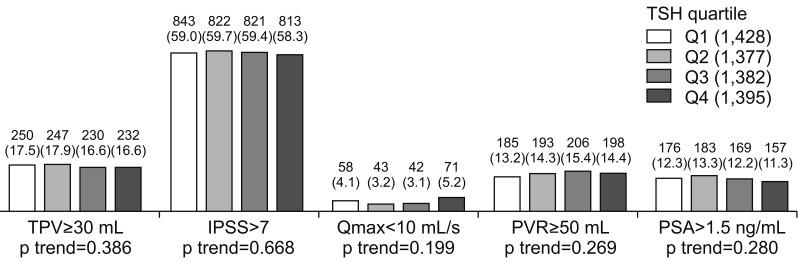 | Fig. 2Relationships between TSH and LUTS/BPH measurements. Values are presented as number (%). Cochran-Armitage trend test were used for statistical analysis. TSH: thyroid stimulating hormone, LUTS: lower urinary tract symptoms, BPH: benign prostatic hyperplasia, TPV: total prostate volume, IPSS: international prostate symptom score, Qmax: maximal flow rate, PVR: postvoid residual urine volume, PSA: prostate specific antigen, Q1: first quartile, Q2: second quartile, Q3: third quartile, Q4: fourth quartile.
|
Table 3
Adjusted ORs of TSH for LUTS/BPH measurement
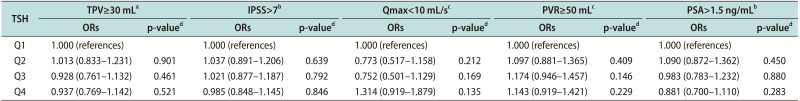
Values are presented as adjusted ORs (5%–95% confidence interval).
ORs: odds ratios, TSH: thyroid-stimulating hormone, LUTS: lower urinary tract symptoms, BPH: benign prostatic hyperplasia, TPV: total prostate volume, IPSS: international prostate symptom score, Qmax: maximal flow rate, PVR: postvoid residual urine volume, PSA: prostate-specific antigen, Q1: first quartile, Q2: second quartile, Q3: third quartile, Q4: fourth quartile.
aAdjusted for age, body mass index (BMI), testosterone level, and number of metabolic syndrome components. bAdjusted for age, BMI, testosterone level, number of metabolic syndrome components, and total prostate volume. cAdjusted for age, BMI, testosterone level, number of metabolic syndrome components, total prostate volume, and voided volume during uroflowmetry. dLogistic regression analysis.
![]()
4. Impact of testosterone level on the relationship between free thyroxine and total prostate volume
Table 4
Relationships between FT4 and TPV ≥30 mL according to testosterone level
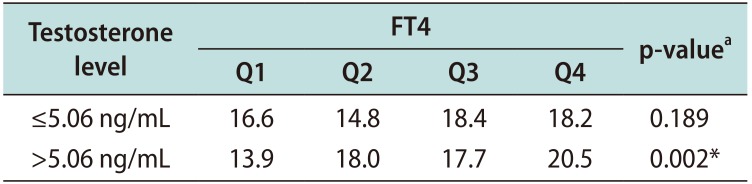
| Testosterone level | FT4 | p-valuea | |||
|---|---|---|---|---|---|
| Q1 | Q2 | Q3 | Q4 | ||
| ≤5.06 ng/mL | 16.6 | 14.8 | 18.4 | 18.2 | 0.189 |
| >5.06 ng/mL | 13.9 | 18.0 | 17.7 | 20.5 | 0.002* |
![]()
Table 5
Adjusted ORs of FT4 for TPV ≥30 mLa according to testosterone level
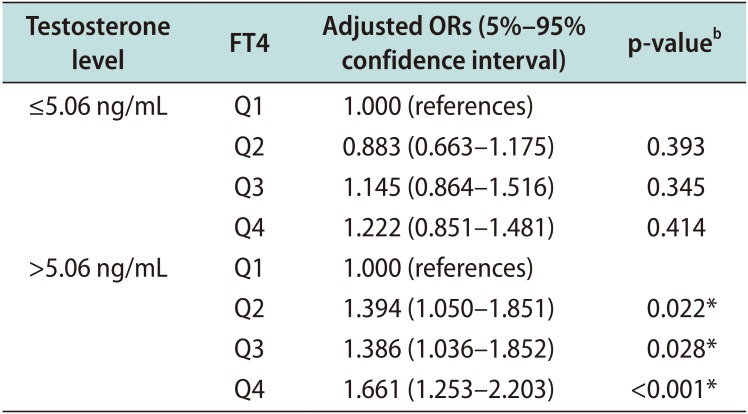
ORs: odds ratios, FT4: free thyroxine, TPV: total prostate volume, Q1: first quartile, Q2: second quartile, Q3: third quartile, Q4: fourth quartile.
aAdjusted for age, body mass index, and number of metabolic syndrome components. bLogistic regression analysis. *p-value statistically significant <0.05.
![]()
 XML Download