

 PDF
PDF ePub
ePub Citation
 Print
Print


Various diseases, including stroke, spinal cord injury, and cerebral palsy (CP), may result in central or peripheral nerve injuries and can cause denervation of muscles. Denervation of muscles results in muscle atrophy, decreased muscle strength, and diminished locomotor abilities. Denervation of muscles can also cause changes in muscle architecture.1 Muscle architecture is an important determinant of muscle function2 and is defined as the arrangement of muscle fibers within a muscle relative to the axis of force generation.3 Muscle architecture refers to bundles of fibers known as fascicles and is described by fascicle lengths (FLs) and pennation angles (PAs).4 Also contributing to muscle architecture are muscle-tendon properties, which are associated with functional performance.56
Ultrasonography (US) has become a popular method for characterizing muscle architecture because of its safety and noninvasive nature.7 The reliability of muscle architecture measurements by B-mode ultrasound imaging has been demonstrated in previous studies.89 Using US, changes in the muscle architecture of children with CP were reported after botulinum neurotoxin (BoNT) injection,10 and muscle architecture was compared between the paretic limbs and non-paretic limbs in chronic stroke patients.11
To the best of our knowledge, architectural changes of healthy muscle without any comorbid disease after denervation have not yet been reported. This study aimed to investigate architectural changes in the gastrocnemius muscles (GCMs) after aesthetic tibial nerve ablation in healthy adults using US. This was a prospective study conducted in a university-affiliated hospital. Ethical approval was granted by Yonsei University College of Medicine institutional review board and ethics committee (4-2016-0505).
We recruited 19 healthy adults who were scheduled to undergo aesthetic volume reduction of the medial GCM. Subjects were excluded if they had a previous history of (a) central nervous system disease, (b) neuromuscular disease, or (c) any surgical procedures at examined extremities, such as BoNT injection and liposuction. In total, 19 adults (17 females and 2 males) with ages ranging from 19–48 years (28.68±7.99) were enrolled. Thirty-eight limbs from 19 healthy adults underwent aesthetic tibial nerve ablation.
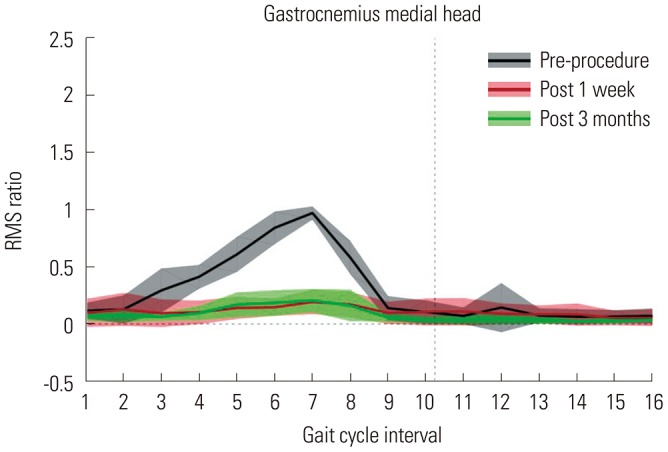
US was used to identify the location of nerves and vessels in the popliteal fossa and calf area, with the subject lying in a prone position. After local anesthesia using 1% lidocaine, a radio frequency probe connected to a 400-kHz electrical surgical unit (ITC-300D; ITC, Daejeon, Korea) was inserted through a small incision in the skin below the popliteal crease. After finding the exact location of the motor nerve branches to the medial GCM with electrical nerve stimulation and placing the tip of the probe on the nerve, radio frequency energy was transmitted to ablate the motor nerve branches innervated to the medial GCM. The surface of the radio frequency probe was insulated, except for the tip area, so that we could ablate nerve branches precisely with minimal injury to adjacent tissues. After the procedure, we confirmed that the nerve ablation was successful when the maximum root mean square (RMS) value of electromyography of the GCM decreased to at least 30% of the maximum pre-ablation value during walking.12 We recorded surface electromyography (MA300-XVI, Motion lab systems, USA; sampling frequency=1000 Hz) with the electrodes placed on the medial head of the GCM. RMS values were calculated for individual muscles. Pre- and post-procedure RMS values are expressed as a ratio of the maximum preprocedure RMS value (Fig. 1).
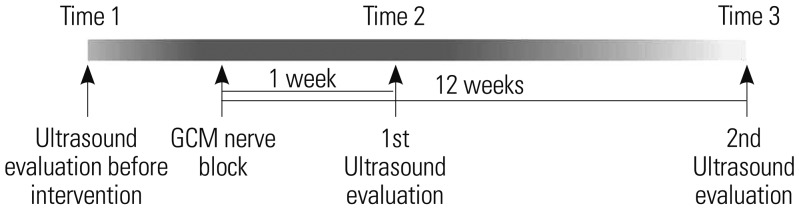
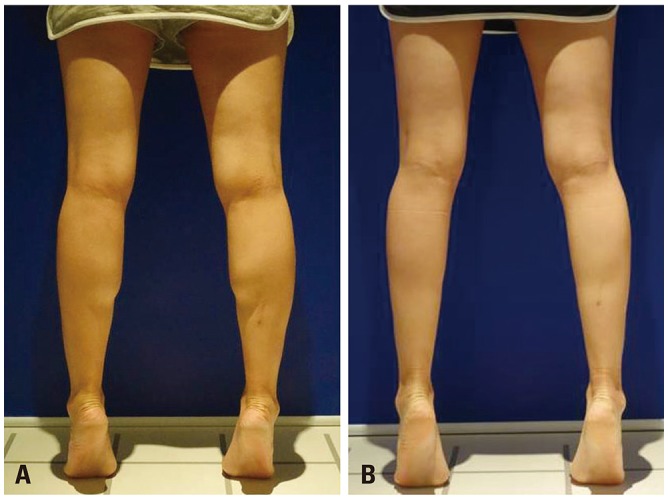
US images of medial GCMs were taken by a single trained physician using B-mode and real-time US (Accuvix V10c system; Samsung Medison, Seoul, Korea) with a linear-array probe (5–12 MHz) before nerve ablation, at 1 week after nerve ablation, and at 3 months after nerve ablation in an anatomical standing position with the feet approximately shoulderwidth apart (Figs. 2 and 3). US images were taken within 15 minutes per patient.
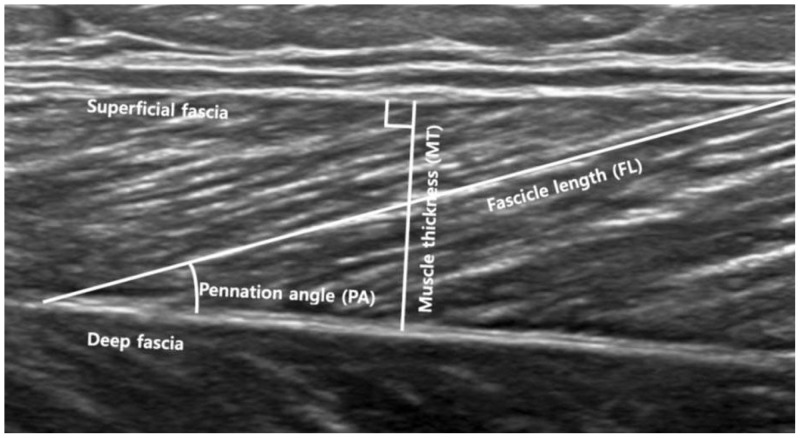
Muscle thickness (MT) was measured as the longest distance between the superficial and the deep fascia of the GCM in a longitudinal US image. Muscle FL was defined as the straight-line distance between the superficial and deep muscular fascia parallel to the lines of the collagenous tissue visible on the image. The PA was defined as the angle made between the upper fascia and the direction of the muscle fascicles (Fig. 4).
Statistical analyses were performed using SAS statistical software, version 9.4 (SAS Institute, Cary, NC, USA). A linear mixed model was applied to analyze data from repeated measurements. Parameters after tibial nerve ablation were compared to those before intervention to determine whether there were changes in muscle architecture. p<0.050 was considered statistically significant.
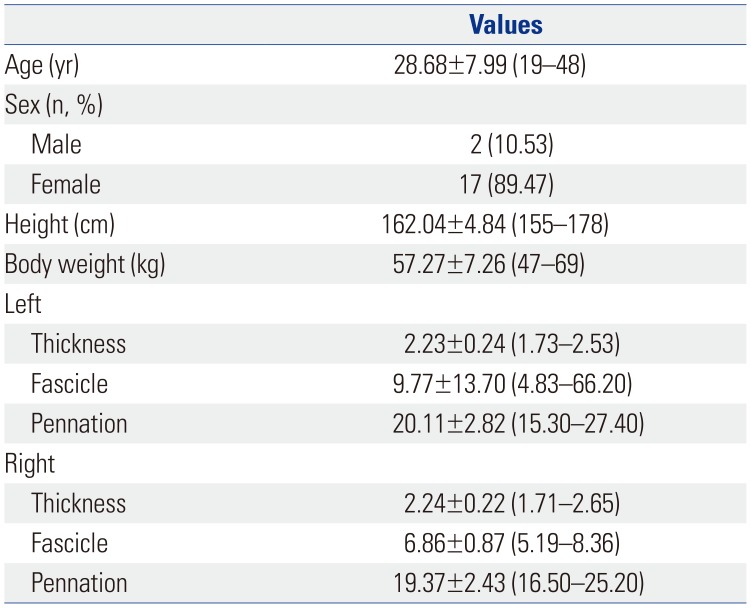
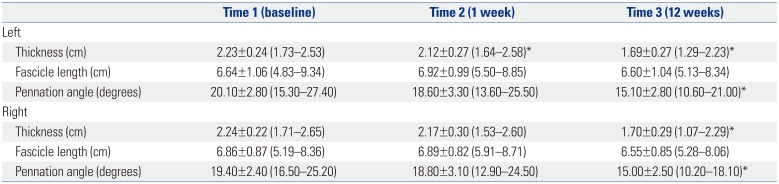
The clinical features of the participants are shown in Table 1. MT of the medial GCM was significantly reduced on the left side at 1 week and 3 months after tibial nerve ablation and on the right side 3 months after tibial nerve ablation (p<0.050). Although the FLs of the medial GCM were not significantly changed, the PAs of the medial GCM were significantly reduced on both sides at 3 months after tibial nerve ablation (p<0.050) (Table 2, Fig. 5).
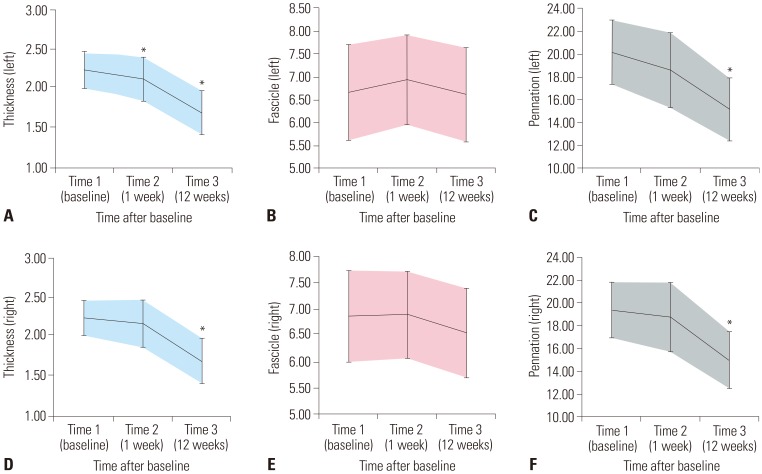 | Fig. 5Changes in muscle architecture parameters after tibial nerve block. Changes of (A) left gastrocnemius muscle (GCM) thickness, (B) left GCM fascicle length, (C) left GCM pennation angle, (D) right GCM thickness, (E) right GCM fascicle length and (F) right GCM pennation angle. Bars indicate one standard deviation. *p<0.050 vs. baseline (post-hoc test).
|
Table 1
Characteristics of Participants
![]()
Table 2
Changes in Muscle Architecture
![]()
Significant reductions in muscle volumes of paretic limbs in individuals with central nervous system lesions from CP and peripheral nervous system lesions from post-traumatic peripheral neuropathy have been demonstrated by magnetic resonance imaging in previous studies.1314 An in vivo US image study has also been successfully conducted in studies of muscular geometric architecture in humans. A US image study is faster, more convenient, and less expensive for assessing muscular architecture. According to previous reports, the architectural characteristics of muscle structures can be determined using conventional grayscale brightness mode (B-mode) ultrasound imaging to assess components of muscle morphology (structure) and morphometry (size) in exploration of muscle function.15161718 Musculoskeletal US is considered a potential tool for quantifying muscle architectural changes in vivo, revealing the arrangement of muscle fibers within a muscle.4
Architectural parameters, such as FL and PA, affect muscle functions, as well as intrinsic factors, such as fiber composition. 1920 In previous studies, human muscle architecture was observed in cadaver specimens and suggested to be related to functional characteristics,21222324 although very little data has been reported for healthy human muscles. FL is indicative of the number of sarcomeres in a series, whereas PA reflects the positive angle between muscle fibers and muscle aponeurosis.4 Muscle fiber length is the primary determinant of muscle excursion and is proportional to the maximum excursion of the muscle and velocity of contraction. Therefore, the fiber length to muscle length ratio is a good indicator of the design of skeletal muscle, either for producing high force or high excursion.2526 Unfortunately, the only method to determine muscle fiber length in muscle is to obtain whole, fixed muscles and to dissect individual fibers or fiber bundles from these fixed muscles. Most studies have measured the length of a small bundle of fibers, and thus, most of these lengths were actually FLs. The PA gives information about muscle strength, and the larger the PA, the more contractile material can be packed within a certain volume to increase the physiological cross sectional area of the muscle.27 An increase in PA therefore indicates an increase in the muscle's capacity to produce force.427
The present study showed that MT and PA for both sides were significantly decreased, whereas the FL for both sides was not significantly changed, in the medial GCMs of subjects in an anatomical standing position after tibial nerve ablation. Some previous studies have reported that toxin injection into healthy muscles induces muscle atrophy in animals28293031 and humans,13 although muscle architectural changes were not reported. In pathological studies, architectural changes after denervation have been analyzed using musculoskeletal US. The brachialis muscle showed shorter FL and the PA was larger in the affected side, compared to the unaffected side, in patients with stroke.11 Decreases in MT and PA and increases in FL were shown in the hemiplegic side of stroke patients at 2 months after BoNT-A injection when US examination was performed in the resting ankle position with knee extension.32 In children with spastic CP, the MT and PA were significantly decreased, whereas the FL was increased, at 1 and 3 months after BoNT-A injection in the resting ankle position. However, there was no significant change in FL in the neutral ankle position.10 Another recent study reported that PA decreased, while FL increased, at 12 weeks after BoNT-A injection in children with CP both in the resting and the maximum dorsiflexion position of the ankle.33 However, the changes in FL at the neutral ankle position was not reported in that study.
The above-mentioned changes in denervated FL could not be compared to our study because we performed US only in the neutral ankle angle (anatomical standing position), not in the resting ankle and the maximum dorsiflexion position of the ankle. As participants still had pain at 1 week after the procedure, maximum ankle DF and relaxed resting ankle position were difficult to maintain. Therefore, we used only a neutral ankle position.
While our study revealed no significant difference in FL, there were differences in PA before and after nerve ablation in the neutral ankle angle. This is similar to the results of a previous study in children with CP after BoNT-A injection.10 This suggests that the architectural changes of muscles after nerve ablation in healthy muscles were similar to those after BoNT-A injection in spastic muscles at a neutral ankle angle. Although a neutral ankle angle has an advantage of being able to measure and compare the muscle architecture more reliably, possible differences in architectural and physiological characteristics at a resting ankle angle between healthy and spastic muscles should also be considered. There has been few studies, however, to determine whether the resting sarcomere length of a spastic muscle is shortened, lengthened, or unchanged. If the resting sarcomere length is shortened in a spastic muscle due to pathological hypertonus, it might be lengthened after BoNT-A injection and the FL might be lengthened in the resting position. However, we could not study FL in a resting ankle position after nerve ablation in healthy muscle. In addition, we do not know how sarcomere length may change after denervation. Further study is needed to evaluate the microstructural changes (e.g., sarcomere length) after denervation in both healthy and spastic muscles that cannot be measured using US.
Previous studies demonstrated a significant relationship between MT and PA,27 as well as a significant decrease in the PA of healthy young adults in response to disuse.3435 Both muscle atrophy and a decrease in PA of the vastus lateralis muscles may be contributing factors to the decreased force production of the quadriceps observed in CP.4 The decreases in the PA and MT after nerve ablation in our study suggest a negative influence of denervation on the ability of healthy muscle to produce force.
This study was the first study to report on architectural changes of the GCM after tibial nerve ablation in healthy adults. The MT and PA of the muscle fascicle of the medial head of GCM were significantly reduced, although FL was not significantly changed in the anatomical standing position. Muscle architecture is a key determinant of muscle power and function. Further studies are therefore needed to determine the effect of structural changes of healthy muscles after nerve ablation on muscle power and function.
There were some limitations in our study. First, we only measured FL using US. As we did not evaluate the microscopic structure of the muscles, we could not determine changes in the number or length of sarcomeres: it is still unclear whether there are changes in the number or length of sarcomere after nerve ablation. Second, most of the subjects were females, and sex differences might have been a limitation. A previous study reported sex differences in muscle architecture in human soleus and GCMs in healthy adults.36 Third, we only assess changes in the neutral ankle position, and muscle architecture at various ankle angles was not analyzed. These limitations should be addressed in future studies.
 XML Download