

 PDF
PDF Citation
 Print
Print


INTRODUCTION
In Korea, as a result of an increasingly westernized diet with an elevated standard of living owing to rapid economic growth and social and economic changes, hypernutrition has surfaced as a key problem in society.1 Further, changes in family structures, such as increases in one-person households and double-income families, have led to an increasing need for and consumption of easy-to-cook and convenient processed food products, and the Korean food industry has accordingly seen advances and growth in this market.2 Consumption of processed foods has induced nutritional imbalance, particularly characterized by increased animal fat and sodium intake,3 which, along with reduced physical activity, has increased the prevalence of chronic diseases and obesity.45
With the increased consumption of processed foods, the Korean government requires food labeling, per Articles 10 and 11 of the Food Sanitation Act, to help people reasonably choose processed food products. The food labeling system, which presents nutritional information for processed foods, was first implemented by Ministry of Health and Welfare announcement number 1994-28 in 1994, and since enactment with announcement number 95-67 in 1996 it has been revised more than 30 times to expand the scope of food items and nutrients and revise the terminology so as to promote better delivery of nutritional information and help consumers make reasonable choices.678
Regarding international food labeling requirements, according to the World Health Organization’s 2nd Global Nutrition Policy Review (2018), among the 10 policy measures for promoting a healthy diet in 163 countries worldwide, food labeling policies differ across countries. Such labeling is actively promoted in advanced countries, such as the United States (90%) and European countries (100%), but is poorly implemented in Eastern and Western Asian countries (55%).9 In Australia and New Zealand, the Food Standards Australia New Zealand program made food labeling for packaged foods mandatory in 2002 with the Australia New Zealand Food Standards Codex, and in 2014, Australia's Department of Health implemented the Health Star Rating, where star ratings are given for retail packaged foods based on nutrition profiling scores.10
Systematic reviews of the link between food labeling and healthy eating show that food labels are used as an important strategic factor to cope with obesity and unhealthy eating. In a meta-analysis of randomized studies, people who use food labeling chose 17.95% more healthy food than those who did not11; food labeling decreased energy intake by 6.6%, decreased total fat by 10.6%, and increased consumption of vegetables by 13.5%.12 A systematic review of the effects of consumer understanding and use of food labeling on food habits has also shown a strong correlation between food labeling and healthy diets.13 Meanwhile, the demographic factors affecting the utilization of food labeling include gender, age, education,713141516 income level,7 race,717 marital status,715 and occupation.18 These results serve as evidence supporting the proposition that utilization of food labeling assists consumers to choose food products that suit their needs and that food labeling is an important, efficient method for preventing chronic diseases and obesity, which are currently serious problems in society. However, despite a significant increase in the awareness of the food labeling system in Korea since its implementation 20 years ago, utilization of the system still remains low. According to a study, awareness of food labeling among Koreans was about 43%, but only 17% utilized the labeling in their food choices, showing that utilization rate is far below the awareness rate.19 To promote and support the use of food labeling through policies, it is important to investigate the current state of food labeling utilization and the characteristics of users and non-users of food labels. Thus, this study aimed to examine the trends in food labeling utilization among Koreans and identify the demographic characteristics of users and non-users in order to provide foundational data for developing strategies to promote a healthy diet by facilitating the use of food labeling.
METHODS
Data and participants
The data for this study were aggregated from data for 254 cities, districts, and boroughs in the 2014–2017 Community Health Survey (CHS).20 The CHS was launched in communities in 2008 per Article 4 of the Regional Public Health Act and has been conducted every year since to help lay a foundation for community health projects. A complex sample design was used, where samples were first stratified according to Dong/Eup/Myeon in the community, and the type of residence (apartment, house) was sampled via probability proportional to size for Tong/Ban/Ri; sample households were then chosen via systematic sampling. Trained interviewers visited each selected household to interview adult household members aged 19 years or older, using a computer.21 Data from participants who responded to the questions regarding food labeling awareness, comprehension, and utilization were used for this study. After excluding missing values, the number of participants included in this study was 227,615 in 2014, 226,699 in 2015, 227,526 in 2016, and 227,355 in 2017.
Study variables
Awareness of food labeling
The questionnaire on nutrition indicators conducted by the CHS was used to analyze nutrition indicators. People who answered “yes” to the question of whether they are aware of food labeling were classified into the awareness group, and those who answered “no” were classified into the non-awareness group. Annual trends in this variable were also analyzed.
Utilization of food labeling
The CHS questionnaire on nutrition indicators was used for this analysis. People who answered “yes” to the question of whether food labeling in processed foods impacts their food choice were defined as “users,” and those who answered “no,” did not know about food labeling, or did not read food labels were defined as non-users. Annual trends in this variable were analyzed, and it was used as the dependent variable in the final decision tree analysis.
Food-labeling-related sociodemographic characteristics
The demographic variables related to food labeling in previous studies were used as variables in this study: gender (men/women), age (20s, 30s, 40s, 50s, 60s, and ≥ 70s), education level (not educated/elementary school/middle school/high school/college/attending graduate school or graduated from it), marital status (married/single/divorced, widowed, separated), occupation (professional and administrative/office/sales and service/farming and fishing/technician and simple labor/other), and monthly household income (less than 1,000,000 KRW, 1,000,000–2,000,000 KRW, 2,000,000–3,000,000 KRW, 3,000,000–4,000,000 KRW, more than 4,000,000 KRW). Occupation and monthly household income were divided into categories provided by the CHS. These variables were used as independent variables in the decision tree analysis.
Analysis
First, the Cochran-Armitage trend test was used to examine whether food labeling awareness and utilization had increased over the years from 2014 to 2017. Then, demographic factors related to the utilization of food labels for each year were identified and segmented. Segmentation analysis was used because it can be easily applied to help guide policies and public information efforts related to food labeling with regard to demographic factors. Usually, geographical and demographic approaches are used in the segmentation analysis22; from among them, the decision tree analysis model was used here. This is a data-mining method—a technique common in the health sector to decide priorities. Decision tree analysis is a nonparametric method that does not require the process of searching for outliers in advance to analyze the existing parametric model, selecting the variables needed for analysis, or finding the interaction effects that should be included in the model. It enables the analyst to easily understand and explain the process and results and has the advantage of finding interaction effects among the variables.23 In this study, the target variable was whether the food label was used, and the predictor variables were the demographic characteristics. The χ2 automatic interaction detection was used for the model algorithm, and the model was evaluated with cross-validation. All analyses were performed using IBM SPSS Statistics (Ver. 24.0; IBM Corp., Armonk, NY, USA) and R (Ver. 3.5.2; R Foundation for Statistical Computing, Vienna, Austria).
RESULTS
General characteristics of participants
Table 1 shows the general characteristics of the participants. A higher percentage of participants were women, at 54.9%. In terms of age group, 10.9% were in their 20s, 14.0% in their 30s, 18.2% in their 40s, 19.9% in their 50s, 16.8% in their 60s, and 20.1% in their 70s or older. Regarding education level, 11.0% were below elementary graduation level, 15.0% were elementary graduates, 10.9% were middle school graduates, 33.3% were high school graduates, 26.4% were college (including 2- and 3-year college) graduates, and 3.4% were attending graduate school or had graduated from it. Regarding marital status, 68.0% were married, 15.4% were single, and 16.6% were divorced/widowed/separated.
Table 1
Distribution of population's sociological characteristics
![]()
Trends in food labeling awareness and utilization
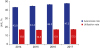
Food labeling awareness increased by 4.5% over the 4 years, with 43.0% in 2014, 44.4% in 2016, 46.2% in 2016, and 47.5% in 2017, and the Cochran–Armitage trend test confirmed that the increasing trend was statistically significant (χ2 = 1,068.210; P < 0.001). Food labeling utilization increased by 0.3% over the 4 years, with 17.0% in 2014, 16.5% in 2015, 17.1% in 2016, and 17.3% in 2017, and the Cochran-Armitage trend test confirmed that the increasing trend was statistically significant (χ2 = 20.154; P < 0.001) but marginal (Fig. 1).
Decision tree analysis for food labeling users and non-users
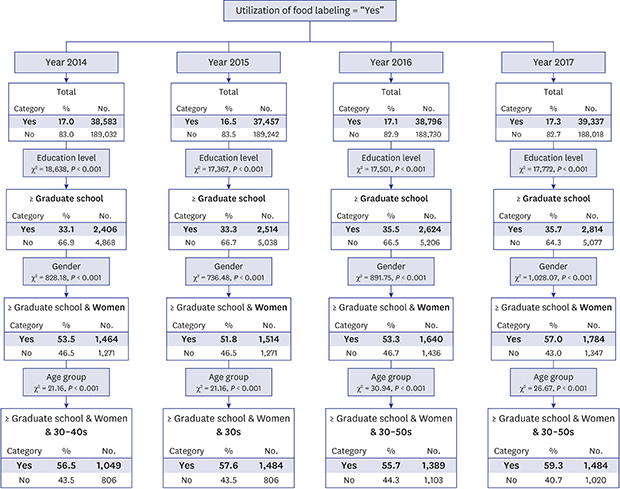
Figs. 2 and 3 show the segmentation of decision tree analysis for food labeling utilization over the past 4 years. The major factors that determine the utilization of food labeling were education level, gender, age, and marital status; occupation and household income did not appear to be main factors. The characteristics of the user and non-user groups were suggested on the basis of these results. In the model evaluation, the misclassification rate was 1.51%–1.71% (classification accuracy 82.9%–84.9%), with a standard error of 0.001–0.002.
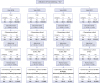
Segmentation of the user groups
First, the characteristics of the user groups were identified (Fig. 1). In 2014, the food labeling utilization rate was 17.0%. The top split criterion was education level (χ2 = 18,638; P < 0.001), where the utilization rate among those “currently attending graduate school or higher” was 33.1%, showing a 16.1% increase from the preceding node. The second split criterion was gender (χ2 = 828.18; P < 0.001), where the utilization rate among women was 53.5%, a 20.4% increase from the preceding node. The third split criterion was age (χ2 = 21.16; P < 0.001), where the utilization rate among those in their 30s–40s was 56.5%, a 3.0% increase from the preceding node. Thus, women in their 30s–40s who were currently attending graduate school or higher constituted the core user group in 2014.
In 2015, the food labeling utilization rate was 16.5%. The top split criterion was education level (χ2 = 17,367; P < 0.001), where utilization rate among those “currently attending graduate school or higher” was 33.3%, showing a 16.8% increase from the preceding node. The second split criterion was gender (χ2 = 736.48; P < 0.001), where the utilization rate among women was 51.8%, an 18.5% increase from the preceding node. The third split criterion was age (χ2 = 21.16; P < 0.001), where the utilization rate among those in their 30s was 57.6%, a 5.8% increase from the preceding node. Thus, women in their 30s who were currently attending graduate school or higher constituted the core user group in 2015.
In 2016, the food labeling utilization rate was 17.1%. The top split criterion was education level (χ2 = 17,501; P < 0.001), where utilization rate among those “currently attending graduate school or higher” was 35.5%, an 18.4% increase from the preceding node. The second split criterion was gender (χ2 = 891.75; P < 0.001), where the utilization rate among women was 53.3%, indicating a 17.8% increase from the preceding node. The third split criterion was age (χ2 = 30.94; P < 0.001), where the utilization rate among those in their 30s–50s was 55.7%, displaying a 2.4% increase from the preceding node. Thus, women in their 30s–50s who were currently attending graduate school or higher constituted the core user group in 2016.
Finally, in 2017, the food labeling utilization rate was 17.3%. The top split criterion was education level (χ2 = 17,772; P < 0.001), where utilization rate among those “currently attending graduate school or higher” was 35.7%, an 18.4% increase from the preceding node. The second split criterion was gender (χ2 = 1,028.07; P < 0.001), where the utilization rate among women was 57.0%, indicating a 21.3% increase from the preceding node. The third split criterion was age (χ2 = 26.67; P < 0.001), where the utilization rate among those in their 30s–50s was 59.3%, showing a 2.3% increase from the preceding node. Thus, women in their 30s–50s who were currently attending graduate school or higher constituted the core user group in 2017.
Segmentation of the non-user group
In 2014, the non-utilization of food labeling was 83.0%. The top split criterion was education level (χ2 = 17,772; P < 0.001), where the non-utilization rate among individuals with elementary school education or lower was 99.1%, showing a 16.1% increase from the initial node (17.0%). The second split criterion was age (χ2 = 260.16; P < 0.001), where the non-utilization rate among individuals in their 70s or higher was 99.5%, indicating a 0.4% increase from the preceding node. The third split criterion was marital status (χ2 = 14.14; P = 0.001), where the non-utilization rate among those divorced/widowed/separated was 99.7%, showing a 0.2% increase from the preceding node. Thus, currently divorced/widowed/separated individuals in their 70s or higher with elementary school education or lower constituted the core non-user group in 2014.
In 2015, the non-utilization of food labeling was 83.5%. The top split criterion was education level (χ2 = 17,501; P < 0.001), where the non-utilization rate among individuals with elementary school education or lower was 99.0%, showing a 15.5% increase from the preceding node. The second split criterion was age (χ2 = 317,75; P < 0.001), where the non-utilization rate among individuals in their 30s and those in their 70s or higher was 99.4%, showing a 0.4% increase from the preceding node. The third split criterion was marital status (χ2 = 13.35; P = 0.002), where the non-utilization rate among those divorced/widowed/separated was 99.5%, indicating a 0.1% increase from the preceding node. Thus, currently divorced/widowed/separated individuals in their 30s or 70s or higher with elementary school education or lower constituted the core non-user group in 2015.
In 2016, the non-utilization of food labeling was 82.9%. The top split criterion was education level (χ2 = 17,367; P < 0.001), where the non-utilization rate among individuals with elementary school education or lower was 99.0%, showing a 16.1% increase from the preceding node. The second split criterion was age (χ2 = 126.10; P < 0.001), where the non-utilization rate among individuals in their 20s and those in their 70s or higher was 99.5%, indicating a 0.5% increase from the preceding node. The third split criterion was marital status (χ2 = 14.14; P = 0.001), where the non-utilization rate among those divorced/widowed/separated was 99.6%, displaying a 0.1% increase from the preceding node. Thus, currently divorced/widowed/separated individuals in their 20s or 70s or higher with elementary school education or lower constituted the core non-user group in 2016.
In 2017, the non-utilization of food labeling was 82.7%. The top split criterion was education level (χ2 = 18,638; P < 0.001), where the non-utilization rate among individuals with elementary school education or lower was 98.9%, indicating a 16.2% increase from the preceding node. The second split criterion was age (χ2 = 248.17; P < 0.001), where the non-utilization rate among individuals in their 70s or higher was 99.4%, showing a 0.5% increase from the preceding node. The third split criterion was marital status (χ2 = 10.56; P = 0.008), where the non-utilization rate among those divorced/widowed/separated was 99.6%, showing a 0.2% increase from the preceding node. Thus, currently divorced/widowed/separated individuals in their 70s or higher with elementary school education or lower constituted the core non-user group in 2017.
DISCUSSION
Maintaining a healthy diet is an important strategy to prevent chronic disease and improve quality of life. Food labeling is a policy that encourages informed food choices among consumers by providing reliable information about various nutrients in processed food products. Its importance as a means for consumers to maintain a healthy diet has been emphasized,24 and in Korea it has gained attention in the field of healthcare policies consequent to its use as an index for healthy diet compliance in the fourth Health Plan (2016–2020). However, a 2016 report by the Korea National Health and Nutrition Examination Survey reported a utilization rate of only 32.8%–38.3% over the past 10 years,25 and this study was planned in an attempt to investigate the current utilization of food labeling and devise strategies to promote a healthy diet.
In the present study, awareness of food labeling was 47.5%, showing that more than half of the adult population is unaware of food labeling, and the utilization rate was even lower, below 20%. Furthermore, the utilization of food labeling did not increase significantly over the past 4 years. Food labeling utilization was the most influenced by consumers' education level, where more educated individuals utilized food labeling more frequently. You et al.16 also reported that food labeling utilization increases with education level, and Lee and Lee2 found that food labeling utilization was markedly higher among those who were college graduates or higher than among those with elementary school education or lower. Although it was not statistically insignificant, Chung and Kim26 also found that food labeling utilization increases with education level. In a study on American adults, food labeling utilization has been reported to be influenced by young age and high socioeconomic class, also supporting the findings of our study.17232728
The fact that education level has the greatest impact on food labeling utilization is attributable to health literacy. Food labels contain information about the nutrients and calories of processed food products, and thus consumers can calculate what percentage of the daily recommended nutrition intake they are consuming in the corresponding food product by reading the food label. This requires a conceptual understanding of nutrients, as well as basic mathematical skills, which calls for a certain level of health literacy. According to Kwon et al.,18 compared to college graduates or higher, individuals with middle school education or lower wanted food labels to be easier to read, based on which they suggested that comprehension of food labels differ according to education level. Furthermore, according to the 2013 Consumer Awareness of Food Labeling Survey by the Ministry of Food and Drug Safety, only 24.1% of the Korean population claimed that Korea's food labeling is easy to understand, and Chung and Kim26 also reported that about 80% of participants did not have an accurate understanding of the nutrition facts on the label. International studies have also suggested that the comprehension of food labels is correlated with education level.2930 Education level is a classic socioeconomic index, and if less-educated people tend not to utilize food labels this can lead to health inequity. Thus, food labeling should be reformed in consideration of the health literacy of less-educated people. In addition, compared to data in 2014 and 2015, food labeling utilization has been higher among highly educated women in their 50s since 2016. Past studies have reported that food labeling utilization decreased with advancing age, even among women,3163132 but results are contradictory when they are analyzed by education level. According to a Statistics Korea report, 11.8% of the elderly population aged 65 years or older in 2015 were community college graduates or higher, and that percentage was expected to rise in the coming years.33 Considering the rapid aging of the Korean society, relevant food labeling strategies are needed.
From the perspective of health communication, images and pictures may boost consumers' understanding.3435363738 Acton et al.39 reported that food labels with intuitive designs can be understood by all consumers, and, regarding the numbers shown in food labels, illustrative charts, such as bar graphs, are effective for promoting comprehension among less-educated adults.4041 For instance, a non-Korean systematic review reported that providing easy-to-understand data with infographics, such as traffic lights, with nutrition information is effective in promoting a healthy diet among consumers.42 Therefore, utilizing infographics in food labeling may be a good strategy to promote the use of food labeling among consumers in their choice of processed food products.
On the other hand, this study confirmed the insignificant effects of income level and occupation on the utilization of food labeling. Preceding literature includes studies that found a significant relationship between income level and utilization of food labeling,131743444546 studies that did not find such a significant relationship,47484950 studies that found an effect of occupation characteristics on the utilization of food labeling,474951 and studies that found no such effect.52535455
The income level used for this study is household income, for which the categorical variable was used. Different studies have used various methods to categorize occupations, resulting in differences in outcomes. In addition, unlike previous studies that used a general linear model, this study utilized a decision tree analysis; this, too, can explain some of the difference in results. More in-depth results can be expected if further research is conducted using continuous variables at the individual level.
This study has a few limitations. First, it was a cross-sectional study, and thus it is difficult to identify a causal relationship between food labeling utilization and demographic variables. Second, because of the nature of self-reported surveys, we could neither confirm whether consumers actually utilize food labeling nor examine the nutrients they consume or the degree of their understanding of food labeling. Nevertheless, this study is significant in that its findings and approach can be readily used to formulate strategies for community nutrition education programs based on the characteristics of specific groups by using locally representative data, segmenting different populations according to demographic characteristics, and determining homogeneous subgroups.
This study investigated trends in food labeling awareness and utilization and analyzed the utilization rate in relation to demographic characteristics. Our results showed that food labeling awareness and utilization rates have continuously increased, but they still remain low, and that the increase in utilization rate was statistically significant but marginal. Food labeling utilization was influenced by education level, gender, age, and marital status. The food labeling user group predominantly comprised women in their 30s–50s who were currently attending graduate school or higher, while the non-user group predominantly comprised currently divorced, widowed, or separated individuals in their 70s with elementary school education or less.
The fact that education level is a determinant of food labeling utilization has a significant implication from the perspective of health literacy in terms of social and health inequity. Because food labels that are difficult to comprehend hinder utilization, measures to enhance comprehensibility for all individuals and sufficient education programs are needed. An additional customized strategy will be needed, however, for those in their 70s, who are often under-educated, not living with spouses, and do not use food labels.
A new food labeling system in Korea was launched in January 1, 2018, and it needs to be evaluated in subsequent studies. The findings of this study may be used as effective foundational data to develop strategies for community-based education programs and promote the utilization of food labeling.
 XML Download