

 PDF
PDF ePub
ePub Citation
 Print
Print


The critical shoulder angle (CSA) is the angle created between the superior and inferior bone margins of the glenoid and the most inferolateral border of the acromion. Moor et al.1) introduced the concept of CSA and suggested that an abnormal CSA value was an associated factor in the development of osteoarthritis and a rotator cuff tear. However, the CSA is measured on the true anteroposterior (AP) view of the shoulder (Grashey view) that is influenced by the scapular position, patient's position, beam angle, and cassette position. In particular, the CSA measured in two-dimensional (2D) X-ray can vary according to scapula rotation. Moor et al.1) reported that the variability of CSA was less than 2° for up to 20° of malposition of the scapula, and they excluded cases with a positional error of 20° or more from the analysis. Suter et al.2) reported that the CSA in 2D X-ray can be measured with < 2° error compared with the true shoulder AP view, provided there is no double contour of > 50% of glenoid height or an inverted teardrop pattern at the upper glenoid rim. According to these papers, scapular rotation that leads to less than 2° CSA deviation is allowed in CSA measurement. However, we raised the question whether even a < 2° CSA deviation due to scapular malrotation could act as a bias. In addition, if the measurement result is different according to presence and absence of this bias, the clinical result may be misinterpreted. In this study, we aimed to determine the difference in the CSA measured in minimal rotation between patients with rotator cuff tears and those without and to investigate the extent of CSA measurement error according to the scapular position by comparing with computed tomography (CT) that is relatively unaffected by scapular position and beam projection angle.
METHODS
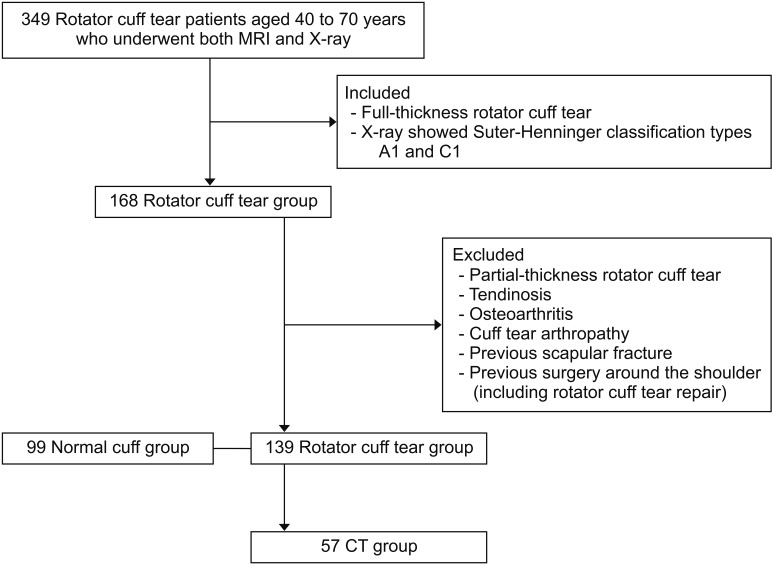
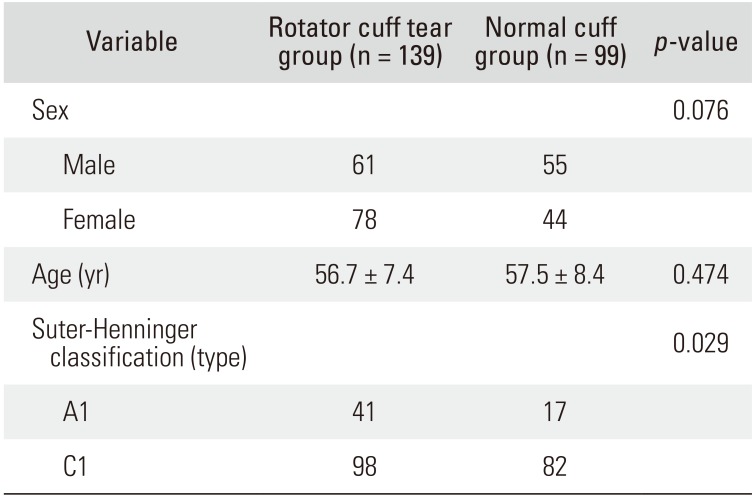
The protocol of this study was reviewed and approved by Institutional Review Board of Inje University Busan Paik Hospital (IRB No. 17-0241). We retrospectively reviewed records of consecutive patients aged 40 to 70 years who underwent both magnetic resonance imaging (MRI) and X-ray of the shoulder between January 2014 to June 2016. Patients were included in the study if they had full-thickness rotator cuff tears and their X-ray views corresponded to Suter-Henninger classification2) type A1 (perfect overlap between anterior and posterior glenoid rims) or C1 (imperfect overlap between the anterior and posterior glenoid rim in the inferior 50% of the glenoid but with overlap between the coracoid and the superior glenoid pole). Patients with (1) partial-thickness rotator cuff tears, (2) tendinosis, (3) osteoarthritis, (4) cuff tear arthropathy, (5) previous scapular fractures, and (6) previous surgery around the shoulder (including rotator cuff tear repair) were excluded. We enrolled patients who did not have rotator cuff lesion on MRI (such as frozen shoulder, contusion, and soft tissue mass) as a control group. A total of 238 patients (rotator cuff tear group, 139 patients; normal cuff group, 99 patients) were selected as final subjects. The mean tear size in the rotator cuff tear group was 2.1 ± 1.2 cm (small to medium sized tear, 108 patients; large to massive sized tear, 31 patients). Among the rotator cuff tear group patients, those who underwent preoperative CT for surgical treatment were assigned to the CT group (57 patients) and the CSA values according to imaging modality (CT vs. X-ray) were also compared (Table 1 and Fig. 1).
Imaging Protocols of X-ray
All radiographs were taken with a beam-to-film distance of 1.1 m at 70 kVp and 63 mAs (DHF-158HII; Hitachi, Tokyo, Japan). True AP views were obtained with the patient's shoulder rotated posteriorly by approximately 35° to 45° such that the plane of the scapula was parallel to the cassette. The beam was directed tangentially to the glenohumeral joint, and upper arm rotation was neutral.3)
Imaging Protocols of CT
All scans were performed with the patient in the supine position with the arm by the side and the hand on the lateral aspect of the thigh. All imaging procedures were performed on a Siemens healthcare scanner (SOMATOM 128; Forchheim, Germany), using a single-energy CT protocol with 120 kVp, 180 mA, dose modulation, 0.6-mm collimation, effective pitch of 0.8, B60 (sharp) reconstruction kernel, reconstructed slice thickness of 1.0 mm, and slice increment of 1.0 mm.
Methods of CSA Measurement Using X-ray
The CSA was measured using the Picture Archiving Communication System (PACS; Marosis m-view, Marotech, Seoul, Korea) software on a high-resolution LCD (liquid crystal display) monitor. The minimal detectable angular change was 0.1 ° . Measurement was performed on the true AP view with a digitally embedded tool. We measured the angle between a line drawn from the inferiormost subchondral glenoid to the most inferolateral acromial edge and a line passing the superior and inferior bone margins of the glenoid on an enlarged radiographic image.
Methods of CSA Measurement Using CT
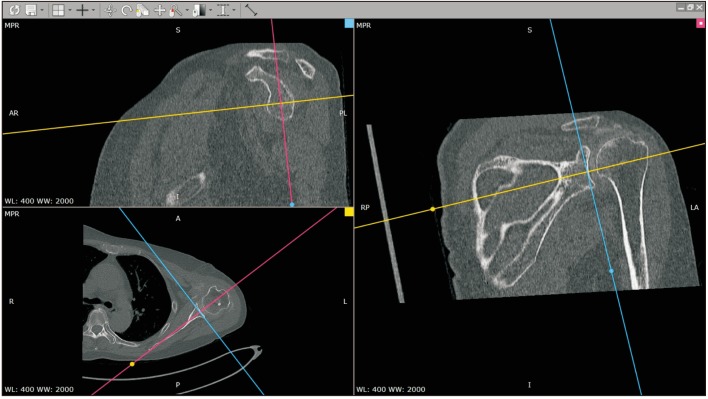
Digital Imaging and Communications in Medicine (DICOM) files of CT were imported on the image analysis software (RadiAnt DICOM viewer, Medixant, Poznan, Poland). Using a 1-mm-thick axial CT image, a multiplanar reconstruction (axial, sagittal, and coronal images) was performed. The respective planes were set so that they were kept at 90° to each other. The position where the planes were scanned on each plane was indicated by a line, and the positional relationship between the planes was confirmed. The CT scans were reconstructed according to the axis of the scapula, using the anatomic analysis method proposed by Sabesan et al.4) The plane passing through the angular inferior trigonum scapulae and glenoid center of the scapula was defined as a scapular plane, and an axial plane perpendicular to the scapular plane and passing through the center of the glenoid was obtained (Fig. 2). After setting the axial, coronal, and sagittal views of the CT image to be visible at the same time, we reconstructed the plane passing through the angular inferior trigonum scapulae and glenoid center of the scapular plane. The scapular axis, which was perpendicular to this plane and was the line representing this plane in the axial plane passing through the glenoid center, was obtained. We found the axis that passed through the superior and inferior poles of the glenoid and the acromion's most lateral point that meets the scapular axis. We found the coronal slice cut that passed the three points of the glenoid superior and inferior poles and the acromion's most lateral point, and exported it into the image-measuring software (Rhino 6; McNeel, Seattle, WA, USA) to measure the CSA (Fig. 3). Two independent observers measured the angle twice per two different measurement sessions with a 2-week interval to improve inter- and intraobserver reliability.
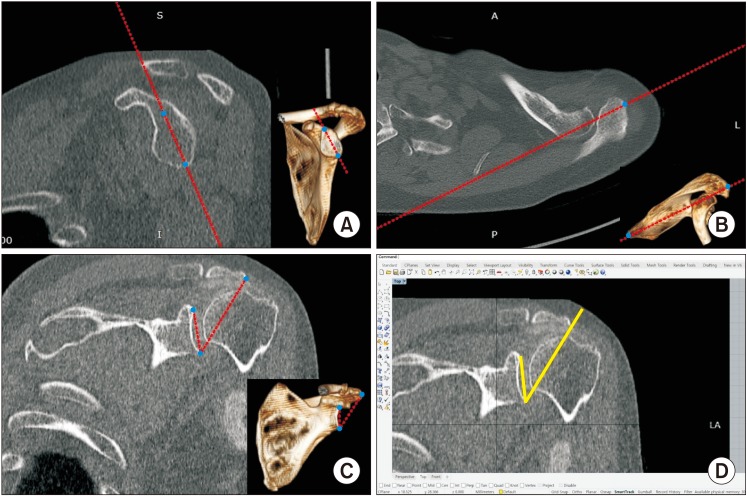 | Fig. 3Measurement of the critical shoulder angle (CSA) on computed tomography scans. The scapular axis was set to pass through the superior and inferior poles of the glenoid (A) and be tangent to the most lateral point of the acromion (B). (C) The line that passes through the superior and inferior poles of the glenoid and another line that connects the inferior pole of the glenoid and the most lateral point of the acromion were drawn to measure the CSA. (D) The CSA measured using the image-measuring software (Rhinoceros 6) was 38.5° in this case.
|
Statistical Analysis
Statistical analysis was performed using IBM SPSS ver. 24.0 (IBM Corp., Armonk, NY, USA). Normality of continuous variable was tested by Shapiro-Wilk test. Student t-test was used for continuous variables with normal distribution. Mann-Whitney U-test was used for non-normal distributions. Intraclass correlation coefficients were employed to evaluate the intra- and interobserver reliability of the CSA measurements. To calculate the sample size, an a priori power analysis was performed, with alpha set at 0.05 and the power at 0.80. In a pilot study (n = 20), the CSA measured by CT was 32.3° ± 3.1° and the CSA measured by X-ray was 34.4° ± 3.3°. The number of cases that was needed to detect a difference between the CSA was 60. In the present study, 138 cases were included in the analysis. All tests were analyzed at the 95% confidence level. The level of significance was set at 0.05.
Go to : 
RESULTS
Intra- and interobserver reliability of CSA measurement by CT was 0.965 and 0.943, respectively; the reliability by X-ray was 0.897 and 0.882, respectively.
CSA According to Rotator Cuff Tear
Among the 139 patients in the rotator cuff tear group, Suter-Henninger classification type A1 was found in 41 patients, and C1, in 98 patients. Of the 99 patients in the normal cuff groups, Suter-Henninger classification type A1 was found in 17 patients, and C1, in 82 patients (p = 0.029). The mean CSA of the entire rotator cuff group was 33.4° ± 3.5° and that of the normal cuff group was 32.6° ± 3.9°, showing no significant difference between the two groups (p = 0.085). However, on the CSA in patients with Suter-Henninger classification type A1, the value was 32.7° ± 3.5° in the rotator cuff tear group and 30.5° ± 3.1° in the normal cuff group; there was a significant difference between the two groups (p = 0.024). On comparison with the Suter-Henninger classification type C1 patients, the CSA was 33.7° ± 3.5° in the rotator cuff tear group and 33.1° ± 3.9° in the normal cuff group; there was no significant difference between the two groups (p = 0.216) (Table 2).
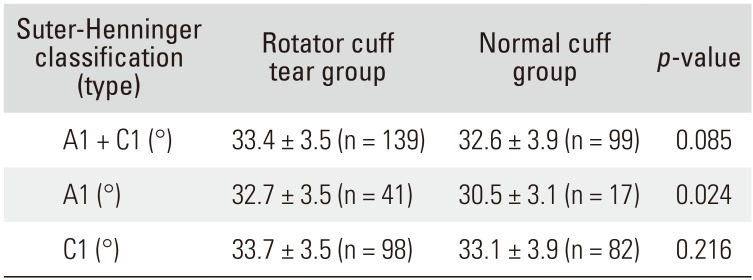
Table 2
Critical Shoulder Angle According to the Presence or Absence of Rotator Cuff Tear
![]()
CSA According to Imaging Modality
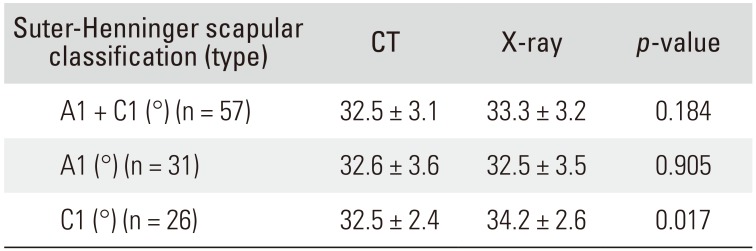
The mean CSA was 32.5° ± 3.1° in CT and 33.3° ± 3.2° in X-ray; there was no statistically significant difference between imaging modalities (p = 0.184). This result suggests that the CSA measured by X-ray is sufficiently accurate for measurement of the CSA if X-ray is performed with the degree of scapular malposition within the acceptable range. In Suter-Henninger classification type A1 patients (n = 31), the mean CSA was 32.6° ± 3.6° in CT and 32.5° ± 3.5° in X-ray, and there were no statistically significant differences (p = 0.905). However, in type C1 patients (n = 26), the mean CSA was 32.5° ± 2.4° in CT and 34.2° ± 2.6° in X-ray, showing a significant difference according to the imaging modality (p = 0.017). The correlation between the CSA measured by CT and X-ray was examined: the correlation coefficient was significantly higher for the A1 type than for the C1 type (0.991, p < 0.001 vs. 0.616, p = 0.001) (Table 3 and Fig. 4). This result suggests that the accuracy of the CSA measurement may be subject to whether the obtained image was the A1 type or C1 type. If there was a change in the proportion of patients with C1 type, the CSA could have shown statistically significant difference according to the imaging modality.
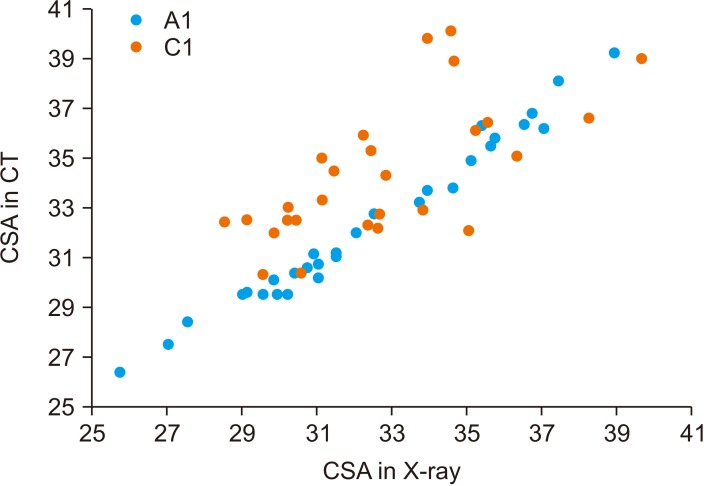 | Fig. 4Relationship between the critical shoulder angle (CSA) measured by computed tomography (CT) and X-ray. Compared to the Suter-Henninger classification type C1 (C1), Suter-Henninger classification type A1 (A1) showed a more linear relationship.
|
Go to :
DISCUSSION
In the present study, the mean CSA of the rotator cuff tear group was 33.4° ± 3.5° and that of the normal cuff group was 32.6° ± 3.9° (p = 0.085). On the basis of this result alone, we may assume that the CSA is not statistically significantly related to the rotator cuff tear. However, on the comparison of the CSA in patients with Suter-Henninger classification type A1, the value was 32.7° ± 3.5° in the rotator cuff tear group and 30.5° ± 3.1° in the normal cuff group (p = 0.024). By contrast, in the comparison of CSA in patients with the Suter-Henninger classification C1, the value was 33.7° ± 3.5° in the rotator cuff tear group and 33.1° ± 3.9° in the normal cuff group (p = 0.216).
The measurement of CSA, which is a method for recognizing a vector acting in three-dimensional (3D) space, can be easily performed using X-ray, which is a 2D image. However, the possibility of measurement error may also be increased by various reasons such as the imaging modality, beam projection angle, and patient or cassette position. In particular, scapular malrotation can greatly affect the CSA. Moor et al.1) reported that the variability of CSA was less than 2° for a scapular malrotation of less than 20° of internal or external rotation, whereas an accurate measurement was difficult to obtain for a malrotation above 20°, because demarcation of the superior and inferior bony margins of the glenoid was not reproducible. Suter et al.2) also reported more than 2° of difference in CAS when the true AP view was compared with a view over 5° anteversion, 8° retroversion, 15° flexion, or 26° extension. In the case of malrotation less than 20° or Suter-Henninger classification type A1 and C1, it is reported that the degree of scapular malrotation is acceptable because the measurement error of the CSA is less than 2°. However, in the current study, even in the minimal malrotation (Suter-Henninger classification C1), the CSA was not statistically significantly different between patients with rotator cuff tears and those without. In addition, the comparison of CSA in total patients (Suter-Henninger classification C1 and A1 types) revealed no significant difference depending on the presence of rotator cuff tear although the comparison of patients with A1 type only showed difference between groups. These findings suggest that even minimal malrotation of the scapula might act as a bias.
To identify the extent of variability in CSA on X-ray taken under the condition of malrotation of the scapula, we conducted comparison with CT, which is less affected by the beam projection angle and the patient or cassette position. In patients with Suter-Henninger classification type A1, the CSA on CT was measured as 32.6° ± 3.6° and the value on X-ray was 32.5° ± 3.5°, showing no significant difference between the two imaging modalities (p = 0.905). However, in patients with Suter-Henninger classification type C1, the mean CSA on CT was 32.5° ± 2.4° and the value on X-ray was 34.2° ± 2.6°; this difference was statistically significant (p = 0.017), and the mean difference between CT and X-ray was 1.7° ± 2.2°. These findings are similar to those in the study of Suter et al.2) In their linear mixed-effect model, they showed that scapular malrotation affects the CSA and suggested a safe zone where the position of the scapula in the field of view should result in a difference of < 2° in CSA from the true AP view. After excluding any glenoid double contour of > 50% of glenoid height and inverted teardrop patterns at the upper glenoid rim, there was an 89% probability of assessing the CSA within 2° compared with the true AP view. In our study, the difference of the CSA in type C1 images was less than 2° between X-ray and CT. However, as we described above, even in minimal malrotation that is classified as type C1, there was no significance difference detected between patients with rotator cuff tear and those without.
The CSA is a new radiographic parameter that may indicate the presence of degenerative shoulder pathologies. Moor et al.1) introduced the concept, and Gerber et al.5) in their biomechanical study suggested that a larger CSA increases the ratio of shoulder joint shear-to-compression force, thus demanding an increased compensatory supraspinatus load. Because of this, they explained, there is an association between the CSA and rotator cuff tear. In a study of the association between the CSA and rotator cuff tear in East Asian populations, Shinagawa et al.6) also reported the CSA might be an independent risk factor for rotator cuff tear. In the study, the CSA in the complete rotator cuff tear group was 33.9° ± 4.1° and 32.3° ± 4.5° in the non-rotator cuff tear group. Chalmers et al.7) reported that the CSA of patients with rotator cuff tears was 33.6° ± 3.9°, and the CSA of those with non-rotator cuff tears was 33.8° ± 3.6°. The CSA was not correlated with tear size or tear progression. Bjarnison et al.8) also reported that the mean CSA of patients with rotator cuff tear was 33.9° and that of patients without rotator cuff tear was 33.6°. They did not find any association between CSA and rotator cuff tear. With the same concept of the CSA (with similar mean value), some papers reported that CSA and rotator cuff tear are related, and other reported no relevance. The results of these studies showed that the mean difference was also less than 2°. We can infer from these findings that even minimal malrotation of the scapula might affect clinical interpretation.
This study has some limitations. Thus, the findings should be interpreted with caution. First, it is a retrospective study involving a relatively small number of patients. The number of patients was greater than that obtained from the power analysis, but it would be more desirable to draw conclusions from a larger sample size. In addition, although all X-rays of the patients were analyzed, the proportion of good quality X-rays that correspond to the Suter-Henninger classification A1 was low. Further, the data of many patients could not be used: we excluded Suter-Henninger classification type B and D. This was because the CSA is much more sensitive to anteversion and retroversion of the scapula. Suter et al.,2) in their study, suggested that A1 and C1 showed less than 2° of deviation of the CSA of the true AP view but type B and D showed more than 2° of deviation. They concluded that type B and type D do not have the safe margin of scapular rotation. In addition, the purpose of our study is to evaluate whether including type C1 may affect the interpretation of relation between the CSA and rotator cuff tear. More effort should be made to obtain the true AP view by using a more precise protocol, and further analysis will be needed if more patients are collected in the future. Second, we did not compare the CSA values between A1 type and C1 type views obtained from the same patient. This may be attributable to the retrospective study design; most patients did not have both X-ray images of the Suter-Henninger classification A1 and C1. Multiplanar CT was a useful tool to reconstruct the axis as the operator wanted. CSA measurement was carried out on the projected image from a 3D object. CT measurement of the CSA is not commonly carried out, but a few reports9) suggested that it is a very reproducible and accurate method. We also tried to measure the CSA by CT according to the CSA definition. Third, the normal cuff group, which was a control group, comprised patients with any orthopedic conditions but rotator cuff tear. Although we established some exclusion criteria, it is possible that some pathologies that we did not examine could have affected the CSA. Finally, even though the CSA measured on A1 type views showed statistically significant difference between the rotator cuff tear group and the normal cuff group, there could have been a measurement error.
The significance of this study can be found in the fact that we raised the question on the acceptable range of scapular malposition that has been used so far and the CSA was measured and analyzed using the X-ray views that accurately correspond to Suter-Henninger classification type A1 and CT.
To use the CSA as a predictive factor the presence or absence of a rotator cuff tear, evaluation of the CSA should be performed accurately; for this, X-ray views corresponding to Suter-Henninger classification A1 or a CT reconstructed images can be helpful in reducing the measurement error and obtaining reliable results. Only the X-ray views corresponding to the Suter-Henninger classification A1 showed significant difference in the CSA between the rotator cuff tear group and the normal cuff group; thus, Suter-Henninger classification A1 type X-ray views could be used as a predictor of rotator cuff tear.
Go to :
 XML Download