

 PDF
PDF Citation
 Print
Print


INTRODUCTION
Small area variation in medical practice, whether in the field of prevention, diagnosis, or treatment, prevails.1 After Wennberg2 who described the variation in tonsillectomy, studies on medical practice variation have been conducted in various fields of medicine. According to a study compared medical use in OECD countries, about fourfold variation within the country and twofold variation between-country were observed in hospitalization rates, as well as similar extent of variation in coronary bypass surgery, angioplasty, knee replacement, and cesarean section.3 Small area variation study primarily aims to expose unwarranted variations which “cannot be explained by type or severity of illness or by patient preferences.”4 Unwarranted variation can occur due to under-utilization of effective care which has proven effectiveness without significant tradeoffs. Regular hemoglobin A1c (HbA1c) test and eye examination in the diabetes are the examples of this type of medical care.5
The growing attention is being paid to non-communicable diseases as they become a major cause of morbidity and mortality.6 Especially, the number of patients with type 2 diabetes is rapidly increasing in Asian countries.78 The prevalence of type 2 diabetes in adults aged 30 years and over increased significantly in Korea from 7.2% in 1991 to 14.4% in 2016.910 With the epidemic of type 2 diabetes, diabetes is a leading cause of premature death and non-fatal outcomes among non-communicable diseases in Korea.11
Although effective care for type 2 diabetes is well known.12 these are not being performed sufficiently in practice in Korea. The proportions of type 2 diabetes patients who underwent fundus examination and microalbuminuria test were 30 to 34%, 40% respectively.1314 The proportions of type 2 diabetes patients who had well-controlled HbA1c, blood pressure, and low-density lipoprotein (LDL) were 25%, 68%, 44% respectively, and only about 8% of the patients had the optimal levels of all three measures.10
Most of the studies examined the quality of diabetes care in Korea focused on identifying patient characteristics related to the quality of diabetes care141516171819 and less attention was paid to the geographical variation in diabetes.20 Although the patient characteristics matter, the fact that there was still a wide variation in the quality of care between medical institutions or regions after adjusting patient characteristics indicates that other factors also play an important role in the management of the type 2 diabetes.2122 For example, the availability of an ophthalmologist or HbA1c test may affect its utilization, and medical practice pattern may vary by region.23 It is necessary to reveal the geographic difference in the quality of care to identify how these factors affect the quality. This study aimed to describe geographic variation in quality of diabetes care to provide a basis for exploring non-patient factors affecting the quality of diabetes care.
METHODS
Data
National Health Information Database (NHID) from the Korean National Health Insurance Service (KNHIS) were used. About 97% of the population in Korea is covered by national health insurance and the people without the insurance are covered by medical aid. Therefore, KNHIS covers almost all the population in Korea. Because the reimbursement is made by the fee-for-service scheme with a few exceptions, NHID has the information about diagnosis, medical services and drugs provided to the patient. National Health Screening Database (NHSD) is constructed by KNHIS based on the national health screening results. Adults aged 40 and over are eligible for national health screening which includes physical examination, chest X-ray, urine test, blood pressure, and lipid profile at least every 2 years. In 2014, 74.8% of the eligible population underwent national health screening.24
Study population
Individuals with type 2 diabetes aged 30 years and over in 2014 were included in this study. The type 2 diabetes was identified as using International Classification of Diseases-10th code ‘E11’ either in the primary diagnosis or in the secondary diagnosis from inpatients and outpatients claims data of NHID. Thus, prevalent cases of type 2 diabetes in 2014 were included in this study. The total study population was 3,719,081. Among those, 1,274,182 (34.5%) underwent national health screening the same year.
Quality of care indicators in type 2 diabetes
To assess the quality of care for type 2 diabetes, this study used seven quality indicators, which could be evaluated using cross-sectional design, from three categories by referring to Johnson et al.25 (Table 1) and reimbursement standards and case book from Korean Health Insurance Review and Assessment Service (KHIRA).26 Medication possession ratio was used to evaluate the continuity of care. HbA1c test, lipid profile, microalbuminuria test, and eye examination were used to assess the process of care. Blood pressure (BP) control and LDL control were used as intermediate (proximal) outcome indicators. The definition of each quality indicator was as follows and presented in Table 2.
Table 1
Summary of the quality indicators to measure performance of diabetes care
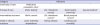
Table 2
The definitions of indicators used to measure the quality of diabetes care in this study
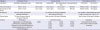
HbA1c = hemoglobin A1c, BP = blood pressure, LDL = low-density lipoprotein.
aStandard for the incentive for the medical care to chronic disease management (2012, Korean Health Insurance Review and Assessment Service); bTreatment guideline for diabetes (2015, Korean Diabetes Association); cClinical practice guideline for the prevention and management of diabetes in Korea (2015, Korean National Diabetes Program).
Continuity of care
Medication possession ratio was defined as the sum of days prescribed with oral hypoglycemic drugs divided by person-days of the type 2 diabetes. A total of eight categories of the drugs (biguanides, non-sulfonylureas, sulfonylureas, alpha-glucosidase inhibitors, insulin, thiazolidinediones, dipeptidyl peptidase-4 inhibitors, incretin analogues) were considered as diabetes medication referring to the reimbursement standards and case book from KHIRA.26 The drugs were identified by the brand name code using a reimbursement price file for drugs, October 2016 from KHIRA.
Process of care (HbA1c test, lipid profile, microalbuminuria test, and eye examination)
The proportion of the patients who underwent each test at least once in 2014 were calculated. The procedure codes used to identify the test are presented in Table 2. Unlike the other indicators which are recommended annually, eye examination is recommended biennially so that the desirable rate for eye examination is about 50% in this study.
Intermediate outcome (BP control, LDL control)
Intermediate outcome indicators were calculated only for patients who received national health screening. The proportion of the patients who had lower than the target level of BP or LDL were calculated. The target BP level was 140 mmHg for systolic BP and 80 mmHg for diastolic BP.27 The target LDL level was 100 mg/dL.28
Geographical unit
Unit of analysis was 252 districts (Si, Gun, and Gu) as small areas in Korea. To identify variation in the quality of diabetes care by urbanicity, all districts were classified into urban, suburban, and rural (Gu districts as urban, Si districts as suburban, Gun districts as rural). To investigate the effect of Community Based Registration and Management Program for Hypertension and Diabetes (CBRMP) on the quality of diabetes care, the districts with and without CBRMP were compared.
Statistical analysis
All quality indicators were calculated for each of the 252 districts. A crude proportion was age-standardized using the middle of the year population. For each quality indicator, mean, standards deviation, percentile cut-off points (0, 25, 50, 75, 100) were presented. A Coefficient of Variation (CV), standards deviation divided by mean which is a relative measure for variation, was used to compare the extent variation of quality indicators.
RESULTS
The prevalence of type 2 diabetes in 2014 was 10.5%. Supplementary Table 1 shows the prevalence of type 2 diabetes by age. Table 3 shows crude and age-standardized proportions of quality indicators in diabetes care in 2014. Medication possession ratio showed the highest level among seven indicators, with 68.3%. For the process of care indicators, better performance was seen in HbA1c test and lipid profile (65.3%, 59.3%, respectively), while the utilization of microalbuminuria test and eye examination were significantly low (15.4%, 2.9%, respectively). The proportions that had well-controlled BP and LDL were 67.6%, 48.4%, respectively.
Table 3
Crude and age-standardized proportions for quality indicators in type 2 diabetes care in 2014
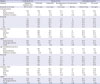
The extent of geographic variation was different by indicators and the extent did not change much after age-standardization. CV, representing relative variation, was high in eye examination (0.44) and microalbuminuria test (0.24) and was low in medication possession ratio (0.03). In case of eye examination, the district with the lowest performance showed 0.9% while 9.2% of the patients underwent the test in the best district. For microalbuminuria test, fourfold variation was seen between districts. However, even on indicators with less relative variation, a considerable extent of absolute variation existed. There was considerable performance gap between the best and the worst districts in HbA1c test (32.4 percentage point) and BP control (42.7 percentage point).
Overall, patients living in the urban area had better-quality care compared to patients living in the suburban or rural area, despite that the difference was not evident for eye examination, BP control, and LDL control. The difference in the quality of care by CBRMP was not significant, in all indicators, after age-standardization. Supplementary Tables 2 and 3 show crude and age-standardized proportions for quality indicators in type 2 diabetes by districts in 2014.29
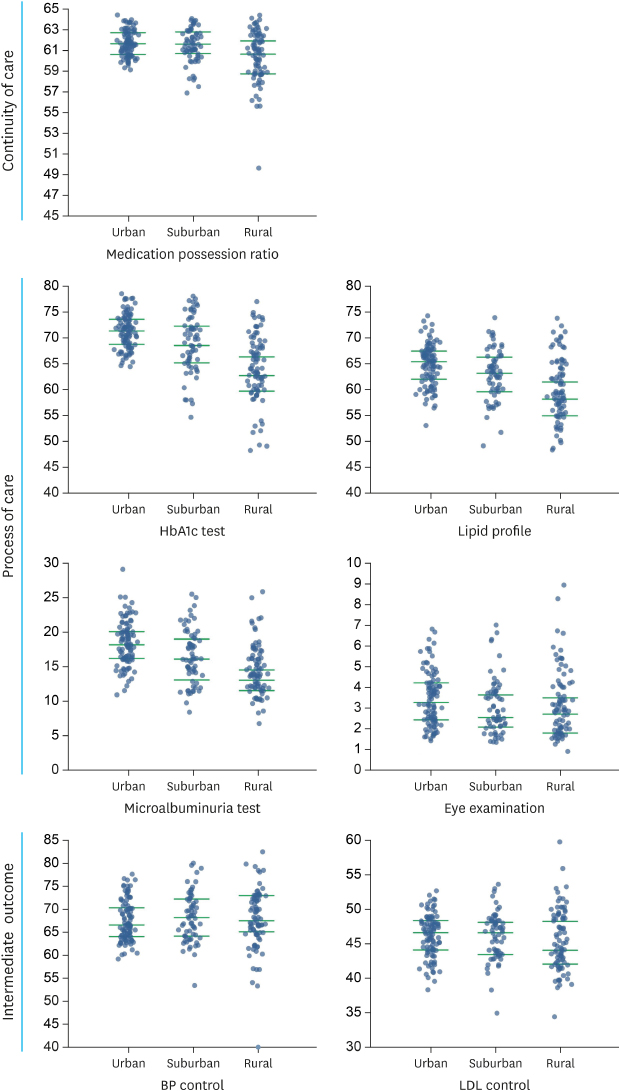
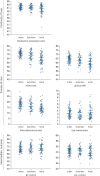
Fig. 1 shows the variation of quality indicators by urbanicity. Median proportions of quality indicators in urban area were higher than those of suburban and rural area in medication possession ratio, HbA1c test, lipid profile, and microalbuminuria test. Although larger extent of geographical variation existed among suburban and rural districts compared to urban districts in all indicators, due to the huge extent of variation, many suburban or rural districts showed the similar quality of care as urban districts.
DISCUSSION
This study investigated the geographical variation of quality of care in type 2 diabetes in 2014. All quality indicators failed to achieve the recommended level. Especially for eye examination and microalbuminuria test, only about 3% and 15% of the patients underwent the test in a year, respectively. The variation in the quality of diabetes care among districts existed and the extent of variation was different by the indicator. There was a tendency that the relative variation was higher as the performance of the indicator was lower. However, there was still a huge difference between best and worst districts even in the indicators with less relative variation. Overall quality of care was higher in the urban areas compared to that in the suburban or rural areas, but the performance of each indicator in many suburban or rural districts was similar to those in urban districts. The difference in quality of diabetes care by CBRMP was not significant.
Effective care that can prevent or early-diagnose diabetes complications was not being used sufficiently in Korea. Si et al.30 compared quality of diabetes care across five Organization for Economic Co-operation and Development (OECD) countries. The quality of diabetes care in Korea was lower than that in 5 OECD countries in all process of care indicators (HbA1c test, 65% vs. 60%–80%; lipid profile, 59% vs. 50%–85%; kidney function test, 15% vs. 30%–80%; eye examination, 3% vs. 30%–70%; LDL control, 48% vs. 18%–45%).
While Korean Community Health Survey (KCHS) reported about a third of the diabetes underwent eye examination and microalbuminuria test in 2014, the performance calculated in this study was significantly low (2.9%, 15.4%, respectively). Another study reported that the annual utilization of fundus examination was 30% in 2013 in Korea.15 This discrepancy may come from various sources. Because KCHS is a face-to-face survey, there may have been a problem of overreporting. Also, the difference in the study population must be considered. Unlike other studies that defined the diabetes as self-reporting or diabetes medication, this study used a broader definition as the diagnosis code in the claims data. This definition not only increased the number of the diabetes, but also affected the characteristics of the study population, which, in turn, possibly led to a difference in the results of the studies. However, given that the awareness and the treatment rate of type 2 diabetes were 62.6%, and 56.7%,10 respectively, it is likely that the performance of diabetes care could be over-estimated because of the small denominator when using self-reporting or diabetes medication for defining the diabetes. Some of the difference may come from the unit of analysis of the study. This study used the districts as a unit of analysis unlike other studies.
Some possible explanations are available for the low-utilization of effective care in Korea. First, the patients do not have a family doctor and they can freely choose a medical institution. About 30% to 45% of the diabetes patients in Korea does not have the usual source of care.3132 Therefore, the physician is not aware of whether the patient has received the medication regularly or the necessary test. In addition, most clinics are solo practice, which may lead to a shortage of resources for the necessary test in diabetes. In a situation where clinics are competing with each other, it is difficult to refer the patient to another medical institution for appropriate care when there is no incentive for a referral.
The study also confirmed that there was geographical variation in the quality of diabetes care and the extent of the variation varied by the indicator. The quality variation was large in Korea despite the existence of national health insurance which significantly reduces the cost barrier to effective care. A study that investigated variation in the quality of diabetes care among the U.S. Medicare patients reported 15 to 20 percentage points difference on HbA1c test, lipid profile, and eye examination.21 In this study, the gap between best and worst districts was about 30 percentage point in HbA1c test and lipid profile, there was tenfold difference by the district in eye examination. Several factors other than the cost could have contributed to the variation. It might be due to a lack of medical resources such as the availability of specialists or laboratory test. An article examining the screening test in type 2 diabetes, rural areas with a health clinic showed higher screening test rate than those without a health clinic.33 Other studies showed that distance to the medical institution had a negative effect on the quality of care in type 2 diabetes.34 Lack of transportation in rural areas might amplify this effect.
Although the overall quality of diabetes care was higher in urban areas than that in suburban or rural areas, the difference by urbanicity was not as evident as the urban-rural difference in other countries,3536 and several suburban or rural districts showed similar performance to urban districts. In addition, the effect of CBRMP on quality of diabetes care was not found in this study. These results indicate that each district has different causes for the low quality of care and therefore needs a solution that is appropriate for the local situation. In Korea, district governments are responsible for designing and implementing a regional health plan. Understanding the status of the district is necessary for setting goals and evaluating the performance of policy. This study could be used as a basis for the development of regional health plan.
Low-utilization and large variation of effective care indicate that the type 2 diabetes is being managed by single or perhaps multiple fragmented providers without the system that can take care of the patients from prevention to rehabilitation. The systematic approach is needed to improve the quality of care in diabetes. A systematic review showed that greater improvement in the quality of care can be achieved when the strategy targeting system such as case management and team approaches combined with the strategy targeting patients.37 As of 2018, several districts run a pilot program targeting system. The research to assess the effectiveness of these programs will provide a basis for establishing a coordinated care system for diabetes.
This study has some limitations. First, this study used only the diagnostic code to define the diabetes and it was possible that this could lead to overestimation of the number of the diabetes. However, given that the purpose of this study was to describe the geographical quality variation, simple definition of diabetes was favorable because the result could be biased by, for example, regional accessibility to medical care if the definition included prescription or procedural codes. Diabetes Fact Sheet also defined diabetes as ‘visit medical clinic as a diagnosis of diabetes at least once’.10 Second, we calculated intermediate outcome measures only with the patients underwent the national health screening. About 34% of the total study population had the national health screening. It was possible that intermediate outcome indicators were overestimated because population participated in health screening tended to be healthier. Also, we were not able to calculate HbA1c level, which perhaps was the most important intermediate outcome in type 2 diabetes, because HbA1c test was not included in the national health screening. Third, this study calculated annual eye examination, although it is recommended biennially. This may be one reason for the low utilization of eye examination in this study. However, considering that annual eye examination from Korean community health survey was not significantly fluctuated year-to-year, the error due to this problem may not be significant.
Despite such limitations, this study has an implication. It is the first paper that described the geographical variation in the quality of care in type 2 diabetes. The results of this study could be used as a basis for policies to improve the quality of diabetes care as well as for future medical practice variation study. Analysis on geographical variation in the diabetes' outcome and geographical characteristics associated with the quality of care will need to be further studied. This study confirmed that a considerable proportion of type 2 diabetes patients was not adequately managed and there was a wide variation in the quality of care by the district. To improve the quality of diabetes care, it is necessary to establish a well-coordinated care system tailored to the need of the district.
 XML Download