

 PDF
PDF Citation
 Print
Print


INTRODUCTION
Cigarette smoking is one of the most common public health concerns in Korea and worldwide, and the use of tobacco is a major cause of preventable death.1 Smoking accounts for 3.9% of total disability-adjusted life years (DALYs) in low and middle-income countries and 12.7% in high-income countries. If this trend persists, the use of tobacco will cause more than eight million deaths per year by 2030.1 Smoking-related costs are substantial components of health care costs. In a study from the United States, smoking-attributable costs were found to be 6.54% of the total medical care costs, including costs associated with ambulatory and inpatient care as well as prescription drugs.2
Cardiovascular disease, chronic obstructive pulmonary disease, and lung cancer are common causes of smoking-related death.3 Lung cancer is the most closely associated with smoking.34 Lung cancer causes 0.85 million smoking-related deaths annually. Smoking causes 1.5 million cancer deaths, accounting for 21% of all cancer deaths (7 million) globally.4 In Korea, premature death from cancer due to smoking accounts for 61.9% and 15.8% of total cancer-related premature deaths in men and women, respectively.5 Other studies conducted in Korea found that the burden of major smoking-related cancers (measured in DALYs) was 1,930 person-years per 100,000 men in 2001.6 Furthermore, in another study from Korea, which determined the expenditure of the National Health Insurance Corporation (NHIC) for smoking-related care, cancer-related costs attributable to smoking was USD 190.9 million, 46.1% of the total smoking-related medical expenditure of the NHIC in 2003.7
Smoking in the workplace may increase the risk of malignant tumors and various types of respiratory diseases through the synergetic effects associated with work-related harmful substances such as asbestos,8 radon,9 and various chemicals.10 Therefore, workers who smoke and are exposed to hazardous substances are at a high risk of cancer.111213 Aside from smoking tobacco as a major cause of lung cancer, smokers are more likely to be absent from work, take more sick leave per year, and incur health care costs up to 50% higher than those for non-smokers.141516 Therefore, establishing a smoke-free working environment is crucial for workers' health.17 Because workers spend much time in the workplace, anti-smoking programs at the workplace are effective in reducing the smoking rate of the general population.18
To prioritize the prevention of smoking-related diseases in workplaces, information on the smoking across occupations and industries must first be collected. In the present study, we aimed to estimate the prevalence, intensity, and number of workers exposed to smoking according to occupation and industry, using a nationwide working condition survey.
METHODS
Study subjects
To estimate smoking prevalence, smoking intensity, and number of smokers according to the standard occupational classification and standard industrial classification (SIC), we used the Korean Working Condition Survey (KWCS)19 and Korea's census data.
KWCS is conducted every five years by the Occupational Safety and Health Research Institute of the Korea Occupational Safety and Health Agency.20 The study subjects were selected using a complex sampling framework to represent the Korean working population.19 The target population of the KWCS was the economically active population aged 15 years or more, who were either employees or self-employed at the time of the interview. Those who were retired and unemployed as well as housewives and students were excluded from the survey. Comprehensive data pertaining to job status, working time, socioeconomic position, exposure to physical and psychological hazards, and health behaviors were collected through face-to-face interviews during house visits. We used the second and third KWCS conducted in 2010 and 2011, respectively. While conducting the KWCS, 10,019 and 50,032 people were interviewed in 2010 and 2011, respectively. Of these, we used 59,970 workers, excluding 81 due to incomplete data.
Classification of occupation and industry
Occupations and industries were classified using the Korean Standard Classification of Occupations (KSCO-06, 2007) and Korean SIC (KSIC rev. 9, 2008), respectively. KSCO is based on the International Standard Classification of Occupations 2008 and KSIC on the fourth revision of the International SIC (ver. 06). In the present study, we analyzed the KWCS data according to the major (1-digit), sub-major (2-digit), and minor groups (3-digits) of occupational and industrial classifications.
Definition of smoking
The KWCS collected detailed information on smoking habits, including smoking status (current, former, or non-smoker) and number of cigarettes smoked per day. Persons who were active smokers at the time of the interview and had smoked 100 or more cigarettes in their lifetime were classified as current smokers. Former smokers were those who did not smoke at the time of the interview and answered “yes” to the question “Have you smoked at least 100 cigarettes in your lifetime?” Never-smokers were persons who had smoked less than 100 cigarettes in their lifetime. We treated only current smokers as smokers while former- and never-smokers were classified as non-smokers.
Another question for current smokers was “On average, how many cigarettes do you smoke per day?” Respondents filled in a two-digit number of cigarettes smoked in the questionnaire. We used this value to estimate smoking intensity. No other tests were performed to determine whether the respondents actually smoked the number of cigarettes indicated.
Statistical analysis
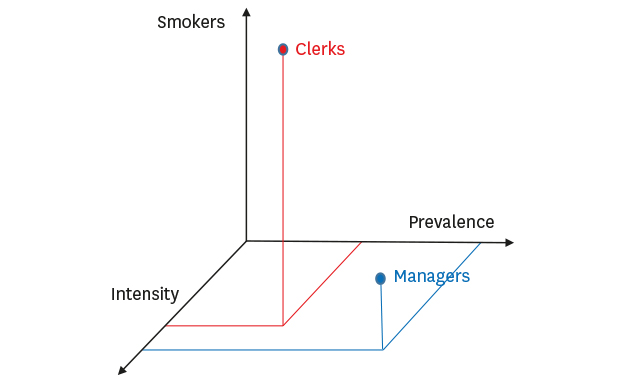
Statistical analyses were performed separately for men and women workers. To make the findings nationally representative, a sampling weight from the KWCS was applied to the subsequent analyses. The framework for estimating smoking prevalence, intensity, and number of smokers by occupation or industry is shown in Fig. 1.
 | Fig. 1Framework for estimating smoking prevalence, smoking intensity and the numbers of estimated smokers in an occupation or industry.
|
The number of smokers in an occupation or industry was divided by the total number of workers in that occupation or industry using the KWCS data, which resulted in the smoking prevalence.
Smoking prevalence = The number of current smokers in an Occupationor IndustryThe number of total workers in an Occupationor Industry × 100(%)
For smoking intensity, we used the daily number of cigarettes smoked by smokers in an occupation or industry derived from the KWCS data.
The census data were used together with the KWCS data to estimate the total number of smokers in a certain occupation or industry. The number of smokers was estimated by multiplying the smoking prevalence with the number of workers in the occupation or industry obtained from the census data. Analyses were performed using the “survey” package of statistical software R (version 3.3.2; The R Foundation, Vienna, Austria).
RESULTS
We found that the number of estimated smokers was 6,788,502 men workers and 502,331 women workers. The total labor force in 2010 was 22,290,398 workers, of which 32.47% (men, 52.66%; women, 5.24%) were estimated to be current smokers (Table 1). The average smoking prevalence for the men workers was about 10-fold higher than that for women workers.
Table 1
Smoking prevalence, intensity of smoking, and the number of smokers by age group, major occupation (1-digit) group and major industry group (1-digit)
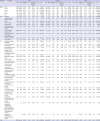
NS = the number of smokers, NW = the number of workers, SE = standard error, SD = standard deviation, NE = the number of estimated smokers; SOC = standard occupational classification, SIC = standard industrial classification; NA = not available.
![]()
It was estimated that 7,271,922 (32.47%) of the workers were smokers. The prevalence of men and women smokers was 52.66% (6,788,502) and 5.24% (502,331), respectively. On average, men smokers smoked 15.42 cigarettes/day and women smokers 11.29 cigarettes/day.
Table 1 shows smoking prevalence, amount of smoking, and number of smokers by age, major occupation (1-digit), and major industry groups (1-digit). Regarding men workers, those in the 30–39 years age category had the highest smoking prevalence (57.12%), while those aged 50–59 years smoked the highest number of cigarettes (16.34 cigarettes/day). For women workers, those in the 15–29 years age category had the highest smoking prevalence (6.24%), while those aged 60–69 years smoked the highest number of cigarettes (13.13 cigarettes/day).
For occupations, regarding men workers, “craft and related trades workers” had the highest smoking prevalence (61.72%). “Managers” smoked the highest number of cigarettes (16.70 cigarettes/day) and “equipment, machine operating, and assembling workers” comprised the highest number of estimated smokers (1,285,820 workers). For women workers, “equipment, machine operating, and assembling workers” had the highest smoking prevalence (8.41%). “Skilled agricultural, forestry, and fishery workers” smoked the highest number of cigarettes (12.80 cigarettes/day) and “clerks” comprised the highest number of estimated smokers (101,640 workers).
Regarding industries, for men workers, “mining and quarrying” had the highest smoking prevalence (77.27%). “Construction” and “manufacturing” smoked the highest number of cigarettes (17.25 cigarettes/day) and comprised the highest number of estimated smokers (1,532,492 workers), respectively. For women workers, “information and communications” had the highest smoking prevalence (12.43%). Those in “accommodation and food service activities” smoked the highest number of cigarettes (12.59 cigarettes/day) and constituted the highest number of estimated smokers (85,088 workers) (Table 1).
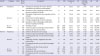
Table 2 indicates the top three minor groups (3-digit) of occupations by gender in terms of the prevalence, intensity of cigarette smoking, and number of smokers. For men workers, “welders” had the highest smoking prevalence (74.65%), while “product planning, public relations, and survey professionals” and “administration-related clerks” smoked the highest number of cigarettes (21.55 cigarettes/day) and comprised the highest number of estimated smokers (681,738 workers) respectively. For women workers, “automobile drivers” had the highest smoking prevalence (32.34%), while “administration clerks” and “crop growers” smoked the highest number of cigarettes (14.61 cigarettes/day) and constituted the highest number of smokers (50,149 workers), respectively. All results for the sub-major (2-digits) groups of occupation are presented in Supplementary Table 1 and the minor (3-digits) groups of occupation in Supplementary Table 2.
Table 2
The top 3 minor groups of occupations (NS ≥ 10) by smoking prevalence, intensity of smoking, and the number of smokers, respectively

NS = the number of smokers, NW = the number of workers, SE = standard error, SD = standard deviation, NE = the number of estimated smokers.
![]()
Table 3 indicates the top three minor groups (3-digit) of industry by gender in terms of the prevalence, number of cigarettes smoked, and number of smokers. For men workers, “manufacture of bodies for motor vehicles; manufacture of trailers and semitrailers” had the highest smoking prevalence (88.23%), while “knitted and crocheted apparel” workers and those engaged in “growing of crops” smoked the highest number of cigarettes (20.13 cigarettes/day) and constituted the highest number of estimated smokers (309,842 workers), respectively. For women workers, “software development and supply” had the highest smoking prevalence (24.70%), while those in “publishing of books, magazines, and other publications” and “growing of crops” smoked the highest number of cigarettes (14.35 cigarettes/day) and constituted the highest number of smokers (54,967 workers), respectively. All results for the sub-major (2-digits) groups of industry are presented in Supplementary Table 3 and the minor (3-digits) groups of industry in Supplementary Table 4.
Table 3
The top 3 minor groups of industries (NS ≥ 10) by smoking prevalence, intensity of smoking, and the number of smokers, respectively
NS = the number of smokers, NW = the number of workers, SE = standard error, SD = standard deviation, NE = the number of estimated smokers.
![]()
DISCUSSION
For men workers, “craft and related trades workers,” “equipment, machine operating, and assembling workers,” and “sales workers” had the highest smoking prevalence in that order. Another major occupational group with a high smoking prevalence was manual workers. In addition, in terms of the minor occupational groups (3-digits), workers in the construction occupations (welders/construction and mining machines operators) and elementary workers demonstrated high smoking prevalence. A manual worker was defined as someone involved in an occupation that requires the handling of heavy or average loads on a regular basis, or occupations that involve handling lighter loads, but in static postures. In particular, an occupation variable that included agriculture, forestry, and fishery workers; craft and related trades workers; plant and machine operators and assemblers; cleaners and helpers; and unskilled labor were categorized as manual workers.21 These workers were regarded as a high-risk group for work-related stress and health outcomes.22 Not only are they more likely to use tobacco products than non-manual workers are, but they are also more likely to be exposed to secondhand smoke at work, tend to start smoking at an earlier age, are heavier smokers, and have a harder time quitting and maintaining smoking cessation.2324 Manual workers typically have a high prevalence of tobacco use, but low rates of using tobacco cessation resources available through their health benefits. Interventions to motivate manual workers who smoke to use effective cessation support are, thus, needed.25
Regarding women workers, driver and information-related occupations and industries had a high smoking prevalence. Apart from international competitiveness, the domestic IT industry is also known for its poor work environment.26 The IT industry comprises many subcontracted companies of large companies, many dispatched workers and freelancers, and so on, and many workers must perform night work that is fixed. These workers do not receive legal protection. The information and communications industry is characterized by unstable jobs as a result of the excessive work to keep up with the rapid transformations in the information age.27 This increases the risk of job stress and threatens the health of workers.2628 The official government statistics show that the information and communications industry in Korea is characterized by high stress levels.29 Stress and smoking are closely related.30 Therefore, the high smoking rate in the information and communications industry in our study can be interpreted as a work stress-related factor as well.
For both men and women workers, the number of smokers was higher among workers who worked face-to-face with customers such as those working in “restaurants, bars, and canteens” and “alcoholic and non-alcoholic beverage drinking places.” Service workers, who interact with customers frequently, mostly experience emotional labor. Emotional labor is a professionally harmful factor that spreads quickly as the service industry continues to grow globally. Emotional labor is a result of the labor force expressing emotions different from their actual emotions and maintaining an appearance that makes consumers feel like they are receiving friendly and caring service. The relationship between mental illnesses and emotional labor among those working in major service sectors has been explored.31 In particular, issues regarding emotional labor among workers and management are becoming hot topics, with education and evaluation systems (customer service, monitoring, human resource management) that emphasize emotional labor in enterprises gaining prominence. However, in the absence of institutional arrangements to regulate emotional labor in the service industry, service workers are eliminating individual responses (individual treatment, turnover, retirement, and resignation). Emotional exhaustion, which stems from emotional labor, is a state of exhaustion resulting from the physiological, emotional, and mental exhaustion arising from prolonged exposure to an emotionally burdensome environment. Emotional exhaustion can result in a cynical attitude toward the job and decrease job-related achievements. Adverse effects have been seen among call center workers, such as emotional exhaustion and cynicism, resulting in severe emotional labor and indicating symptoms of depression. One study evaluated emotional labor practices in major service industries, including hotel housekeeper (97.7%), hospital caregiver (96.9%), casino dealers (95.8%), retail customer services (90.7%), hospital nurses (90.7%), bank tellers (89.7%), retail food sales (87.7%), and bank call center counselors (86.8%). This is because most emotional labor is characterized by face-to-face or voice-to-voice interaction with customers.31 Because workers in stressful jobs are more likely to be exposed to smoking,30 human emotions must also be managed apart from the traditional harmful factors (physical, chemical, and biological).
The difference in smoking prevalence among occupations may be due to the difference in the socioeconomic status reflected by the occupation.32 There are various reasons vulnerable socioeconomic groups are more likely to smoke: it is easy to start smoking when you belong to a vulnerable class, lack of knowledge about the harmful effects of tobacco, and lack of motivation to quit smoking.33 Job characteristics, such as stressful circumstances and long working hours, may influence workers' high smoking rates.34 The smoking rate of women call center workers is 35%, which might be related to both the low job qualifications of call center workers and women workers' low socioeconomic status. The main reason for their low level of education is their family's poor financial state.35 Therefore, understanding the effect of socioeconomic status and job characteristics on the difference between occupation-specific smoking rates will help prioritize smoking cessation policies for each occupation.
Previous studies363738 used the 20–50 classification of occupations, which is similar to the KSCO sub-major group (2-digits), to estimate smoking prevalence. Other studies323940 used only broad categorizations of occupations (1-digit). In the current study, we estimated smoking prevalence according to major (1-digit), sub-major (2-digits), and minor (3-digit) groups. Few subjects belonged to the minor groups; however, their inclusion may help identify preventive measures for high-risk occupations. For example, “welders” among the men workers and “automobile drivers” among women workers could be prioritized as targets of campaigns that promote smoking cessation.
Our results took into account important characteristics of exposure to carcinogen-cigarette smoking in workplaces across occupations and industries. This type of carcinogen surveillance system has been developed in other countries. CARcinogen EXposure (CAREX), first developed for 16 European countries, is a good example.41 The CAREX approach was subsequently established in Estonia, Latvia, the Czech Republic, Lithuania, Costa Rica, and Canada.424344 In this study, we estimated smoking prevalence, intensity, and the number of smokers, which will be used as part of the Korean CAREX.4546 In addition, our results can be used in epidemiological studies, particularly in industry-based cohort studies or case-control studies. If a retrospective cohort study aims to examine the relationship between asbestos and lung cancer, but the study has no information on smoking status, our results can be used to indirectly adjust the smoking effect.4748
Our study has some limitations. First, there is a potential underestimation in smoking prevalence among workers. One study compared self-reported smoking prevalence and cotinine-verified smoking prevalence to determine how many smokers remained “hidden” in a self-reported smoking prevalence survey. Cotinine-verified smoking prevalence was 50.0% for men and 13.9% for women, or a 5.3% point and 8.0% point higher than the self-reported prevalence for men and women workers in absolute terms, respectively. Because women living with a spouse or parents tend to under-report their smoking more than those who live alone or with others, the number of self-reported women smokers was less than half the cotinine-verified smokers.49 Therefore, we should be aware that a large number of women smokers with low self-reported smoking rates might remain unrevealed. Control policies aimed at women in Korea are needed. However, despite this potential underestimation, it may be useful to compare smoking prevalence across occupations and industries.
Smoking in the workplace increases the risk of malignant tumors and various types of respiratory diseases through the synergistic effects associated with work-related harmful substances. In addition, it leads to secondary smoking for non-smoking workers. As part of the effort to reduce smoking-induced cancer, we examined smoking among high-risk groups according to occupation and industry. Among men workers, the occupations “craft and related trades workers,” “managers,” and “equipment, machine operating, and assembling workers,” and among women workers, the occupations “equipment, machine operating, and assembling workers,” “skilled agricultural, forestry, and fishery workers,” and “clerks” were major groups requiring the management of workers' smoking habits. Furthermore, among men workers, the “mining and quarrying,” “construction,” and “manufacturing” industries, and for women workers, “information and communications” and “accommodation and food service activities” comprised workers with the highest smoking values in the major group. Our results may assist in setting priorities for prevention-related activities and in assessing the impact of changing regulations. Furthermore, this study will greatly contribute to reducing smoking among workers.
 XML Download