

 PDF
PDF Citation
 Print
Print


INTRODUCTION
Down syndrome (DS) is the most common chromosomal disorder caused by the number or structural abnormality of chromosome 21. Children with DS have increased risks of DS-specific morbidities, including congenital heart defect (CHD), vision disorders, hearing impairment, obstructive sleep apnea, wheezing airway disorders, congenital defects of the gastrointestinal tract, obesity, transient myeloproliferative disorder, thyroid disorders, and atlantoaxial instability.12 Therefore, children with DS need to be observed and treated with great care, and their parents and families have a significant burden of medical expenditures.
The prevalence of live births with DS is well-known to be associated with advanced maternal age.34 The risk of live births with DS is 0.61–0.87 per 1,000 births when the mother is under 30 years of age, 4.58 per 1,000 births when the mother is between 35 and 39 years old, 15.71 per 1,000 births when the mother is between 40 and 44 years old, and 33.50 per 1,000 births when the mother is over 45 years old.5 Accurate estimates of prevalence, however, should reflect both maternal age distribution as well as antenatal screening and subsequent termination.67 Otherwise, without a population-based registry program, the estimates could have potential bias. The actual prevalence of live births with DS varies from country to country; 2.3, 1.3, 1.21, and 0.14–0.63 per 1,000 births have been reported in Europe, the United States, Thailand, and Taiwan, respectively.8910 The medical system as well as the social perception of DS in Korea differ from those in foreign countries. Therefore, it is essential to study the prevalence of births with DS in Korea.
In a previous study, the prevalences of DS diagnosed in a single institution by prenatal screening in women aged 35 years and 40 years were 1:1,116 and 1:141 from 2010 to 2013 in Korea, respectively.11 In the other study that analyzed the prevalence of congenital anomalies, the prevalence of live births with DS in Korea was 0.37 per 1,000 births from 2005 to 2006.12 However, to the best of our knowledge, there is no report on nationwide prevalence of live births with DS.
This study aimed to estimate the nationwide prevalence of live births with DS and its trends and to compare the observed and model-based predicted prevalence rates from nationwide data sources. In addition, we calculated direct medical costs of DS patients. The comparison of medical expenditures and their temporal trends between DS and non-DS patients was also examined. We hope that our findings will inform policy makers, medical practitioners, and public health experts of the current status of DS and provide an insight for developing a state-level registry program for public services for DS patients, especially healthcare and social welfare delivery systems.
METHODS
Data source and patients
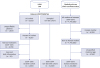
We retrieved the Health Insurance Review and Assessment (HIRA) database and constructed the dataset (HIRA dataset No. M20170828764), which includes patients with and without DS, and their health insurance claims. HIRA stores healthcare claims of almost all Korean residents, approximately 98% covered by National Health Insurance Service (NHIS) and 2% by medical aid (MA), for review and assessment.13 In the present study, for the cohort of children with DS, 9,535 children who were diagnosed with DS (International Classification of Diseases-10 codes: Q90.X) between 2007 and 2016 were selected from HIRA Data Warehouse (DW) (Fig. 1). Among them, 1,204 patients were classified as foreigners, neonates with unspecified identity, and neonates who shared a HIRA identity number with other neonates before they got a social security number, and they were excluded. To estimate the prevalence of live births with DS, 2,153 children who were born between 2007 and 2015 were included. The number of live births (n = 148) and prevalence in 2016 were excluded because of the short observation time. We also excluded 70 children with incorrect birth information and finally included 2083 patients in the cohort with DS births between 2007 and 2015.
Fig. 1
Flow chart of the study.
HIRA = Health Insurance Review and Assessment, DW = Data Warehouse, DS = Down syndrome.
For comparison of medical expenditures in early life, we also constructed a non-DS birth cohort. The patients who were distinguishable and not diagnosed with DS were retrieved from HIRA DW and sampled with 1 to 11 matching by birth year, month, and sex. Finally, 12,265 patients who were born between 2010 and 2014 were included.
Health insurance claims for both patients with and without DS were retrieved, and their records from their birth to the end of 2016 were used for the analyses.
We used birth certificate data from Statistics Korea to estimate the prevalence of live births with DS and to account for the ecological association between advanced maternal age and DS prevalence. Among 4,140,226 birth certificate files for newborns between 2007 and 2015, 6,783 files of foreign mothers were excluded (Fig. 1). Further, 2,769 certificate files with unspecified maternal age were excluded, and the birth information of 4,140,226 newborns was used for the final analyses.
Estimation of prevalence of live births with Down syndrome
We estimated prevalence of live births with DS by two different methods: observed and model-based methods. For nationwide observed prevalence, the numbers of live births with DS were divided by the numbers of newborns in each year. Nationwide prevalence of each year was re-calculated by sex and region to investigate the association between advanced maternal age and DS prevalence. HIRA data do not contain resident information of patients, whereas birth certificate data provides resident information in province (Si or Do) levels. Therefore, regions for DS patients were defined as the region where a clinic or secondary hospital, which the patient had visited most frequently during infancy on an out-patient basis, was located. Sejong, a special administrative district, was included as a part of Chungnam. For patients who had visited hospitals only for hospitalization during infancy, we considered earlier outpatient visits by the year or included hospitals for hospitalization to define the resident regions of patients.
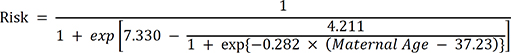
For model-based prevalence, we used two distinct maternal-age-specific estimation models.34 The first model is the risk model (1) by Cuckle et al.3
The second is the other risk estimation model (2) by Morris et al.4
We also used the average age-specific risk, which was suggested by Wu and Morris.7 Using birth certificate data (maternal), the age-specific risk of individuals was summed up and divided by the total number of newborns each year.
Medical expenditure calculation
We calculated direct medical expenditure of patients with and without DS. In Korea, medical service is based on fee-for-service with few exceptions and demands 10% to 50% of out-of-pocket (OOP) expenditure. The average and 95% confidence interval of total and OOP medical expenditures were calculated based on the year and age. In addition, to calibrate for inflation over 10 years, consumer price index for public health and medicine was used for weighting. The index of 2015 was set to 100.00 and the following weights were divided by 100 and used for other years: 111.35 (2007), 109.25 (2008), 106.92 (2009), 105.08 (2010), 103.27 (2011), 102.33 (2012), 101.96 (2013), 101.25 (2014), 100.00 (2015), 99.02 (2016), and 98.15 (2017).
Statistical analyses
The numbers of live births with DS were calculated based on sex and health coverage for each year. Patients who had ever received MA during the study period (2007–2016) were considered to be under MA coverage, an index for low socioeconomic status. The observed prevalence was estimated by year and region, and model-based prevalence was calculated by using the equations (1) and (2). To estimate the ecological association between advanced maternal age and prevalence, a generalized linear mixed effects model (GLMM) was applied. Annual numbers of live births with DS were available for each region. They were considered as response variables and assumed to follow the negative binomial distribution. Annual numbers of live births with DS for each region tend to be similar, and this similarity was adjusted by adding a random effect for region. Sex and year were defined by the nominal variables, and they were included as fixed effects. For year- and region-specific maternal-age risk, we considered three different coding: average maternal age, proportions of mothers aged 35 years or older, and weighted average of maternal age for each year and region. The weighted average of maternal age was calculated by dividing the sum of the number of mothers aged 35 years or older by the number of mothers who gave birth in the corresponding year. The proportion of mothers aged 35 years or older among mothers who gave birth was not available but may be proportional to the proposed weighted average of maternal age. Variables for three different coding were separately included as a fixed effect for GLMM, and the best coding was chosen with Akaike information criterion. PROC GLIMMIX with maximum likelihood estimation based on Laplace approximation was applied. All analyses were performed using SAS V.9.4 (SAS Institute, Cary, NC, USA).
Ethics statement
In this work, all identifiable variables, including claim-, individual-, and organizational-level identification numbers, were re-generated in random by HIRA to protect privacy. The study protocol was approved by the Institutional Review Board (IRB) of Seoul National University (IRB No. E1707/003-003), Hallym University Kangnam Sacred Heart Hospital (IRB No. HKS201705019-HE018), and Soonchunhyang University Seoul Hospital (IRB No. SCHUH201707006-HE001).
RESULTS
From 2007 to 2015, over 200 live births with DS were reported every year (Table 1) regardless of changes in the total number of births. Over the study period, 1.21-fold more male DS patients were born than female patients, and 13% of patients were covered by MA. The 9-year prevalence rate of live birth with DS was 5.03 per 10,000 live births.
Table 1
Annual changes of the numbers of live births with DS based on sex and health coverage

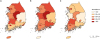
Fig. 2 shows the geographical distributions (province level, Si or Do) for the prevalence in selected years: 2007 (Fig. 2A), 2011 (Fig. 2B), and 2015 (Fig. 2C). Regional variations were observed, although specific patterns were not identified over the study period. Among provinces, Gwangju (metropolitan city) and Chungbuk were highly ranked.
Fig. 2
Geographical distribution of prevalence (per 10,000 persons) of live births with Down syndrome in selected years. (A) 2007, (B) 2011, and (C) 2015.
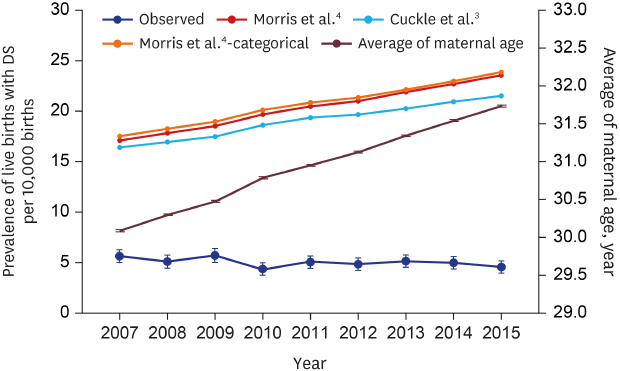
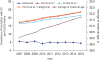
Annual changes in the average maternal age and the observed/model-based prevalence are shown in Fig. 3. Although the average maternal age increased over 9 years, the observed prevalence was relatively constant at around 5 per 10,000 live births. As the maternal age increased, the model-based prevalence also steadily increased. Therefore, the differences between the observed and the model-based prevalence kept increasing. The differences between observed and model-based prevalence (all maternal risk models) was more than 10 per 10,000 births in 2007 and 15 per 10,000 births in 2015 (Supplementary Table 1).
Fig. 3
Annual changes in mean maternal age and the observed/model-based prevalence of live births with DS.
DS = Down syndrome.
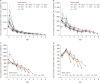
Figs. 4 and 5 show temporal trends of total medical expenditure and OOP expenditure in each cohort by year and age, respectively. The top panels (Fig. 4A and B) show total and OOP expenditures of DS patients, whereas bottom panels (Fig. 4C and D) show those of non-DS patients. For both DS and non-DS patients, total medical expenditures decreased over time in every cohort, although DS patients spent 10-fold more than non-DS patients. The peak OOP expenditure was observed in the second year in each cohort for both DS and non-DS patients (Fig. 4). However, the peak OOP expenditure for DS patients was 2-fold more than that for non-DS patients. Temporal trends of medical expenditures by age show that there were no expenditure differences between cohorts, except for during infancy (Fig. 5). The total expenditure during infancy kept increasing over time. The remarkable point is that OOP expenditure for non-DS patients peaked at the age of 1 year, whereas OOP expenditure for DS patients tended to peak during infancy and decreased constantly with age. The detailed numbers of medical expenditure of DS patients are shown in Supplementary Tables 2 and 3.
Fig. 4
Annual trends of the total medical and OOP expenditures in each cohort. (A) Total medical expenditure of patients with DS, (B) OOP expenditure of patients with DS, (C) Total medical expenditure of patients without DS, (D) OOP expenditure of patients without DS.
OOP = out-of-pocket, DS = Down syndrome.
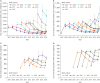
Fig. 5
Temporal trends of the total medical and OOP expenditures in each cohort based on age. (A) Total medical expenditure of patients with DS, (B) OOP expenditure of patients with DS, (C) Total medical expenditure of patients without DS, (D) OOP expenditure of patients without DS.
OOP = out-of-pocket, DS = Down syndrome.
Ecological association between advanced maternal age and the prevalence of live births with DS is shown in Table 2. After adjusting for sex and birth year, all types of maternal-age-specific risks (average maternal age, percentages of mothers aged 35 years or older, and the weighted average of maternal age) significantly increased the DS prevalence at a regional level. Among maternal-age-specific risk variables, the model with the weighted average of maternal age was the best-fitted model.
Table 2
Ecological association between mean maternal age and prevalence of live births with DS

DISCUSSION
As the average age of the mothers is increasing every year, the prevalence of live births with DS has been expected to increase. However, the prevalence was stable at about 5 per 10,000 live births for 9 years from 2007 to 2015 in Korea. These results showed a growing gap between the predicted prevalence based on the calculation formulas from the two existing studies34 and observed one. The calculated predicted values increased with the years, but the observed prevalence tended to be similar or decreased.
After reviewing birth prevalence of chromosomal disorders worldwide, Moorthie et al.5 reported that 10 of the 22 countries contributing to European Surveillance of Congenital Anomalies (EUROCAT) have similar observed and estimated live birth rates of DS. In the remaining countries, the observed birth rate is 20%–50% lower than the expected rate. They explained that the discrepancies between estimated and observed birth rates in South Africa, British Colombia, New Zealand, and Japan are because of unreported termination of pregnancies (TOPs) and the discrepancies in Mexico, Costa Rica, and Cuba may be resulting from substantial under-ascertainment. Under-ascertainment may result from fetal deaths, TOP, or births. Because natural fetal death is reported in only 5%–12% of fetuses with DS, the under-ascertainment of fetal deaths would not significantly affect the birth rate of DS.14
In a previous Korean study, the prevalence of live births with DS in 2005 and 2006 was 3.7 per 10,000 live births.12 Our results showed the prevalence at about 5 per 10,000 live births from 2007 to 2015. Korea does not have any registry program for congenital defects and some doctors did not register a diagnosis of DS because they did not treat DS but treated only the complications of DS such as CHD, hearing loss, eye disorder, and recurrent respiratory infection. Since 2009, NHIS has introduced the Exceptional Treatment System and reduced the payment for patients with rare diseases, and the doctors have actively started to register the diagnosis of DS. Thus, the report from 2005 to 2006 was likely to be under-ascertained.
Although advanced maternal age is the most important risk factor for DS, it was reported that 80% of infants with DS were born to mothers younger than 35 years of age.15 Another study found that most DS live births were reported in mother's aged under 35 years and that most DS fetuses detected by prenatal screening in mothers aged over 35 years were terminated.10 In England and Wales, more than 95% of women recently reported they chose TOP after their babies were diagnosed with any severe disease.16 In addition, it was reported that average rates for TOP owing to DS for 16 countries in EUROCAT were 4.4% in 1980–1984, 28.3% in 1990–1994, and 58.7% in 2005–2009.5 The rate of TOP owing to DS gradually increased, but it was significantly lower than that for other severe congenital diseases. Moorthie et al.5 also suggested under-ascertainment is most likely to be because of TOP in countries where TOP is illegal or where private maternity clinics are readily available. In Korea, private maternity clinics are easily available and TOP is illegal. This suggests that the large difference between the expected and observed live birth rates is because of the high proportion of TOPs owing to DS. The differences between estimate and observed birth rates in Korea increased from 10.79 to 11.94 per 10,000 births in 2007 to 16.94 to 19.29 per 10,000 births in 2015 (Supplementary Table 1). This indicates that the accessibility to prenatal care may be improved and the accuracy of DS diagnosis in prenatal screening may be increased.
Although no spatial pattern was identified over the study period, regional variations in province level were observed. Ecological association between the prevalence of live births with DS and advanced maternal age was also observed. However, without exact matching of mother and child information, the association could be biased, e.g., ecological fallacy and modifiable areal unit problem.
In Korea, the proportion of MA recipients was about 3%,17 but in our study, the proportion of patients with DS who had ever received MA was about 13%. The reason why the proportion of MA among DS patients was high may be partly explained by low accessibility of mothers with a low socioeconomic status to antenatal care. According to a recent study analyzing the effects of socioeconomic status on pregnancy outcomes and complications based on the 2010 NHIS data, the proportion of women who did not receive proper prenatal care significantly differed between MA recipients (29.4%) and National Health Insurance (NHI) beneficiaries (11.4%), and the proportion of women aged over 35 years was also significantly different between MA recipients (43.5%) and NHI beneficiaries (23.3%).18 In addition, the proportion increased in birth cohorts with a longer observational period. In the 2007 birth cohort, the proportion of MA recipients was 23% in comparison with 4.5% in the 2015 birth cohort. The findings imply that DS patients are likely to be registered as disabled or to accrue catastrophic medical expenses. During the past decade, the Korean government has made efforts to reduce medical costs and strengthen the social support for pregnancy and childbirth to overcome extremely low birth rate.19 However, there are still socioeconomic gaps in the accessibility to antenatal care and medical costs in postnatal care.
The OOP expenditure for non-DS children peaked at the age of 1 year, whereas that for children with DS peaked during infancy and decreased constantly as they grew old. Non-DS children begin their social life after 6 months of age and start attending daycare centers. As a result, exposure to various infectious diseases naturally increase and the number of visits to outpatient clinics increase. In contrast, children with DS are born with several congenital defects, which are associated with a substantial medical expenditure as well as OOP expenditure.
This study had several strengths. First, this was the first study to analyze nationwide population-based data for the prevalence of live births with DS in Korea. Second, although there is no national DS registration program, accurate statistical data was obtained because the diagnosis of DS was actively registered after a cost deduction program for patients with rare diseases had been introduced. We also estimated and compared the medial expenditure of children with DS to that of non-DS children. In the low socioeconomic group, the prevalence of DS was high and the medical expenditure of children with DS was about 10-fold higher than that of non-DS children. Therefore, a healthcare policy that reduces or eliminates co-payments for children with DS is needed to lower economic burden and unmet medical needs. Our study could provide evidence that supports long-term planning for medical and social welfare interventions or programs for patients with DS.
There were also several limitations to this study. Because we could not link HIRA database with birth certificates, the prevalence of live births with DS was not determined based on the maternal age. For the same reason, the distribution of children with DS varied according to the hospital address rather than the address of the children, which might be different from the actual place of residence of the children. Our study did not contain information of stillbirths and TOPs, and the number and prevalence of live births with DS could be potentially biased. To overcome these limitations, a national registry program for antenatal and postnatal care of congenital defects including DS is strongly needed.
In conclusion, the prevalence of live births with DS from 2007 to 2015 remained steady at about 5 per 10,000 births or slightly decreased, and the prevalence of live birth with DS was high in mothers receiving MA but decreased significantly over the years. As the total medical and OOP costs for children with DS are higher than those for non-DS children, additional financial and welfare supports are required for them. In the near future, public policies should be implemented to provide adequate antenatal care for mothers and to prevent economic burden of medical care for infants and children with DS.
 XML Download