

 PDF
PDF ePub
ePub Citation
 Print
Print


I. Introduction
Radiographic images are the most widely used diagnostic tools by dentists to assist clinical examination [1] because they can be obtained easily and quickly. Radiographic images can provide data on the internal structure of teeth and other supporting parts to help diagnose dental and oral diseases, such as dental caries [2], periodontitis, fracture of tooth, gingivitis, abscess, and interdental bone loss [3]. In addition, in the area of public health, dental periapical radiographic images are becoming an alternative in determining the relationship between mandibular bone and bone mineral density [456], and tumors in the mouth [7]. In the forensic field, they can be used to determine human identity [8]. However, there is a weakness in radiographic images; radiographic images are usually low in quality such that objects (teeth, trabeculae, cortex, etc.) are still difficult to identify visually [91011].
To address this problem, dentists use their abilities and experience to diagnose diseases from patients' dental radiographic images. Each dentist has different abilities and experience, so the diagnoses provided to patients can vary. The inconsistency of diagnosis is certainly detrimental to the patient because treatment decisions can be different and even contradictory [11]. To alleviate this problem, computer-aided systems to help dentists in the assessment of diseases when using radiographic images have been developed [1213].
In general, the stages used to carry out diagnosis in previous studies are collecting dental images, selecting the region of interest (ROI), preprocessing the ROI, feature extraction, and identification [13].
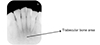
One part of the ROI that is often used for identifying diseases by dentists is the trabecular bone, which is located under the root of the tooth (Figure 1). Previous studies have required image enhancement because of the poor quality of ROI images on the trabecular area [141516]. Originally, the selection of ROIs was usually performed by visual observation and cropping using tools, such as Photoshop, Corel Draw, etc. [17].
The selection of ROI areas has been carried out by semiautomatic [18] and non-automatic [192021] methods. The main weakness of these ROI selection methods is that they still rely on an observer, and it is possible for the observer to select an incorrect ROI. In addition, the size of the selected ROI tends to be too small compared to the trabecular area. The issue of ROI selection may be one of the causes of inaccurate identification results.
Because of the visual limitations of researchers in distinguishing trabecular areas from non-trabecular areas, the obtained trabecular area becomes relatively subjective and does not represent the area of the object being observed. Until now, researchers have had problems in selecting the ROI of the trabecular area in dental radiograph images. These problems should be identified and studied to devise automatic ROI selection methods for the trabeculae.
This paper proposes a method for automated selection of the trabecular area in digital periapical radiographic images using only a series of simple morphological operations. To validate the proposed method, the ROIs selected by the proposed method were compared with the ROIs selected by two experienced dentists pixel by pixel. Computational morphology as the basis of image processing has various types of operations, such as dilation, erosion, closing, filtering, edge detection, region filling, and labeling. In this study, we attempted to develop an automatic ROI selection method for trabeculae that is based on the application of basic morphological operations to distinguish objects on dental radiographic images. The rest of this paper is organized as follows. Previous methods as well as the proposed method for automatic selection of the trabecular bone area are discussed in Section II. We assess the performance of the proposed method in Section III. Finally, Section IV discusses the results and concludes the paper.
II. Methods
In this study, we used 50 digital periapical radiographs obtained from the Dentomaxillofacial Imaging Centre of Universitas Gadjah Mada. The only inclusion criterion was that the dental radiographs belonged to postmenopausal women aged from 36 to 58 years old, who were kept anonymous. All images were assessed for quality assurance by a dentist. These images were taken using dental X-ray Villa Sistemi Medicali endos ACP CEI specification 70 kVp, 8 mA, and 3.2 seconds, by a radiographer. Photostimulable phosphor (PSP) plates were used as image receptors. All periapical images were processed using digital radiography (DBSWin 4.5; Dürr Dental, Bietigheim-Bissingen, Germany). Thus, we obtained images measuring 1252 × 1645 pixels in grayscale and saved in JPG format.
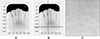
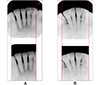
Previous studies have selected ROIs on dental radiographics images in various shapes, sizes, and methods. Figure 2 shows the ROI produced by the method of [22]. Figure 2A is an initial 1262 × 1645 pixel image, in which the trabecular area as an ROI will be selected. A starting point in the desired trabecular area is then selected manually by the user by using a pointer (Figure 2B), which in this example is located about 108 pixels or 3 mm below the right and left mandibular first tooth (31 and 41). Figure 2C shows an ROI selected by the method of [22], whose size is 250 × 250 pixels.
In the research reported in [19], a 3.7 mm × 5.8 mm ROI located on the right side of the lower jaw between the first and second premolar was selected. This study focused on the perception of coarseness of trabecular patterns on dental radiographs. In [20], the ROI was taken in the trabecular area between the premolar and molar teeth using Adobe Photoshop software for the assessment of osteoporosis. The ROI formed a square of 100 × 100 pixels, and it was manually obtained by cropping the trabecula area below the root of the front tooth with a rectangular shape. In [21], ROI selection was performed to evaluate trabecular patterns on panoramic radiographs to predict age-related osteoporosis in postmenopausal women. This research used 560 regions of interest (each of 51 × 51 pixels) in 6 sites on panoramic radiographs obtained using ImageJ. Square ROIs were selected at the interdental 1/3 region including 6 sites, i.e., anterior, premolar, and molar regions of the jaws. The methods of determining ROIs in previous studies are less efficient because they require additional software or manual involvement to determine the ROIs.
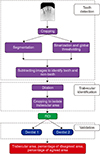
The proposed method consists of three main stages, namely, teeth detection, trabecular identification, and validation, as depicted in Figure 3, and elaborated on as follows.
1. Teeth Detection
This stage begins with cropping an initial image. Cropping is used to eliminate marking on the top or bottom of the image (red boxes). The images used in this study had different photographic markings: at the upper right corner (Figure 4A) or at the lower left corner (Figure 4B). From the original (1252 × 1651 pixels), the initial image was automatically cropped, and the cropped image size was 825 × 1550 pixels (Figure 5).
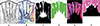
The next step was segmentation of the cropped image. For this purpose, we used an adaptive segmentation method that has been carried out by [22]. The segmentation process consisted of filtering, thresholding, closing, and labelling. The filtering methods used in our previous study were top-hat and bottom-hat filtering. Top-hat filtering shows the maximum gray image value, while bottom-hat filtering shows the minimum gray image value. This filtering produces an image that is brighter than the original image. Subsequently, thresholding is carried out, which is performed automatically on the filtered image using its sub-images. The size of a sub-image is 40 × 40 pixels, and the number of sub-images is the same as the number of pixels that will be changed to 0 (zero) or 1 (one). Those pixels are changed based on the threshold value of the sub-image. This threshold is obtained by finding the average pixel intensity of the sub-image. The pixel intensity in the middle of the sub-image is changed to 1 (one) if it is greater than or equal to the threshold; otherwise, it is changed to 0 (zero). The thresholding process results in a binary image, and it is shown in Figure 6A. The closing operation is performed for connecting pixels of the same object. This is followed by labeling the connected components with colors so that objects near each other tend to have similar colors (Figure 6B).
On the other side, we performed thresholding using the Otsu with a threshold value of 0.74, on the cropping image (Figure 5A). In this process, the teeth are still not completely separated from other objects. Furthermore, we applied watershed segmentation to isolate the teeth. Watershed segmentation is a region-based method that utilizes mathematical morphology [23]. In this method, an image is assumed to reflect a topographic landscape that has ridges and valleys. The elevation values of the topographic landscape are defined by the gray values of the respective pixels. Watershed segmentation has been used in image analysis for medical visualization [232425]. The segmentation results are then changed to RGB color images. Then a composite images operation is performed between the global thresholding image and the RGB color image, followed by the process of removing all connected objects from the composited image. The resulting image is shown in Figure 6C. To obtain the teeth object, we modify the method proposed in [18], which is used to determine the direction of the pores on the trabecular area, and calculate the porous area by counting black pixels on the respective pose objects. A pore object is identified by three directions (D), i.e., vertical (−30° ≤ D ≤ 30°), oblique (−60° < D < −30° or 30° < D < 60°), and horizontal (−90° ≤ D ≤ −60° or 60° ≤ D ≤ 90°). In addition to obtain object directions, the study also classifies objects as small (with an area of less than 72 pixels) and large (with an area larger than or equal to 72 pixels). In this study, the direction used for teeth detection was objects with vertical direction only, whose area is greater than 500 pixels. Furthermore, objects that do not conform to the direction and area will be colored white, and the others (teeth objects) are colored green (Figure 6D). The final step is subtracting the labeled image and the isolated teeth image (Figure 6E).
2. Trabecular Identification
This stage consists of two steps, namely, enhancement of the teeth area and isolation of the trabecular area. Enhancement of the teeth area is performed by using a dilation operation, with the purpose of minimizing the cavity between teeth. Dilation using a disk element structure is then performed on the subtracted image, and the result is then cropped to isolate the ROI. The size of the final image is 825 × 900 pixels. In this final image, the trabecular area is black, while non-trabecular area has non-black color (Figure 6F).
3. Validation
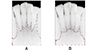
In the validation stage, two dentists manually select the trabecular area of each image, by providing some points at the trabecular area according their respective knowledge.
Let the ROIs produced by the proposed method and a dentist be img1 and img2, respectively. These two ROIs will be compared based on three parameters, i.e., trabecular area (A), percentage of agreed area (S), and percentage of disagreed area (D).
The trabecular area produced by the proposed method Aimg1 and the dentist Aimg2 is calculated by simply counting the number of black pixels in the respective final image. The percentage of agreed area is then defined by

where B is the number of pixels colored black by both the proposed method and the dentist. The percentage of disagreed area, on the other hand, is defined by Eq. (2):

where Cimg1 is the number of pixels colored black in img1 but colored otherwise in img2, and vice versa, Cimg2 is the number of pixels colored black in img2 but colored otherwise in img1.
III. Results
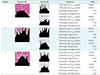
Some results of this study can be seen in Table 1. The ROI area is represented by the black pixels on the final image. For the final image, the trabecular area, the percentage of agreed area, and the percentage of disagree area are calculated. Table 2 shows each of the three measures averaged over the 50 images used in this study. The average trabecular areas of the proposed method, and the 1st and 2nd dentists were 732581.6, 786683.1, and 769142.1 pixels, respectively. From the results of the two dentists, their final average trabecular area was 777912.6 pixels, which is 5.83% larger than the proposed method's 732581.6 pixels. The average percentages of agreed area between the proposed method and the 1st and 2nd dentist were 73.42% and 77.03%, respectively. The average percentages of disagreed area between the proposed method and the 1st and 2nd dentists were 9.19% and 8.31%, respectively. Overall, the final average percentages of agreed and disagreed area were 75.22% and 8.75%, respectively.
IV. Discussion
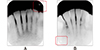
In this paper, a method for automatic selection of the trabecular area in periapical radiographic images using only morphological operations was presented. We have shown that the implementation of the proposed method produces an ROI in the form of the trabecular area of each image input. Furthermore, the ROI area generated by the method was compared to the ROI area obtained by two dentists. The dentists used a tool to select a set of points that were then connected to form the ROI area (Figure 7).
From Table 1, it can be seen that the shape of the produced ROI area is a polygon. In general, the ROI areas produced by the proposed method in this study tend to be smaller than those by the dentists' (Table 2). After validation with the two dentists, based on the average percentages of agreed and disagreed areas, the proposed method's ROI is more similar to the 2nd dentist's ROI.
In comparison with previous work, the ROI produced by our proposed method is larger (Table 3). In comparison with the dentists', the trabecular area produced by the proposed method was 94.17% of that produced by the dentists. Furthermore, the average percentages of agreed and disagreed areas between the proposed method and the dentists were 75.22% and 8.75%, respectively. These performance measures suggest that the proposed image-processing-based method is adequate and can be considered for automatic selection of the trabecular area in digital periapical radiographic images. In the future, we plan to study and incorporate non-morphological operations into the current method to further improve the accuracy of ROI selection.

 XML Download