

 PDF
PDF ePub
ePub Citation
 Print
Print


INTRODUCTION
Non-alcoholic fatty liver disease (NAFLD) is a major public health problem due to its prevalence as high as 25%–30% worldwide which is expected to rise in the near future [1]. Traditionally, it has been suggested that NAFLD is the “hepatic manifestation” of the metabolic syndrome [2]. NAFLD is linked with obesity and also encompasses a range of other liver pathologies including steatosis, nonalcoholic steatohepatitis (NASH), fibrosis, and cirrhosis. Furthermore, it has been reported that the incidence of hepatocellular carcinoma (HCC) could be increased in the presence of NAFLD up to 25% [3]. In addition to hepatic dysfunctions, other metabolic abnormalities have been increased paralleled with NAFLD such as type 2 diabetes mellitus (T2DM), cardiovascular disease and dyslipidemia [4]. Dyslipidemia is defined as the presence of one or more abnormal serum lipid concentration; total cholesterol (TC), triglyceride (TG), low-density lipoprotein cholesterol (LDL-C), and high-density lipoprotein cholesterol (HDL-C) [5]. Since dyslipidemia is the main risk factor related to cardiovascular disease (CVD), sufficient attention is needed to lower dyslipidemia and its undesirable effects. Currently, various treatment options that target each aspect of the dyslipidemia pathogenesis are being explored and advocated, but recent guidelines encourage combination therapy for the management of multiple lipid abnormalities [67]. In the other words, non-pharmacological therapy should be combined with pharmacotherapy.
The Adult Treatment Panel III placed major prominence on lifestyle modification intervention as an essential strategy for clinical management of people at risk for CVD, including individuals with dyslipidemia [8]. Lifestyle modification interventions try to change dietary and exercise behavior of individuals in order to improve their health status. The fundamental components of lifestyle modifications are to clarify healthy dietary patterns and encourage physical activity [9]. Despite clear data and recommendations for NAFLD patients with regard to the management of metabolic abnormalities, little information exists on the utility of diet as a treatment for metabolic abnormalities in NAFLD patients. We, therefore, sought to evaluate the effect of a 2-month nutrition education program on metabolic markers (TC, TG, LDL-C, HDL-C, and fasting blood glucose [FBG]) and dietary intake of overweight/obese NAFLD patients. The program was designed to improve metabolic parameters through dietary modification as a simple, cost-benefit and non-invasive method compared to available pharmacotherapy.
MATERIALS AND METHODS
Design
This was a parallel group, single-blind randomized controlled trial comparing the effect of a nutrition education program with usual care in Non-alcoholic fatty liver disease (NAFLD) patients.
Participants
From September 2015 to June 2016, patients with suspect of NAFLD was consecutively evaluated in the fatty liver clinic of Sedighe Tahere, Isfahan Endocrine and Metabolism Research Center. Subjects were admitted directly to our fatty liver clinic or referred from other general medicine or gastroenterology clinics located in Isfahan city. Subjects found to have NAFLD were then invited to enter this trial. We included patients diagnosed with NAFLD by an expert physician using sonography and biomarkers with higher levels of both alanine aminotransferase and aspartate transaminase more than 31 in men and women) [10], aged 20–50 years old; characterized as overweight/obese (body mass index [BMI] ≥ 24.9 kg/m2) with willingness to participate in the study.
Exclusion criteria were as follows: histologic diagnoses of borderline steatohepatitis or cirrhosis, missing more than 2 education sessions, pregnancy or breastfeeding, alcohol consumption above 20 g/day in men and 10 g/day in women, evidence of other causes of liver disease including drug-induced liver disease, viral hepatitis, autoimmune liver disease, Wilson's disease, hemochromatosis, α-1 antitrypsin deficiency, human immunodeficiency virus positive, severe psychiatric condition, drug dependence or inability to provide informed consent.
All patients provided informed written consent. The study protocol conformed to the ethical guidelines of the 1975 Declaration of Helsinki and was approved by the Research Ethics Committee of Isfahan University of Medical Sciences (ethic number: 393583), and registered at Iranian Registry of Clinical Trials (registration number: IRCT2014101811763N17). In addition, the Consolidated Standards of Reporting Trials (CONSORT) statement guidelines were used to design current study [11].
Sample size
Sample size was calculated by using the sample size formula suggested for similar studies. Considering type 1 and 2 errors 5% (α = 0.05) and 20% (β = 0.2; power = 80%) and considering for a possible loss, we reached the sample size of 41 patients for each group [12].
Trial procedures
Of 327 patients who were invited to the fatty liver clinic, 82 participants fulfilling the inclusion and exclusion criteria were randomized in 1:1 ratio to participate in the nutrition education program (n = 41) or receive usual care (n = 41). To guarantee recruitment balance between the 2 groups and avoid possible risk for selection bias, a blocked randomization method with randomly permuted blocks sizes of 4 was conducted by the biostatistician. Treatment assignments were concealed in numbered sealed envelopes which were opened sequentially upon patient enrollment. Clinicians of fatty liver clinic and statisticians who analyzed results were blinded to the treatment assignment.
Intervention group
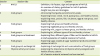
Patients randomized to the intervention group (n = 41) participated in a dietitian-led nutritional education. The patients attended dietary consultation sessions weekly for a total of 2 months. Participants were encouraged to increase the intake of fruits, vegetables, complex carbohydrate, low fat dairy, healthy fats, white meat and fish, and also avoid the intake of unhealthy fats and refined carbohydrates. Moreover, techniques for at-risk situations such as parties and festival celebrations were taught. Furthermore, in each session, the dietitian reviewed the patients' dietary practice and provided recommendations. Adherence to dietary intervention was assessed by weekly phone calls and dietary records. Educational contents of each session were prepared based on United States Department of Agriculture guidelines [13]. The goals of each session are illustrated in Table 1.
Table 1
Lesson plan of nutrition education based on health belief model
Control group
Patients randomized to the control group (n = 41) received routine care at the fatty liver clinic of Sedighe Tahere, Isfahan Endocrine and Metabolism Research Center. At baseline, a physician explained the laboratory test results and the natural history of NAFLD to the patients and then the patients were encouraged to reduce calorie, carbohydrate and fat intake by clinicians.
Data collections
All of the study variables including FBG, lipid profile, physical activity level, anthropometric measures, and dietary intakes were assessed at baseline and after 2 months of intervention. The information about dietary intakes was gathered using a 3-day food record questionnaire, and data was analyzed by nutritionist 4 software (First Databank, Hearst Corp., San Bruno, CA, USA). Participants were asked to record all of their intake during 3 days including 2 usual days and 1 weekend. Physical activity was evaluated by a physical activity record questionnaire which estimated the physical activity status based on metabolic equivalent (MET) tables [14]. Patients were asked to record all of their activities during 3 days including 2 usual days and 1 weekend. Body weight was measured to the nearest 0.1 kg after overnight fasting, without shoes and with minimal clothing by use of a digital scale using IOI 353 (Jawon, Seoul, Korea). Height was measured to the nearest 0.1 cm by using a stadiometer (Seca, Hamburg, Germany). BMI was calculated as weight in kilograms divided by height in meters squared.
Blood samples (10 mL) were collected after twelve hours of overnight fasting. Blood samples were immediately centrifuged (Avanti J-25; Beckman, Brea, CA, USA) at 3,500 rpm for 10 minutes to separate serum. Samples were then stored at −70°C before analysis. We used commercial kits to measure FBG, TG, TC, LDL-C, and HDL-C concentrations (Pars Azmoon Company, Tehran, Iran). The intra- and inter-assay coefficient of variations (CVs) for FBG were 2.0% and 3.5%, respectively. All inter- and intra-assay CVs for lipid profile measurements were < 5%. Measurements of glucose and lipids were performed in a blinded fashion in duplicates (before and after the intervention) at the same time, in the same analytic run, and in random order to reduce systematic error and inter-assay variability.
Statistical analysis
Continuous and categorical data were presented as mean ± standard error and percentage, respectively. Normality distribution of continuous data was evaluated using Kolmogrove-smirnov statistical test, and non-normality distributed data were subjected to natural logarithmic transformation. Within and between groups comparison in terms of quantitative data were conducted using paired samples t-test and analysis of covariance (adjustment was made for baseline values) while for categorical data generalized Mc-Nemar test and χ2 tests were used. All statistical analyses were performed using SPSS software version 15 (SPSS Inc., Chicago, IL, USA). A 2-sided p value of less than 5% was taken as statistically significant.
RESULTS
Four patients in the nutritional education group were excluded due to recurrent lumbar disk (n = 2), following an especial weight-loss plan (n = 1) and unwillingness to attend the program (n = 2). Eight patients in the control group were also excluded for the following reasons: not referring to perform secondary measurements (n = 6) and following an especial weight-loss plan (n = 2). A total of 69 participants (nutritional education [n = 36] and control [n = 33]) completed the trial (Figure 1).
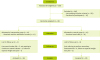
Table 2 shows general characteristics of NAFLD patients who received either nutritional education in addition to usual care or just usual care. There was no significant difference between the two groups for age, educational level, sex, BMI, weight, physical activity, energy intake, and drugs used (p > 0.05). Mean (standard deviation) age, weight and BMI of participants were 48.89 (9.85) years, 83.70 (12.14) kg, and 32.18 (3.83) kg/m2, respectively.
Table 2
General characteristics of NAFLD patients who received either nutritional education in addition to usual care or just usual care
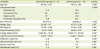
Table 3 shows that nutritional education could significantly decrease serum levels of TC and TG (p < 0.05) compared to usual care. We did not find any significant effect of nutritional education on serum FBG, LDL-C, and HDL-C.
Table 3
Weight, lipid profile and FBG at the baseline and following an 8-week intervention in of NAFLD patients who received either nutritional education in addition to usual care or just usual care

Data are presented as means ± standard error.
FBG, fasting blood glucose; NAFLD, non-alcoholic fatty liver disease; TC, total cholesterol; TG, triglyceride; LDL-C, low-density lipoprotein cholesterol; HDL-C, high-density lipoprotein cholesterol.
*Calculated by paired t-test; †calculated by analysis of covariance, adjusted for baseline values and dietary energy intakes.
Dietary intakes of participants revealed that the amount of carbohydrates, protein and total fat, consumed by intervention group, decreased significantly compared to the placebo (p < 0.05) but the percentage of these macronutrients did not differ between the two groups (p > 0.05). Moreover, total energy and sugar intake of the nutrition education group reduced significantly compared to the usual care group (p < 0.05) (Table 4).
Table 4
Dietary intakes at the baseline and following an 8-week intervention in NAFLD patients

DISCUSSION
Our study showed that a nutrition education intervention in NAFLD patients resulted in a significant decrease in serum TC and TG but did not affect other metabolic markers including FBG, LDL-C, and HDL-C. Also, we revealed that 2 months of nutrition education intervention could decrease total energy, sugar, carbohydrate, protein and fat intake of participants but this intervention did not change the percentage of consumed macronutrients.
Appropriate dietary changes are such an essential component in the management of NAFLD and its co-existing complications because of their demonstrated effects on glycemic control and lipoprotein profile [15]. Therefore, it is not surprising that biochemical profile of the participants was enhanced when attention was paid to the nutritional aspects of life. The reduction in the lipid profile was modest but significant since it was accomplished in a very short time period by a very straightforward and cost-effective intervention. The favorable changes in biochemical indices could be attributed to the dietary changes achieved from this nutrition education intervention. Although, the amount of macronutrient consumed by patients was reduced significantly, the percent of these macronutrients did not change which means that it was energy intake that showed the most alterations. On the other hand, our result showed that included patients consumed less energy with the same share of macronutrients. It should be mentioned that the short intervention duration (2 months) cannot be established to prove lifelong changes in eating habits, but does show the ability of the education program to influence on some aspects of the individuals' diet. So, the results of our study are comparable with other studies using similar methods, but less robust than those from studies that established a multidisciplinary lifestyle modification program for a longer period. Furthermore, it should be stated that some of our study participants' plasma glucose or serum lipoprotein profiles were in the normal range. However, even for individuals whose metabolic profiles are in the normal range, a further improvement is appreciated in terms of primary prevention of other complications such as T2DM, metabolic syndrome and CVD.
It has been suggested that weight reduction is the main underlying mechanism which could link nutrition education to metabolic indices' improvement. We reported in our previous study that our nutrition education intervention could reduce weight and BMI significantly [10]. Weight reduction has been accompanied by significant improvements in blood glucose and lipid abnormalities [1617]. Surprisingly, beneficial effects of weight loss may be even possible at high post-treatment BMIs (> 30 kg/m2) [1819]. Furthermore, our intervention reduced sugar intake of participants. Ambrosini et al. [20] demonstrated that higher sugar intake as sugar sweetened beverages was associated with higher levels of serum TG which is in line with our findings. It has been suggested that the association between sugar intake and lipid abnormalities might be independent of BMI [20]. There is mechanisms which link higher sugar intake to cardio-metabolic risk factors. Higher sugar intake without compensatory reduction in energy intake has resulted in positive energy balance and obesity [21]. Furthermore, sugar with its rapidly absorbable properties led to a high dietary glycemic load, which is linked with insulin resistance, inflammation and increased cardiovascular risk [2223].
Possible limitations of the study should be considered when interpreting the data and planning future research. Collecting dietary intake data via self-report is mostly accompanied with reporting bias. On the other hand, although we used 3-day food records as a gold standard method of dietary assessment, our included participants were overweight/obese which have been proved to underestimate their dietary intakes. Another point is that more patients might be included, if available, in future studies even though the sample size was adequate according to power calculations and scientific standards for research. However, there are important strengths to our study as well. The method of our nutrition education intervention is simple and low-priced that could be used by clinicians in private or public clinics.
CONCLUSION
According to what was discussed, we found that nutrition education intervention could significantly reduce serum levels of TC and TG but did not affect other metabolic markers including FBG, LDL-C, and HDL-C. Also, it could reduce total energy, saturated fat and sugar intake. Thus, this educational program could be useful for NAFLD patients in order to improve their metabolic markers and simultaneously dietary intakes as an easy, cost-benefit and non-invasive approach. This program could be used by clinicians in private clinics or for public health education. Furthermore, we need more clinical trials with more sample size and duration to draw a firm link between nutritional changes and metabolic markers’ improvements.
 XML Download