

 PDF
PDF ePub
ePub Citation
 Print
Print


INTRODUCTION
An increase in the prevalence of dyslipidemia has been strongly associated with the mortality rate from cardiovascular disease in Korea [1]. Recent nationwide data showed an improvement in factors associated with cardiovascular disease, such as an increase in the number of non-smokers or treatment rate for hypertension. However, the prevalence of dyslipidemia (hypercholesterolemia) in adults over 30 years of age continues to increase, from 8.0% in 2005 to 19.9% in 2016 [2].
Urbanization and industrialization cause changes in lifestyle patterns and population crowding, which in turn lead to regional differences in the prevalence of dyslipidemia. Such changes on a national scale are responsible for the primary factors for dyslipidemia such as western diets and reduced physical activity. In Asian countries, including China, India, and Thailand, the prevalence of dyslipidemia in urban areas is approximately 10% higher than that in rural areas [3456]. In Korea, the prevalence of dyslipidemia was 43.8% in large cities, 42.6% in small to medium cities, and 47.8% in rural areas; there was only a small difference of approximately 4%–5% among these areas [7]. However, since the urban population in Korea accounts for 81.8% of the total population in 2016 [2], actual population with dyslipidemia in Korea lives in the cities than in rural area. Therefore, it is important to develop separate control measures to prevent dyslipidemia in urban residents. Among the factors that affect the prevalence of dyslipidemia, differences in sex were analyzed in the 2013–2015 Korea National Health and Nutrition Examination Survey (KNHANES) [8]; however, no remarkable difference was observed between sexes (49.9% in women and 50.1% in men). Interestingly, the contribution of dyslipidemia to the risk of cardiovascular disease is 4.1% in women and 8.7% in men [9]; considering the difference in these values, more detailed management strategies for dyslipidemia need to be taken in men.
The revised treatment guidelines of 2015 for dyslipidemia established Mediterranean diets and the Dietary Approaches to Stop Hypertension diet as a therapeutic lifestyle change [10]. In typical dietary treatments for dyslipidemia, energy, total fat, cholesterol, and monosaccharide intake are restricted, whereas intake of an appropriate amount of dietary fiber and n-3 fatty acids is recommended. However, when taking a meal, people tend to ingest various foods and nutrients and should not overlook the interactions with each other [11]. Major studies on dietary patterns have recently used dietary intake surveys to statistically extract significant dietary patterns within a population and analyze the relationships of these dietary patterns with diseases [12]. Recently, a study analyzing the relationship between dietary patterns and dyslipidemia in Koreans in men and women, separately identified a balanced diet pattern; a coffee, fat, and sugar pattern; a whole grain/white rice and noodles pattern; and a western diet pattern. They reported that the balanced diet pattern and the coffee, fat, and sugar pattern were significantly related to the incidence of dyslipidemia [13]. However, with regard to dyslipidemia, a separate analysis of dietary patterns is required for male urban residents, as they are a distinct population from men residing in all communities and have unique characteristics.
The purpose of this study was to analyze the relationship between dyslipidemia and dietary patterns in male urban residents of Korea. Through this study, we ultimately derived a low risk dietary pattern for dyslipidemia and propose such a dietary pattern for healthy lifestyle.
MATERIALS AND METHODS
Subjects and exclusion criteria
The epidemiological data for the urban cohort were obtained from the Korean Genome and Epidemiology Study (KoGES) conducted by the Korea Centers for Disease Control and Prevention. The subjects of the KoGES participated in the study voluntarily. [14]. In this study, we selected adult men aged 40–64 years who participated in the urban cohort-based survey for disease prevention as part of the KoGES in 2012–2014. After excluding men with missing values in the open-ended nutritional questionnaire or the biochemical tests, a total of 6,343 male subjects remained, of which we further excluded subjects who had been diagnosed with hypertension, diabetes, stroke, myocardial infarction, inflammatory disease, or cancer. Finally, we analyzed data from the remaining 5,643 subjects who had not been diagnosed with any of the above mentioned diseases. Before conducting the study, we received approval from an Institutional Review Board of Wonkwang University (WKIRB-201605-SB-028).
Dietary assessment and dietary pattern
Dietary intake survey
We analyzed the meals and nutritional intake using 24-hour recall data provided in the KoGES. For the KoGES, interviews were conducted by an investigator at a primary examination center. After the first dietary intake survey, a second telephonic survey was conducted for the same sample. The dietary intake data used in this study were obtained face to face interviews. Subjects with a daily energy intake of < 400 kcal or > 4,000 kcal were excluded. We used the 24-hour recall data as the base data for the analysis of dietary pattern.
Classification into food groups
We used the 18 food codes included in the KoGES and reclassified foods in each food group. Since grains typically contribute to a considerable amount of the daily energy intake in Koreans, they are often encountered in a staple pattern. We sub-divided the grains into 8 categories: white rice, other mixed grains, wheat/bread, noodles, ramen, pizzas/hamburgers/sandwiches, rice cakes, and cereal/snacks. Vegetables were subdivided into 3 categories: vegetables with a unique color (dark green vegetables, orange vegetables, and red vegetables); general vegetables; and kimchi, which is frequently consumed by Koreans. Meats were divided into red meats and poultry based on the classification by Linseisen et al. [15]; processed meats were included in cooked/processed foods. Fish and shellfish were categorized as fish and fermented seafood/roe, whereas shellfish containing products were included in cooked/processed foods. Beverages were categorized as ground coffee/leaf-based tea, alcoholic beverages; coffee mix, sugar-based teas, and carbonated beverages were included in sugars. In addition to these 18 newly classified food groups, we used sweet potatoes and potatoes, legumes, nuts and seeds, eggs, fruits, fat and oil and dairy categories from the KoGES, amounting to a total of 25 food groups.
Factor analysis
For factor extraction, we used principal component analysis and for factor rotation, we used varimax rotation. We extracted the first 12 factors with an eigenvalue of at least 1.4 and communality of at least 0.4, but we used components with the ability to explain within factor variance and factor loading of at least 0.2 to construct the final factors. From this, we derived a total of 3 dietary patterns and named these patterns on the basis of characteristics of the food groups they included.
Statistical analysis
Covariates
Among the data obtained from the urban cohort study, we analyzed the education and income levels using data from the questionnaire based sociodemographic survey. We analyzed the smoking status and exercise status from the lifestyle habit survey. To evaluate the subjects' general characteristics and anthropometric the KoGES Health Examinees was conducted using the following methods: demographic variables such as subjects' age, household income, and education were recorded using a questionnaire. Household income was categorized as less than 1 million KRW, 1–3 million KRW, 3–4 million KRW, 4–6 million KRW and more than 6 million KRW. Education was categorized as elementary school, middle school, high school, university and more. For smoking status, subjects were asked whether they smoked at least 5 packs (100 cigarettes) in total, and the responses were yes (current smoker), yes (past smoker), or no. With regard to alcohol consumption, subjects were asked whether they were non-drinkers or were unable to drink, and the responses were yes, no (past drinker), or no (current drinker). For exercise habits, subjects were asked whether they regularly exercised at an intensity that made them sweat, and the responses were yes or no. Obesity was defined as a body mass index (BMI) ≥ 25 kg/m2 and BMI was calculated from the subjects' height (m) and weight (kg) using the formula:
To calculate energy intake, we added the energy content of all the individual foods. Subjects who met following criteria were diagnosed with dyslipidemia; hyper low density lipoprotein (LDL) cholesterolemia, defined as a serum LDL cholesterol level ≥ 130 mg/dL; high density lipoprotein (HDL) cholesterolemia, defined as a serum HDL cholesterol level ≤ 40 mg/dL; hypercholesterolemia, defined as a serum total cholesterol level ≥ 200 mg/dL; and hypertriglyceridemia, defined as a serum triglyceride level ≥ 150 mg/dL [10].
Dietary pattern analysis
To derive dietary patterns for Korean men, we performed factor analysis using 25 food groups. After extracting the first 12 factors, we derived the final dietary patterns by considering factor loading and the amount of variance explained by each factor by using criteria of eigenvalue = 1.3 and communality = 0.4. To analyze the relationship between dietary patterns and dyslipidemia, we divided the factor scores of the dietary patterns into tertiles, performed analysis of variance and general linear model analysis of the participant's general characteristics and biochemistry test results, and conducted a logistic regression analysis of the indicators of dyslipidemia risk by pattern. All analyses were conducted using Statistical Package for Social Science (SPSS) ver. 23.0 (IBM Corporation, Chicago, IL, USA).
RESULTS
Analysis of characteristics of subjects
Table 1 shows general characteristics, anthropometric and biochemical parameter of 5,643 subjects. The mean age of subjects was 50.7 ± 7.1 years. Subjects who exercise was found to be 53.9%. Except that BMI (24.1 kg/m2) was in the overweight phase, blood pressure, waist circumference, fasting glucose, triglyceride, total cholesterol, LDL cholesterol and HDL cholesterol were all within normal range.
Table 1
General characteristics of subjects in aged 40–64 years men using by the KoGES
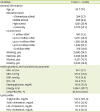
Data are mean (standard deviation) and number (%).
KoGES, Korean Genome and Epidemiology Study; BMI, body mass index; SBP, systolic blood pressure; DBP, diastolic blood pressure; WC, waist circumference; LDL, low density lipoprotein; HDL, high-density lipoprotein.
![]()
Factor analysis to identify dietary patterns
The results of the factor analysis of the remaining 25 food groups are shown in Table 2. A total of 3 factors were extracted from the food groups; the eigenvalues of factors 1, 2, and 3 were 2.391, 1.724, and 1.433, respectively, and the cumulative variance explained was 21.338%. Names for each factor were determined on the basis of the food groups with loading factors = 0.2. Factor 1, which was composed of general vegetables, fats and oils, colored vegetables, fish, legumes, red meats, sweet potatoes and potatoes and white rice was named the rice based Korean food pattern. Factor 2, which was composed of dairy product, wheat/bread, noodles, cereal and snacks, and coffee/leaf based tea was named the flour based western food pattern. Factor 3, which was composed of fats and oils, eggs, ramen, and processed foods, was named the convenience food dietary pattern. The results showed that the special dietary pattern of men living in city was derived from balanced diet except kimchi. In addition, bread, noodles, ramen and processed food, etc. The naming of dietary pattern showed easily dietary style.
Table 2
Factor loading for 3 dietary pattern in aged 40–64 years men using by the KoGES
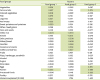
Statistical analysis used factor analysis varimax method. The shadows indicated coefficient factor load greater than 0.2.
KoGES, Korean Genome and Epidemiology Study.
![]()
Characteristics by factor score tertiles of each food pattern
Table 3 shows the subjects' general characteristics and biochemical parameter results by factor score tertiles for each dietary pattern. A high factor score for the rice based Korean food pattern was associated with a high age (p < 0.05) and low total cholesterol (p < 0.05). A high factor score for the flour based western food pattern was associated with high BMI (p < 0.001), total cholesterol level (p < 0.001), LDL cholesterol level (p < 0.001), systolic blood pressure (p < 0.001), and diastolic blood pressure (p < 0.05). A high factor score in the convenience food dietary pattern was associated with high BMI (p < 0.01) and triglyceride (p < 0.01).
Table 3
Characteristics according to tertiles of dietary pattern
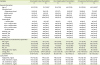
Data are mean (standard deviation) and number (%).
Statistical analysis used χ2 and analysis of variance.
KoGES, Korean Genome and Epidemiology Study; BMI, body mass index; SBP, systolic blood pressure; DBP, diastolic blood pressure; WC, waist circumference; LDL, low density lipoprotein; HDL, high-density lipoprotein.
*Mean (standard deviation); †p < 0.05; ‡p < 0.01; §p < 0.001.
![]()
Analysis of dyslipidemia risk by dietary pattern
Table 4 shows the analysis of dyslipidemia risk by dietary pattern. After dividing the subjects into tertiles for each dietary pattern, we analyzed the risk of dyslipidemia and found that for the rice based Korean food pattern, the group with the highest factor score had a significantly lower risk of hyper LDL cholesterolemia (odds ratio [OR], 0.802; 95% confidence interval [CI], 0.698–0.922, p for trend < 0.01) and higher total cholesterol level (OR, 0.868; 95% CI, 0.761–0.990; p for trend < 0.05) than the group with the lowest factor score. For the flour based western food pattern, the group with the highest factor score showed a significantly lower risk of hyper LDL cholesterolemia (OR, 1.189; 95% CI, 1.033–1.367; p for trend < 0.05).
Table 4
Multivariate adjusted odds ratios (95% confidence intervals) for dyslipidemia by tertile of dietary patterns

LDL, low density lipoprotein; HDL, high-density lipoprotein.
Statistical analysis used multiple logistic regression. All data was adjusted for age, waist circumference, income, smoking, exercise, alcohol drinking and total energy intake.
![]()
DISCUSSION
In the present study, we aimed to provide basic data for developing dietary guidelines to prevent dyslipidemia and analyzed the relationships between dietary patterns and dyslipidemia indices in urban Korean men with no history of chronic disease. We derived 3 dietary patterns from Korean men: the rice based Korean food pattern, the flour based western food pattern, and the convenience food dietary pattern.
The rice based Korean food pattern, corresponding to a healthy pattern, includes white rice, vegetables, fish and meat, beans/pulses, and potatoes/sweet potatoes, but does not include kimchi. Several previous studies have reported that a conventional Korean style pattern, including rice and kimchi, did not show any relationship with or an increased risk of metabolic disease. In a study analyzing data from the 2001–2005 KNHANES, a dietary pattern including rice and kimchi was associated with a high risk of obesity (p for trend = 0.039) [16]. Similarly, another study analyzing the relationships between dietary patterns and metabolic syndrome in 406 Korean adults showed that a traditional dietary pattern was associated with an increased risk of metabolic syndrome [17]. On the other hand, an increased dietary pattern score for “the rice based Korean food pattern” derived in the present study was associated with significant decreases in the LDL cholesterol level and the risk of hypercholesterolemia. Considering that kimchi accounts for one-third of the sodium intake in Korean diets [18] and that sodium intake is correlated with obesity and associated with cardiovascular disease [1920], it is surprising that we observed a decrease in the risk of dyslipidemia with a Korean style diet excluding kimchi.
The rice based Korean food pattern derived from our study reveals 2 points: 1) The representative Korean food of kimchi is no longer a part of the major dietary pattern in residents like those in our study, and 2) a Korean style dietary pattern with rice as a staple food can help prevent dyslipidemia. In Choi and Moon's study [21], a study that analyzed the dietary patterns by region type using the KNHANES showed that the number of meals containing kimchi in the order of rural, small and medium urban and large cities decreased. Therefore, the dietary pattern for diverse food groups excluding kimchi is considered to be a unique dietary pattern extracted from the urban. Nevertheless, consumption of white rice has decreased by almost 40 g, from 205.3 g in 2008 to 166.7 g in 2016 [22], suggesting that other grains besides rice are being consumed and that the constitution of staple foods is changing. Therefore, it is important for nutritional experts to emphasize that a traditional Korean dietary pattern, consisting of rice and various accompaniments, helps prevent dyslipidemia and for Korean men to implement and maintain a Korean style dietary pattern.
The derivation of the flour based western food pattern is thought to appropriately reflect domestic trends in food intake patterns, in which noodles or bread are increasingly consumed as a staple food. In 2008, among the high frequency foods for men, bread, noodles, and cereal accounted for 10.03%, 2.52%, and 2.05%, respectively, but these values increased to 18.63%, 3.81%, and 3.06% by 2015 [22], demonstrating persistent growth in the consumption of processed wheat flour products among men. In our study, the flour based western food pattern was derived as one of the dietary patterns and showed a typical dietary pattern wherein bread, noodles, and cereal, generally considered snack foods, formed an easy to prepare staple food for breakfast and lunch. An increase in the flour based western food pattern was associated with an increased risk of dyslipidemia; some previous studies reported that excessive carbohydrate intake is associated with obesity and blood lipid abnormalities [23]. Similarly, in this study, an increase in the flour based western food pattern was associated with the younger age and high BMI. Therefore, to prevent dyslipidemia in Korean men, we recommend a reduced intake of bread and noodles. In addition, since the obesity rate for individuals in their 30s and 40s is approaching 45%, separate dietary guidelines are required to reduce the consumption of processed wheat flour products as a staple food in young male urban residents.
The subjects of this study had several specific characteristics. We used an urban cohort to analyze adult men aged 40–64 years who resided in cities in Korea. The process of industrialization for economic development in Korea was accompanied by urbanization due to shifts in population between regions, and the industrialized urban environment led to changes in lifestyle patterns. When the prevalence of dyslipidemia was analyzed in urban and rural areas using data from KNHANES III, the difference in prevalence was only approximately 5%. However, in the actual survey, the size of the affected population was much larger in cities (664 persons) than in rural areas (133 persons) [7]. Thus, the actual distribution of patients is heavily skewed towards cities. It is noteworthy that, in this study, we identified dietary patterns associated with dyslipidemia in male urban residents. It is necessary to promote education and implementation of dietary guidelines that recommend meals consisting of rice with various accompaniments and restrict intake of processed wheat based products such as bread and noodles as staple foods in urban men.
Although this study was conducted in men, alcohol was not a significant factor, probably because it was a general pattern in men rather than a specific pattern with a characteristically high level of alcohol consumption. Therefore, because this study only investigated men, it is important to analyze dietary patterns in female urban residents as well in order to test the relationships between diseases, high alcohol consumption, and different subpopulations. In addition, to properly utilize the dietary patterns derived in this study, it is necessary to consider growing social phenomena such as one-person households, late marriages, and no marriage in urban men when developing dietary guidelines and foods.
In this study, we analyzed the relationships between dietary patterns and dyslipidemia in urban residing male adults, with the aim of providing basic data for guidelines to prevent and control cerebro- and cardiovascular diseases. This study had a few limitations. First, because this was not a complete survey and only analyzed men without a history of the disease who were resident in some cities, there were some problems in generalizing the results. In addition, because this was a cross- sectional study, we were unable to precisely examine the causal relationship between dietary patterns and dyslipidemia. Further studies will be needed to overcome these limitations. Moreover, because this study used the 24-hour recall method to derive dietary patterns, the results may not reflect everyday meals. Nevertheless, the importance of this study lies in the derivation of dietary patterns in male urban residents who are at a relatively high risk of dyslipidemia and in the fact that we provide evidence for significant differences in dyslipidemia risk according to dietary patterns. Our study will provide basic data for dietary guidelines for the prevention of dyslipidemia in male urban-dwelling Korean men.
 XML Download