초록
Background
The standardized autonomic function test has become widely available. How-ever, there are no reference data for this test for the Korean population. This study explored reference data for sudomotor and cardiovagal function tests for the Korean population.
Methods
The sweat volume by quantitative sudomotor axon reflex test, heart-rate response to deep breathing (HRdb), expiration:inspiration (E:I) ratio, and Valsalva ratio (VR) were measured in 297 healthy Korean volunteers aged from 20 to 69 years. Multivariate regression analysis was performed to evaluate the effects of age, sex, and body mass index on these variables. The 2.5th, 5th, 10th, 90th, 95th, and 97.5th percentile values were obtained for each investigation.
REFERENCES
1.Low PA., Tomalia VA., Park KJ. Autonomic function tests: some clinical applications. J Clin Neurol. 2013. 9:1–8.

2.Low PA., Denq JC., Opfer-Gehrking TL., Dyck PJ., O’Brien PC., Slezak JM. Effect of age and gender on sudomotor and cardiovagal function and blood pressure response to tilt in normal subjects. Muscle Nerve. 1997. 20:1561–1568.

3.Sletten DM., Weigand SD., Low PA. Relationship of Q-sweat to quantitative sudomotor axon reflex test (QSART) volumes. Muscle Nerve. 2010. 41:240–246.

4.Chen SF., Chang YT., Lu CH., Huang CR., Tsai NW., Chang CC, et al. Sweat output measurement of the post-ganglion sudomotor response by Q-Sweat Test: a normative database of Chinese indi-viduals. BMC Neurosci. 2012. 13:62.

5.Goldstein IB., Shapiro D. The cardiovascular response to postural change as a function of race. Biol Psychol. 1995. 39:173–186.

6.Jeong H., Park KJ., Kang H., Choi NC., Kwon OY., Lim B. Effects of age, sex, and body mass index on sudomotor and cardiovagal functions in a healthy Korean population. Neurol Asia. 2016. 21:255–260.
7.Park KJ., Lee H., Kim HA., Kang SY., Kim BJ., Nam TS, et al. Guidelines for autonomic function test. J Pain Aut Disord. 2013. 2:55–65.
9.Low PA., Caskey PE., Tuck RR., Fealey RD., Dyck PJ. Quantitative sudomotor axon reflex test in normal and neuropathic subjects. Ann Neurol. 1983. 14:573–580.

10.Low PA., Opfer-Gehrking TL., Proper CJ., Zimmerman I. The effect of aging on cardiac autonomic and postganglionic sudomotor function. Muscle Nerve. 1990. 13:152–157.

11.McCance RA., Purohit G. Ethnic differences in the response of the sweat glands to pilocarpine. Nature. 1969. 221:378–379.

12.Vinik AI., Smith AG., Singleton JR., Callaghan B., Freedman BI., Tu-omilehto J, et al. Normative values for electrochemical skin con-ductances and impact of ethnicity on quantitative assessment of sudomotor function. Diabetes Technol Ther. 2016. 18:391–398.

13.Ewing DJ., Martyn CN., Young RJ., Clarke BF. The value of cardiovascular autonomic function tests: 10 years experience in diabetes. Diabetes Care. 1985. 8:491–498.

14.Torsvik M., Häggblom A., Eide GE., Schmutzhard E., Vetvik K., Win-kler AS. Cardiovascular autonomic function tests in an African population. BMC Endocr Disord. 2008. 8:19.

15.Vita G., Princi P., Calabro R., Toscano A., Manna L., Messina C. Cardiovascular reflex tests. Assessment of age-adjusted normal range. J Neurol Sci. 1986. 75:263–274.
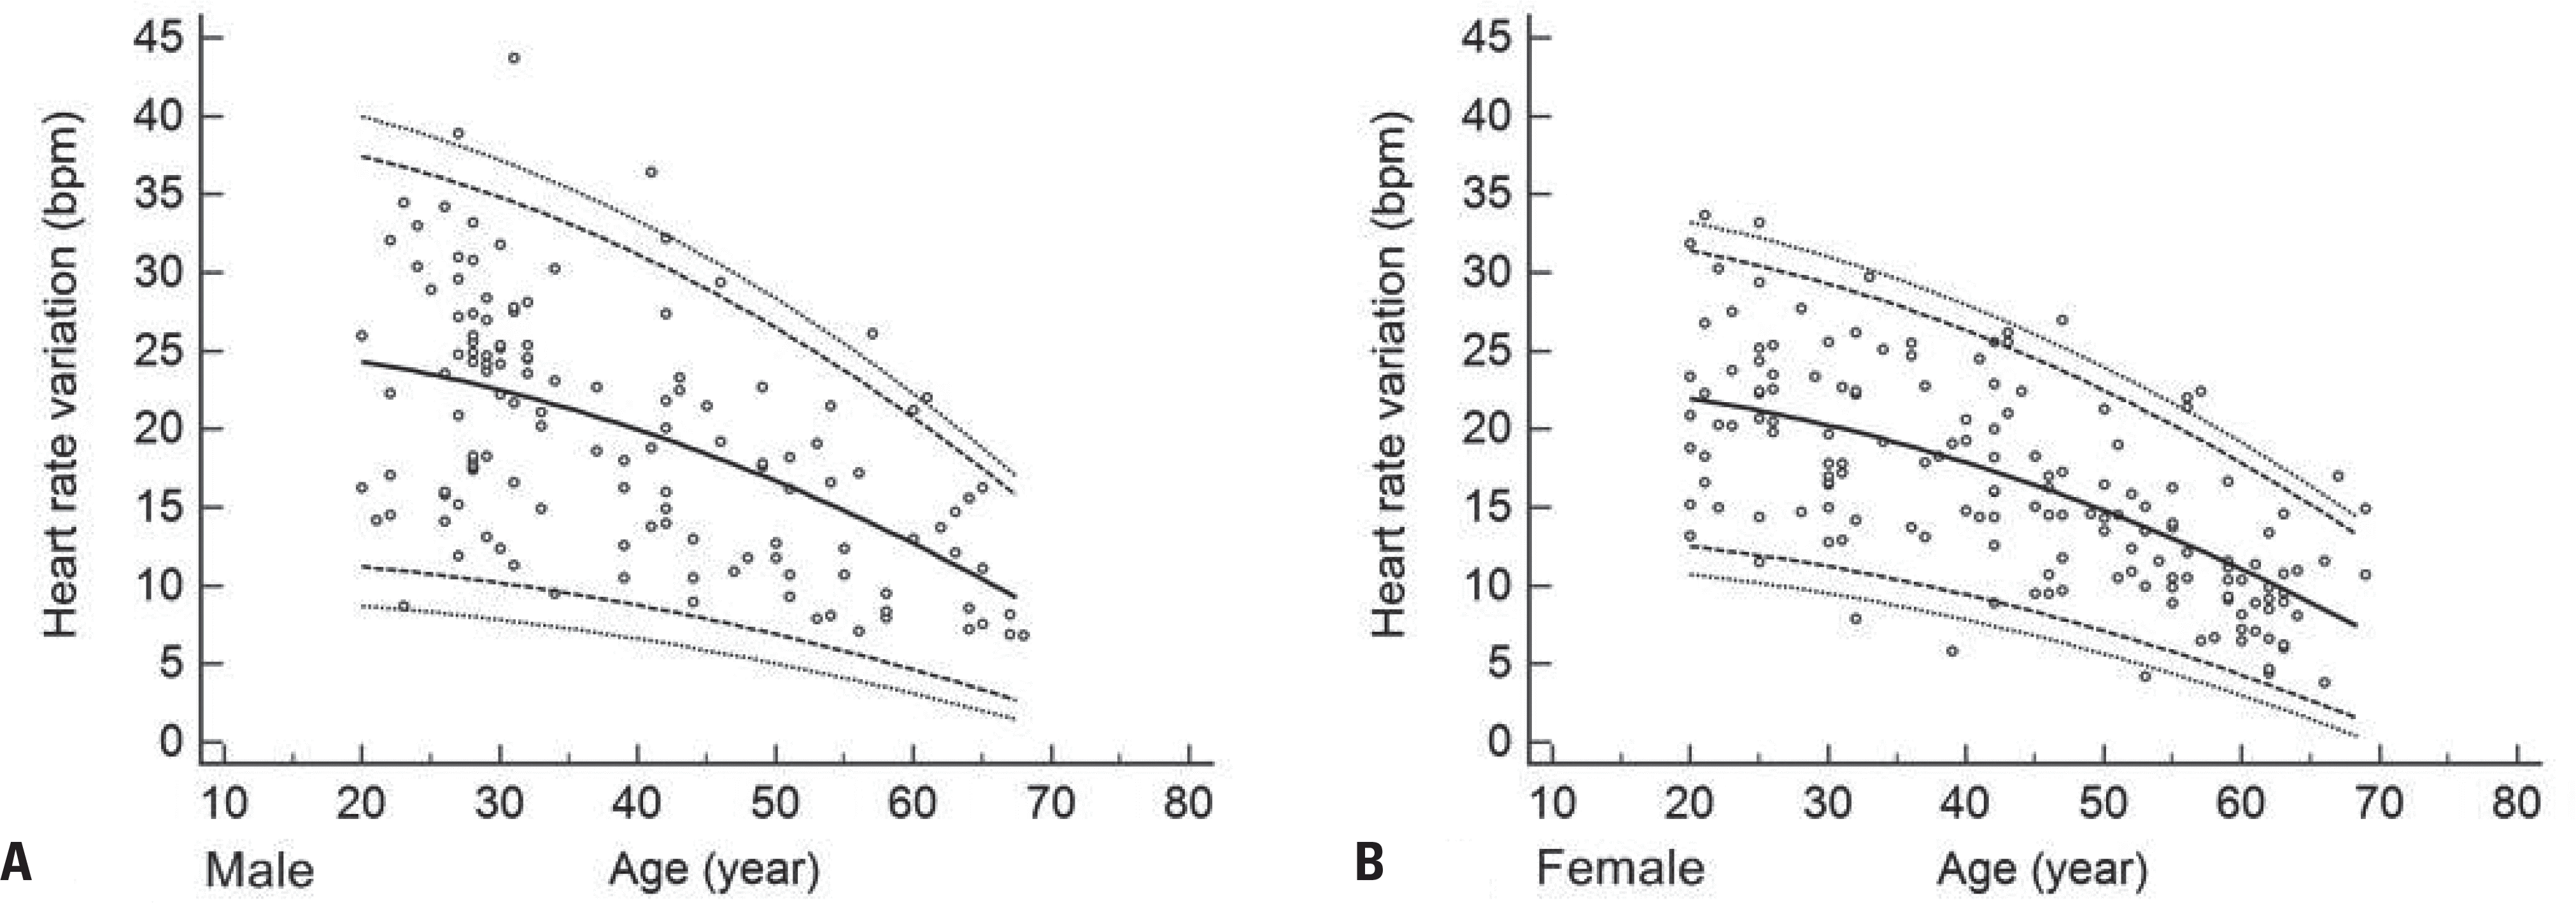
Fig. 1.
Heart-rate response to deep breathing (HRdb) as a function of age for males (A) and females (B). The HRdb was negatively correlated with age and was lower in females than in males. Lines show 2.5th, 5th, 50th, 95th, and 97.5th percentiles. bpm, beats per minute.

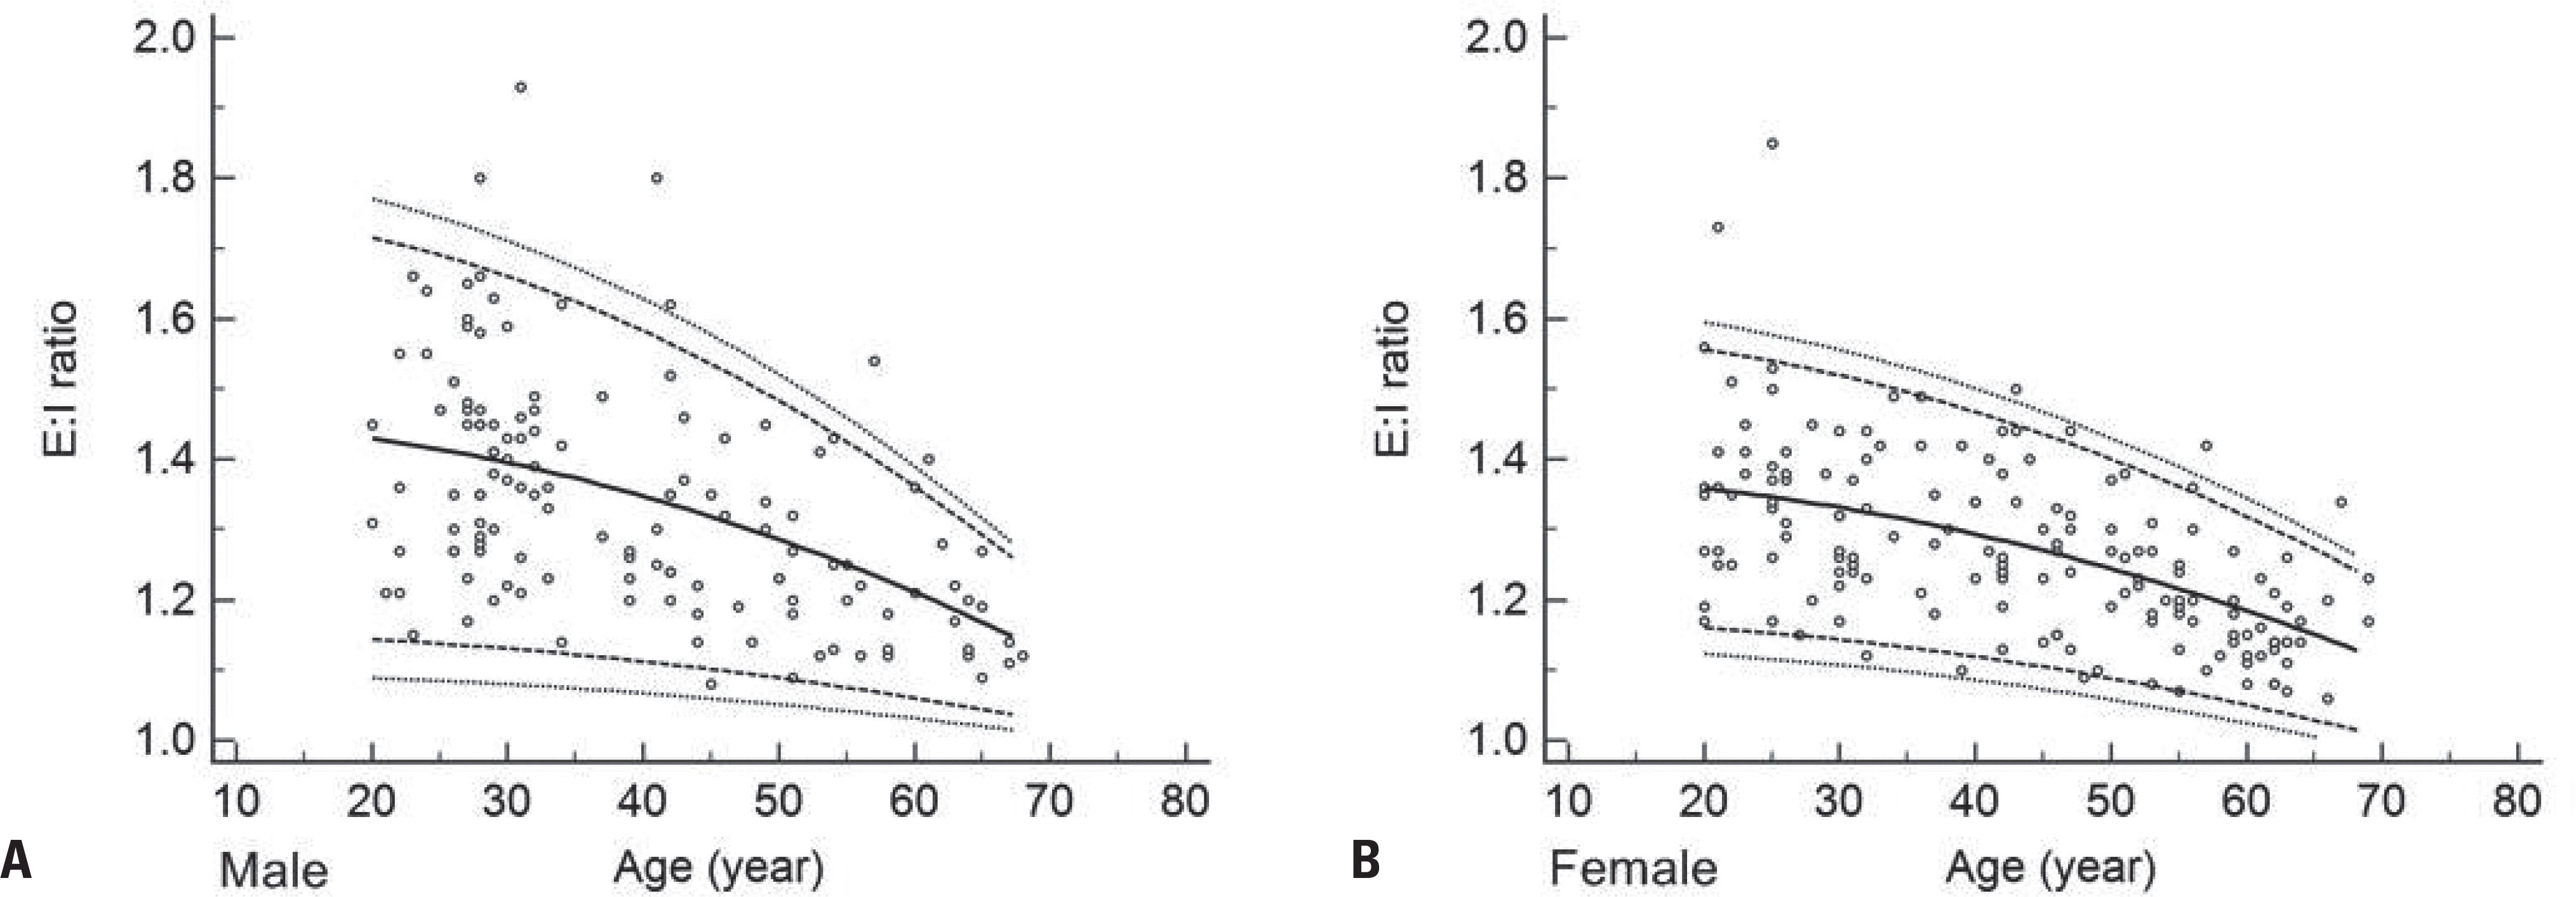
Fig. 2.
Expiration:inspiration (E:I) ratio as a function of age for males (A) and females (B). The E:I ratio was negatively correlated with age and was lower in females than in males. Lines show 2.5th, 5th, 50th, 95th, and 97.5th percentiles.

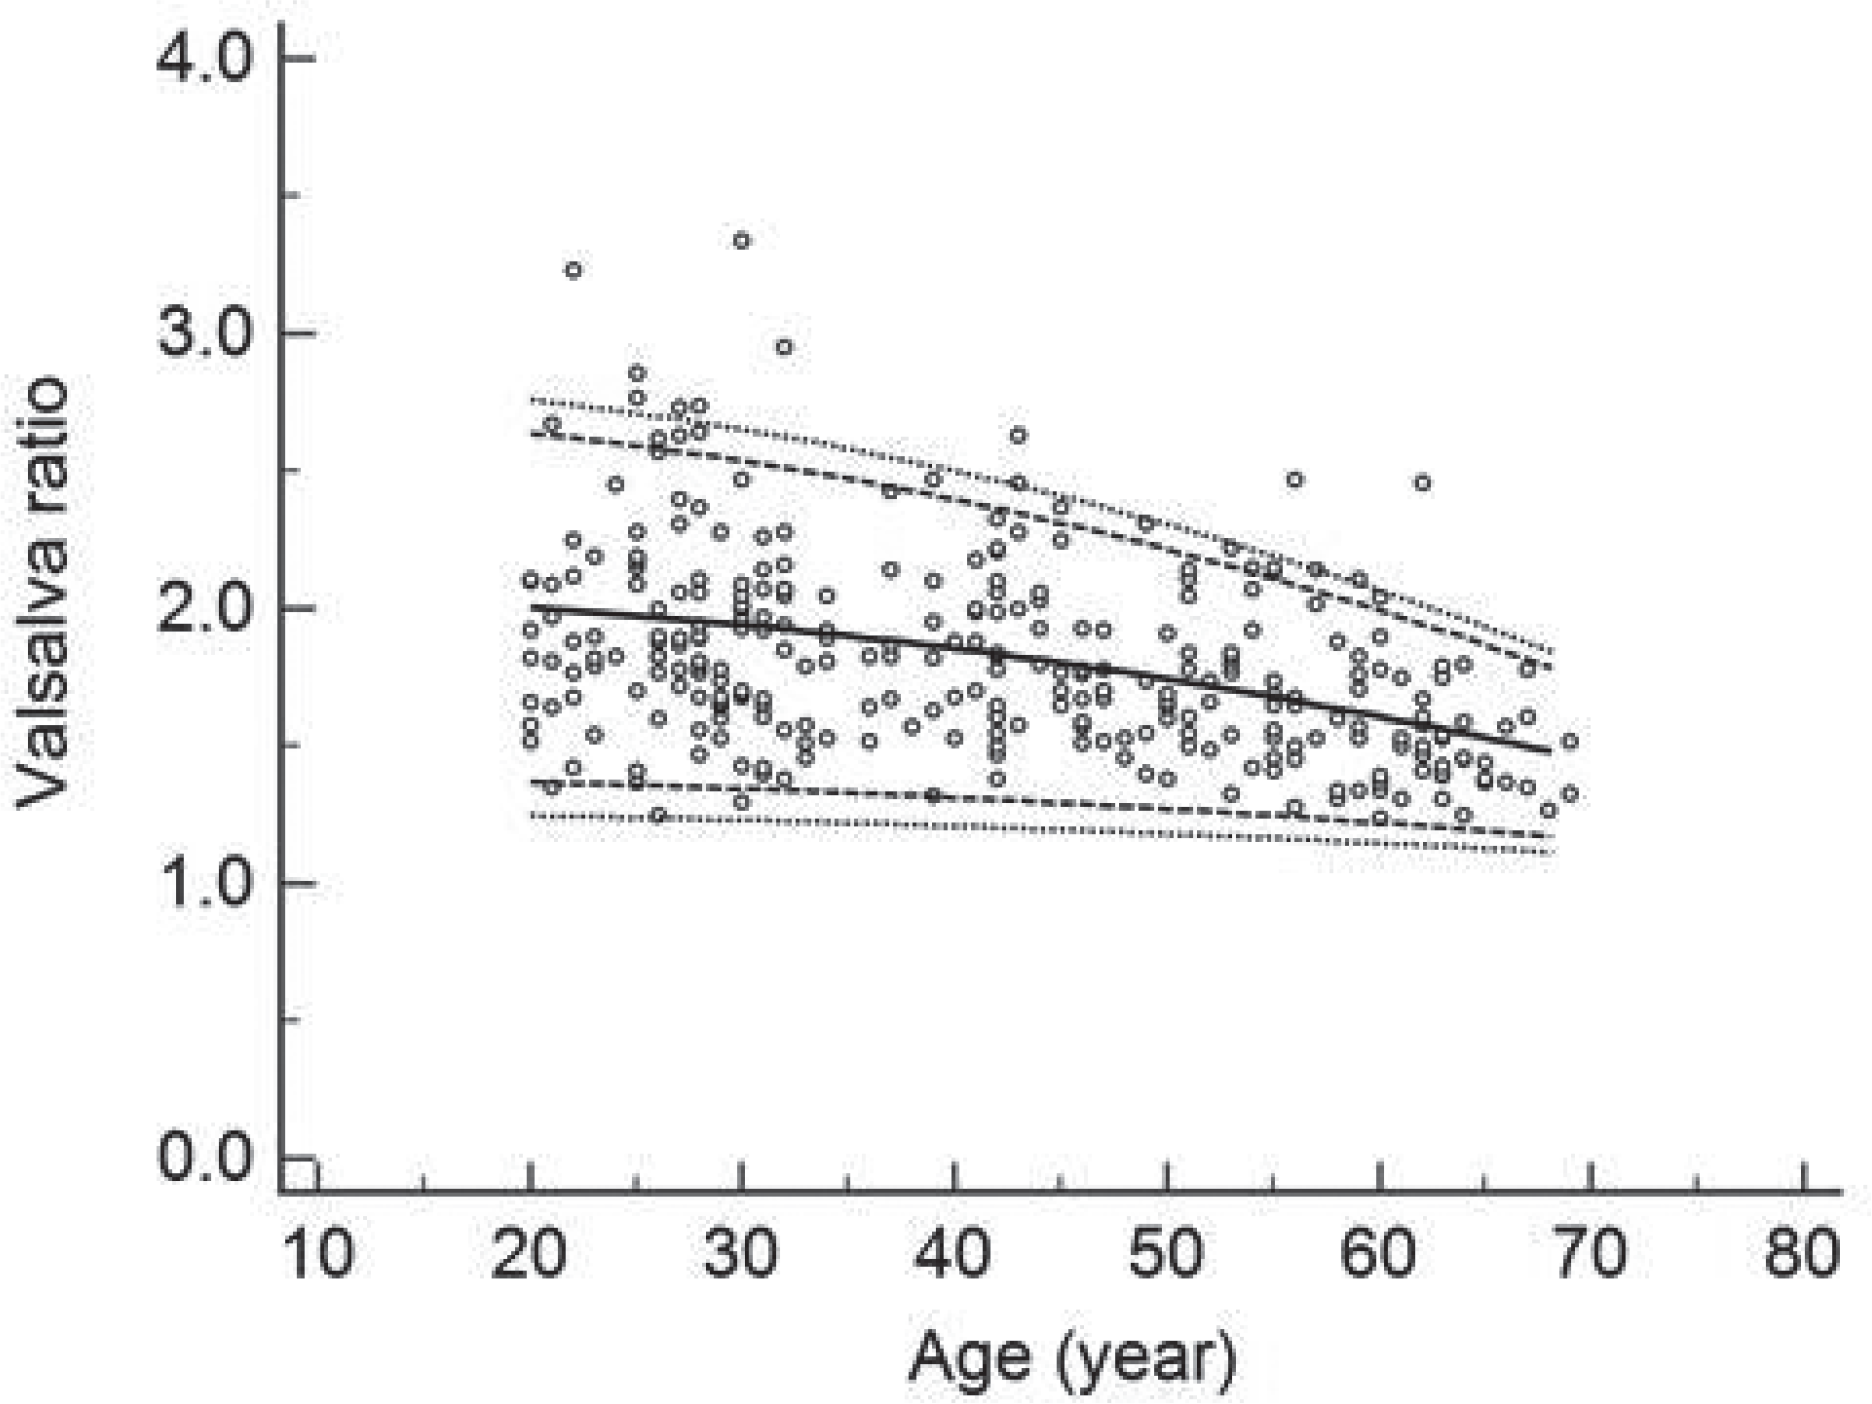
Fig. 3.
Valsalva ratio (VR) as a function of age. The VR was negatively correlated with age. Lines show 2.5th, 5th, 50th, 95th, and 97.5th percentiles.

Table 1.
Demographic characteristics of the participants
Table 2.
Sweat volume in the four tested regions according to sex
Table 3.
Heart-rate response to deep breathing according to age group and sex
Table 4.
Expiration:inspiration ratio according to age group and sex


 PDF
PDF ePub
ePub Citation
 Print
Print


 XML Download