

 PDF
PDF Citation
 Print
Print


INTRODUCTION
The prevalence of food allergy is rising at alarming rates in the Western world [1]. Peanut allergy has increased by 2 fold in the last decade, and prevalence is approximately 2% in the West [23]. Even though the prevalence of peanut allergy in Singapore, a developed South-East Asian country, is relatively low, (estimated to be between 0.47% to 0.64%) [4], there is evidence of an increasing trend [5]. The diagnosis of food allergy is often made by having a clinical history that is consistent with an IgE-mediated reaction, coupled with evidence of sensitization seen in either a positive skin prick test (SPT), or food-specific serum IgE. As food allergies can resolve spontaneously with time, subsequent tolerance is confirmed by performing oral food challenges (OFCs) periodically. Furthermore, incidental food sensitizations with no prior exposures to the specific food are often picked up during evaluations of other more common food allergies, or during evaluation of infantile eczema. Positive SPT or food-specific IgE alone do not make a diagnosis of a food allergy unless ingestion of the food has been clearly linked to allergic symptoms. While OFCs are still regarded as the gold standard, they are time and resource consuming, expensive to conduct, and may cause severe reactions including anaphylaxis. Hence diagnostic tools are needed to better predict the outcomes of OFCs. While component resolved diagnostics and other techniques such as basophil activation tests are now showing some promise in improving our ability to predict reactions, their cost-effectiveness remain to be proven. The SPT, on the other hand, is easy, quick to perform and inexpensive, therefore a valuable first-line procedure for the evaluation of food allergy. Peanut-specific serum IgE concentrations has also been increasingly used in the last two decades. Both in vitro tests have been shown to be predictive of clinical allergy, with skin prick wheal size ≥ 8 mm or peanut-specific serum IgE ≥ 15 kU/L having positive predictive value (PPV) of 90%–95% of reaction during OFC [6]. These may potentially aid in reducing the number of OFCs required. These data and results were derived largely from Western populations and no such data has been published in South-East Asia. This study aims to derive clinically useful decision points to be used for risk stratification of OFC in peanut-sensitized patients. This was done by means of a retrospective chart review of a cohort of peanut sensitized Singaporean children.
MATERIALS AND METHODS
Study design
Patients with a positive SPT to peanut, performed during a 4-year period between 2012 and 2016, were selected for further medical records review. These were identified through our paediatric allergy service's database at KK Women's and Children's Hospital, which is the main tertiary referral allergy centre in Singapore. These patients had SPT performed either due to clinical reactions to peanut or tree nuts, or as part of their workup for other food allergies or eczema. Data such as demographics, personal history of atopy, family history of atopy, other food allergies, concomitant tree nuts allergy, clinical reactions to peanut, SPT and serum IgE results were collected. The first SPT and serum IgE results done at presentation to our centre were used.
Peanut allergy status
The patients were divided into 3 groups, according to their peanut allergy status based on history. The first group (peanut allergic, PA) consisted of patients allergic to peanuts, defined as having a recent immediate reaction to peanut, based on a clinical review by an attending allergist. The second group (peanut tolerant, PT) consisted of patients who were documented to be tolerant to peanuts on regular ingestion, hence their SPT results to peanuts only reflected sensitization without clinical allergy. The SPT in this group were mostly performed as part of evaluation of other food allergies or underlying atopic dermatitis. The third group (peanut sensitized, PS) consisted of patients who were documented to have no known history of peanut ingestion, but with a positive SPT result to peanuts. These patients were either not introduced to peanuts yet, or parents could be avoiding peanuts due to self-perceived fear of possible peanut allergy or avoiding due to other family members having a known peanut allergy. The PS group would not be included in the analysis of predictive decision points as without an OFC performed, their peanut allergy status could not be determined.
SPT and peanut-specific IgE measurements
The skin was prepped with alcohol and peanut extract (Stallergenes Greer, Lenoir, LC, USA) was applied to the skin of the dorsal forearm using a sterile disposable applicator, Duotip-Test (Lincoln Diagnostics, Decatur, IL, USA). Skin tests were performed on the backs of infants and on the forearms of older children. A positive control (histamine) and a negative control solution were also used. SPT wheal size was measured after 15 minutes. The mean diameter recorded was calculated from the average of the 2 largest measurements that were perpendicular to each other. A positive SPT was taken as a wheal size of ≥3 mm. Peanut-specific IgE were measured by using the ImmunoCAP System FEIA (Phadia AB, Uppsala, Sweden).
Statistical analysis
Data were extracted for statistical analysis using SAS ver. 9.4 (SAS Inc., Cary, NC, USA). Baseline demographic and clinical features were compared between PA and PT groups using independent sample t test and chi-square test for continuous and categorical variables, respectively. The association between demographics, atopic history and the measures of SPT wheal size and food-specific IgE concentrations with the risk of peanut allergy were tested using univariate and multivariable logistic regression analysis. Receiver operating characteristic (ROC) analysis was performed to assess the accuracy of the diagnosis tests of SPT and IgE. The sensitivity, specificity, PPV, negative predictive value (NPV), and area under the curve (AUC) were calculated for various cutoff points of SPT wheal size and IgE concentrations using univariate logistic regression approach. Test sensitivity was defined as the proportion of patients with peanut allergy who have a positive test; specificity as the proportion of patients without peanut allergy who have a negative test; PPV as the probability of peanut allergy in a patient with a positive test result; NPV as the probability of not having peanut allergy when the test result is negative; and the AUC as the area under the ROC curve indicating how well the SPT and IgE tests can distinguish between the 2 PA and PT groups. Statistical significance was set at p < 0.05.
RESULTS
There was a total of 654 patients with a positive SPT to peanut, who underwent a full retrospective chart review. Patients with absent or incomplete details of peanut ingestion or exposure were excluded from the study (n = 75). There were 251 PS patients with no known peanut exposure. Most of the PS patients did not have an OFC performed at the time of the chart review as they were being stratified as high risk (based on history or high peanut SPT/IgE results, as assessed by the attending allergist), or their parents declined or they were lost to follow up. The final sample size was 269 patients for the PA group and 59 patients for the PT group.
The demographics and clinical characteristics of the PA and PT groups were shown in Table 1. There was a high prevalence of atopic diseases in both groups, with atopic dermatitis being the most prevalent. Presence of rhinitis as a comorbidity was the only clinical variable which is statistically higher in the PA group compared to the PT group (odds ratio, 2.52; 95% confidence interval [CI], 1.42–4.47) (Table 2).
Table 1
Demographic and clinical characteristics of peanut allergy and peanut tolerant groups
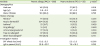
Values are presented as number (%) or mean ± standard deviation.
SPT, skin prick test; IgE, immunoglobulin E.
*Comparing the 2 groups (PA and PT); 2-sided 2 independent sample t test for continuous variables and chi-square/Fisher exact test for categorical variables. †Parental report of patient's history of rhinitis, atopic dermatitis, drug allergy, and urticaria/angioedema. ‡Physician diagnosed asthma. §Clinical diagnosis of tree nut/food allergy based on clinical history and positive SPT/ IgE.
Table 2
Univariate and multivariable analysis of demographics, atopic history and investigation parameters with peanut allergy
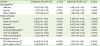
OR, odds ratio; CI, confidence interval; SPT, skin prick test; IgE, immunoglobulin E.
*Odds ratio using univariate logistic regression analysis. †Odds ratio using multivariable logistic regression analysis; adjusted for age and rhinitis. ‡Parental report of patient's history of rhinitis, atopic dermatitis, drug allergy and urticaria/angioedema. §Physician diagnosed asthma. ∥Clinical diagnosis of tree nut/food allergy based on clinical history and positive SPT/IgE. ¶Odds ratio is reported for the risk of SPT ≥3 mm, and serum IgE ≥0.35 kU/L.
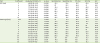
Table 3 showed the diagnostic performance of both the SPT and the peanut-specific IgE test, using various cutoff values. A wheal size of ≥8 mm and a peanut-specific IgE of ≥6 kU/L each provided for a >95% PPV of clinical allergy. A combination of a wheal size of ≥8 mm and a peanut-specific IgE of ≥6 kU/L would increase the PPV of clinical reaction to peanuts from 95% to 100%. The larger the wheal size on SPT, the higher the probability of a clinical reaction to peanuts. The results for area under curve, as generated by ROC analysis, were generally better for the SPT compared to peanut-specific IgE.
Table 3
Diagnostic performance for skin prick test and IgE to peanut, ROC analysis
DISCUSSION
Peanut sensitisation is commonly detected in children with food allergies and eczema [6]. Determining whether these children are peanut allergic or tolerant would require a formal OFC, which can be taxing to a busy practice setting, and carries with it a risk of severe reactions. This is the first study examining the diagnostic performance of SPT and peanut-specific serum IgE concentrations, in predicting clinical reactions to peanut ingestion, in peanut sensitized children in Singapore. There was a statistically higher proportion of patients in the PA group with rhinitis as a comorbidity, when compared to the PT group. Allergic comorbidities had been well-described in children with food allergies [7]. A recent longitudinal, questionnaire-based study of 4,051 Swedish patients reported that children were 3.4 times (95% CI, 2.2–5.3) more likely to develop rhinitis at 8 years old if they were diagnosed with food allergy at the age of one [8].
Our results show that a strongly positive SPT of wheal size ≥8 mm is highly predictive (>95%) of a clinical reaction upon peanut ingestion. This cutoff value will also yield a high specificity (86.4%) but a relatively low sensitivity (61.7%). Thus in the context of a relevant clinical history, the SPT may be used to confirm a diagnosis of a peanut allergy but not to be used to rule out a diagnosis of peanut allergy. Our finding is in agreement with several other prospective studies. Sporik et al. [9] reported that a wheal size of ≥8 mm yielded 100% specificity and such positive SPT results were invariably associated with an adverse reaction during an open food challenge. Two other larger studies by Roberts and Lack [10], Ho et al. [11] and another recent study by Peters et al. [12] (of the HealthNuts study group) similarly reported that a wheal size cutoff of 8 mm offered a 95% PPV with high specificity.
Our finding of peanut-specific IgE of ≥6 kU/L as a decision point is lower than that previously reported [6]. Sampson and Ho reported in 1997 (using 41 double blind placebo controlled peanut challenges) that a peanut-specific IgE cutoff of 15 kU/L would give a 95% PPV [13]. Roberts and Lack [10] reported that using a cutoff of 15 kU/L gave a high PPV of 92% with a specificity of 96%. Other studies suggested cutoff values ranging from 10 to 24 kU/L, to offer similarly high predictive values in excess of 90% [6]. This could be explained by the fact that our study's diagnosis of peanut allergy was only based on clinical history of an allergic reaction, whereas the other studies quoted used OFCs (open or blinded) as the outcome. Selection bias may also account for this difference as the attending allergists were more likely to advise strict peanut avoidance if the peanut-specific IgE was high, resulting in a much smaller number of peanut tolerant patients compared to peanut sensitized patients. It could also be that the peanut-specific IgE threshold was truly lower in Singaporean children compared to international cohorts. Future studies are needed to determine the clinical decision points for children in the Asia-Pacific region.
One of this study's strengths was the large number of patients with a positive SPT to peanuts whom we were able to evaluate. This study provides decision points for the local practicing clinician to use in interpretation of SPT and IgE results during patient consult. They could also provide a basis for selection of peanut-sensitized patients for OFC. The main weakness of this study was that the diagnosis of peanut allergy was not made by the gold standard of a double blind, placebo controlled food challenge. Prospective studies using OFCs to confirm the diagnosis of peanut allergy would be needed to confirm the diagnostic performance of these tests in peanut sensitized children. The other limitation is that we did not include patients with negative SPTs to peanuts, which could make the analysis of the tests' diagnostic capabilities less robust. The role of component resolved diagnostics, especially peanut components have been increasingly recognized. Ara h 2 has been shown to be superior to peanut-specific IgE in diagnosis peanut allergy [14]. Our study was unfortunately limited in the number of Ara h 2 tests performed to allow for a meaningful analysis.
In conclusion, we found that a SPT wheal size ≥8 mm, or a peanut-specific IgE of ≥6 kU/L was highly predictive of clinical reaction to peanut ingestion. Future work required include conducting prospective studies with OFCs in our Asian population to better determine the decision points for SPT and serum IgE.
 XML Download