

 PDF
PDF ePub
ePub Citation
 Print
Print


INTRODUCTION
Colorectal cancer (CRC) is the second leading cause of cancer-related death worldwide as well as in Korea. It is one of the most common cancers and ranks fourth in the frequency of death following lung, stomach, and liver cancer in Korea. About 70% of patients diagnosed with CRC undergo potentially curative surgery, but half of these patients present with or develop advanced local disease or metastases. Recurrent CRC has a poor prognosis with a median survival of only a few months (range, 6–15 months), despite aggressive chemotherapy or surgical resection [1]. In a review of previous studies, patients with advanced CRC continue to have a poor prognosis, despite receiving benefits from adjuvant therapy, with a documented 5-year survival rate of 33% for adjuvant therapy. Therefore, the proper choice of drugs for patients who have undergone curative resection is important, and this consideration led to the concept of the chemosensitivity test (CST) to increase the efficacy of chemotherapy and to predict the prognostic and survival benefits conferred by chemotherapy.
Chemotherapy sensitivity assay refers to any in vitro laboratory analysis that is performed to evaluate whether tumor cell growth is inhibited by conventional chemotherapeutic agents [2]. In the early 1980s, several technology assessments for chemotherapy sensitivity assay were developed, but all posed problems of technical and clinical limitations in their application in clinical practice. During the last 2 decades, a number of newer nonclonogenic assays were developed that seemed to overcome the technical problems associated with older technologies, and of these assays, ATP-based tumor chemosensitivity probably has the best track record for testing native tumor cells derived from nonhematological human malignancies [34]. The ATP-based assay is a sensitive cytometric assay that evaluates tumor cell viability by measuring the intracellular ATP levels of drug-exposed cells [56]. The principle of ATP-based chemotherapy response assay (ATP-CRA) follows the description of ATP as the endpoint of all energy gaining processes in eukaryote cells. After lethal cell damage, APT levels drop to zero within a few milliseconds owing to the hydrolytic activity of intracellular adenosine triphosphatase. Thus, ATP may be regarded as the most sensitive marker for cell viability that can easily be measured by the luciferin-luciferase (Lu-Lu) bioluminescence reaction using the luciferase of various firefly species. Because of its extreme sensitivity, the Lu-Lu bioluminescence reaction is able to determine exactly the cellular ATP content of no more than 10 viable cells.
This assay has several advantages over other cell-based assays, including the ability to accurately differentiate cancer cells and normal cells, a shorter turnaround time (a few days), and greater accuracy than previous CSTs [78]. More specific advantages of this assay are that it provides a highly responsible, easy-to-handle kit technique, low technical failure rate, and a high methodological efficacy requiring only 1 × 10⁶ tumor cells to test 4 to 6 different drugs or combinations. Another important advantage is its suitability for both solid tumor samples and malignant effusions. Furthermore, the ATP-CRA reflects the individual difference of chemosensitivity in the setting of the availability of many newer chemotherapeutic agents since the advent of trials. Several preclinical and clinical studies have described the feasibility of ATP-CRA guided chemotherapy in melanoma, ovarian, breast, stomach, and lung cancer, and reported positive treatment outcomes [910111213]. The different chemosensitivities of CRC patients as determined by ATP-CRA to several anticancer drugs, including 5-fluorouracil (5-FU), oxaliplatin, and irinotecan have been investigated in preclinical studies [1415].
The only clinical study was performed by Hur et al. [16], who concluded ATP-CRA could improve treatment response and resectability in initially unresectable colorectal liver metastasis. In this study, it was found that ATP-CRA guided chemotherapy patients had better treatment responses and a higher rate of hepatic lesion resectability. However, no study has yet evaluated the effect of ATP assay-guided chemotherapy on clinical outcomes in advanced curative CRC treated surgically with adjuvant chemotherapy. According to recent clinical practice guidelines updated by the American Society of Clinical Oncology, the use of in vitro chemotherapy sensitivity and resistance assays to select chemotherapeutic agents for individual patients is recommended in the clinical trial setting only, because insufficient evidence is available to support the use of these assays in clinical practice [17]. Because the in vitro analytic strategies have potential importance, clinical trials designed to evaluate these technologies remain a priority [2]. Therefore, we conducted this study to investigate the clinical usefulness of the ATP assay, with a focus on disease relapse, survival rate, and prognostics variables in patients with stage III CRC who underwent curative resection and were administered chemotherapy postoperatively.
METHODS
Patients
One hundred thirty-six patients with a diagnosis of CRC that underwent curative surgery at Yeungnam University Medical Center between January, 2006 and April, 2014, were included in this study. ATP-CRA was performed on tumor tissue specimens obtained from patients with confirmed CRC. The eligible patients for this study were subjects from whom we had successfully obtained assay results, and who received adjuvant chemotherapy. The other eligibility criteria included a histologically proven colorectal adenocarcinoma, TNM stage III, no other malignancies during follow-up, adequate bone marrow, renal and liver function. When using preoperative radiation, our preferred method is long-course radiotherapy. This clinical trial was approved by the Institutional Review Board of the Yeungnam University Hospital (2016-02-030), and all patients included in the study provided informed consent for their samples to be taken and subjected to ATP-CRA. Patients were divided into sensitive- and resistant-groups (the S- and R-groups) based on the ATP-CRA results.
After cells are damaged and lose viability, intracellular ATP levels drop rapidly. Loss of cell viability after treatment with chemotherapeutic agents results in decreased cellular ATP levels. Thus, ATP levels, measured by the bioluminescence reaction, can show the extent of cell death by the cytotoxic effect of anticancer drugs. Sensitivity was defined as a ≥ 40% reduction in ATP (cell death rate [CDR] ≥ 40%) and resistance as an ATP reduction of < 40% (CDR < 40%) [18]. These 2 groups were further subdivided to produce 4 subgroups: the FOLFOX sensitive subgroup (the FS subgroup [n = 65]), the Mayo sensitive subgroup (the MS subgroup [n = 40]), the FOLFOX resistant subgroup (the FR subgroup [n = 10], and the Mayo resistant subgroup (the MR subgroup [n = 21]).
ATP-CRA methodology
The ATP-CRA methodology is described in detail elsewhere [12]. Briefly, tumor tissues were stored in a Hank balanced salt solution (HBSS, GIBCO BRL, Rockville, MD, USA) containing 100-IU/mL penicillin (Sigma, St Louis, MO, USA), 100-µg/mL streptomycin (Sigma), 100-µg/mL gentamicin (GIBCO BRL), 2.5-µg/mL amphotericin B (GIBCO BRL), and 5% fetal bovine serum (FBS, GIBCO BRL). Specimens underwent 70% ethanol washing and mincing followed by enzymatic disaggregation using dispase (Sigma), pronase (Sigma), and DNase (Sigma) at 37℃ for 12 to 16 hours. Cell suspensions were subjected to ficoll (1.077 g/mL) gradient centrifugation at 400 g for 15 minutes. If enough cells were isolated, blood-derived normal cells were removed using anti-CD45 antibody-conjugated magnetic beads (Miltenyi Biotech, Auburn, CA, USA). Separated tumor cells were then diluted to 5,000–20,000 viable cells/100 µL using IMDM (GIBCO BRL) containing 10% FBS and antibiotics. The cells were then seeded in triplicate to a 96-well ultralow attachment microplate (Costar, Cambridge, MA, USA). The anticancer drug (100 µL) was added to the seeded cells and cultured for 48 hours in a CO2 incubator. Anticancer drugs were dissolved in IMDM and added to each well, providing the final treated drug concentrations as previously reported [1214] Each cell from the untreated control and treated groups was lysed. The ATP in the cell lysate was reacted with luciferin and excess luciferase (Roche, Mannheim, Germany), followed by flash type luminescence measurements on a Victor 3 multilabel counter (PerkinElmer, Boston, MA, USA). The CDRs for each drug were calculated as follows: CDR (%) = (1 − [mean luminescence in treated group/mean luminescence in untreated control group]) × 100.
These luminescence measurements are directly related to the ATP levels and allow an evaluation of the percentage of cell death by reference to the untreated control. The intra-assay mean coefficients of variation were calculated using luminescence values, which were measured 3 times per specimen.
Chemotherapy
The 136 patients with CRC were administered either a FOLFOX or Mayo chemotherapy regimen from 4 weeks after curative resection. The FOLFOX regimen consisted of oxaliplatin 85 mg/m2 and then leucovorin (LV) 400 mg/m2, followed by 5-FU 400 mg/m2 (bolus injection) and 5-FU 1,200 mg/m2 administrated as a 22-hour continuous infusion on day 1 and a 5-FU 1,200 mg/m2 administrated as a 24-hour continuous infusion on day 2. The Mayo regimen consisted of 5-FU 400 mg/m2 and then LV 20 mg/m2 administrated on days 1 through 5. FOLFOX was administrated every 2 weeks, and Mayo every 4 weeks, until evidence of disease progression, the need for reoperation, unacceptable toxicity or patient refusal. All patients received chemotherapy for 6 months. The response was assessed every 6 months using abdominopelvic CT and every 3 months using a tumor marker (CEA). The treatment response was classified using the Response Evaluation Criteria in Solid Tumors [19]. When the patients underwent complete chemotherapy, an abdominal CT was performed for assessment. Periodic follow-up evaluation occurred every 6–12 months.
Analysis of endpoints and statistical considerations
The key study endpoints were the correlations between ATP-CRA results and disease-free survival (DFS) or overall survival (OS). DFS was defined as the time from the commencement of chemotherapy until disease progression or recurrence. OS was defined as the time from chemotherapy to death from all causes. All statistical calculations were carried out using SPSS ver. 11.5 (SPSS Inc., Chicago, IL, USA). All P-values are 2-sided, and statistical significance was accepted for P-values of <0.05. Continuous variables were compared using the Student t-test and categorical variables were analyzed using the χ2 test. Survival was calculated using the Kaplan-Meier method. A log-rank test was used to compare subgroup survivals. Prognostic variables were used in the multivariate analysis by the Cox proportional hazard regression model.
RESULTS
Patient characteristics
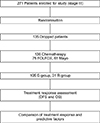
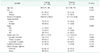
From January 2006 to April 2014, we selected stage III CRC patients with a successful assay result. As a result, 271 patients were initially enrolled in this study, but only 136 patients could participate. The other 135 patients were lost for various reasons including the following: did not receive chemotherapy, received another type of chemotherapy, inadequate follow-up. According to ATP-CRA results, patients were dichotomized into the S- or R-group (Fig. 1). Table 1 shows a detailed comparison of the characteristics of the patients in the S- (n = 105) and R-groups (n = 31) and the characteristics of patients in the FS, MS, FR, and MR subgroups. There were significant differences in tumor location and tumor stage in the S- and R-groups.
Administered chemotherapy and clinical responses
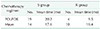
CDRs were determined for each drug regimen. For all 136 study subjects, the mean CDR was 43.3% for Mayo and 57.3% for FOLFOX. FOLFOX patients had a higher CDR than Mayo patients. Seventy-five patients received the FOLFOX regimen (65 in the FS subgroup and 10 in the FR subgroup) and 61 patients received the Mayo regimen (40 in the MS subgroup and 21 in the MR subgroup). Of the 136 patients, 47 patients (34.6%) experienced disease progression. The overall mean time to progression (TTP) was 17.7 months (range, 4–48 months). Mean TTP in the S- and R-groups were 19.1 and 14.4 months, respectively. Mean TTP in the FS and FR subgroups were 20.2 and 9.5 months, and in the MS and MR subgroups were 17.6 and 16.4 months, respectively. TTP according to each regimen are summarized in Table 2. The TTP was greater in the FS and MS subgroups than in the corresponding FR and MR subgroups.
Progression-free survival and OS according to ATP-CRA results
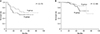
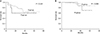
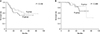
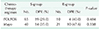
The mean follow-up was 37.5 months after chemotherapy commencement (range, 11–90 months). Of the 136 patients, 47 patients (34.6%) experienced disease progression. The S-group showed better DFS than the R-group (Fig. 2A). Furthermore, the S-group of all patients showed better OS than the R-group (Fig. 2B). Fourteen of the 31 patients (45.2%) in the R-group and 33 of the 105 patients (31.4%) in the S-group experienced disease progression. Four of the 10 patients (40.0%) in the FR subgroup and 19 of the 65 patients (29.0%) in the FS subgroup experienced disease progression. Ten of the 21 patients (47.6%) in the MR subgroup and 14 of the 40 patients (35%) in the MS subgroup experienced disease progression. Table 3 summarizes the chemotherapies administered and disease progression rates (DPRs) by regimen. The DPRs for each regimen were higher in the R-group than in the S-group, and the FS and MS subgroups showed better DFS outcomes than the FR and MR subgroups (Figs. 3A, 4A). The mean OS rate was 90.5% in the S-group and 77.4% in the R-group. The OS in the FS and FR subgroups were 92.3% and 80%, respectively, and the OS in the MS and MR subgroups were 87.5% and 76.2%, respectively (Table 4). Thus, the FS and MS subgroups showed better OS outcomes than the corresponding R-groups (Figs. 3B, 4B). Data on patients in the S-group and R-group showed no significant difference in the univariate analysis for OS rate (hazard ratio [HR], 0.361; 95% confidence interval [CI], 0.124–1.047; P = 0.067). In the same way, DFS rates were not significantly different according to R- vs. S-group in the univariate analysis (HR, 0.557; 95% CI, 0.245–1.262; P = 0.158).
Regarding all S- and R-groups, the 1-year OS rate was 98.1% for the S-group and 84.6% for the R-group while the 1-year DFS rate was 89.5% for the S-group and 64.5% for the R-group. The 1-year OS rates in the FS and FR subgroups were 98.5% and 87.5% while in the MS and MR subgroups, they were 97.4% and 75.7%, respectively. The 1-year DFS rate in the FS and FR subgroups were 87.7% and 60% while in the MS and MR subgroups, they were 77.5% and 51.3%, respectively. These results show that ATP-CRA sensitive patients on both regimens achieved better progression-free survival and OS results than ATP-CRA resistant patients.
Prognostication for progression or survival
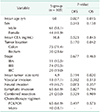
According to univariate analysis, age was significantly associated with good DFS and age, tumor location, and tumor size were significant pretreatment predictors for OS (Table 5). Multivariate analysis identified the following significant prognostic factors in the S-group (Table 6); for DFS age (HR, 1.040; P = 0.032) and for OS age (HR, 1.110; P = 0.010), sex (HR, 0.110; P = 0.018), tumor size (HR, 2.000; P = 0.004), and tumor location (HR, 11.130; P = 0.007).
DISCUSSION
In patients with CRC, the standard adjuvant chemotherapy is a combination therapy based on 5-FU and LV. This approach has been confirmed by long-term, randomized clinical trials, and has been shown to improve DFS and OS rates [20]. However, 2 new chemotherapeutic agents, irinotecan and oxaliplatin, have also demonstrated activity in CRC [2122], and chemotherapies based on combining 5-FU/LV with either irinotecan or oxaliplatin has demonstrated superior response rates (31%–56%) than 5-FU alone (5%) [2324]. However, these high response rates observed for first-line chemotherapy were found to fall dramatically after second-line chemotherapy (15% FOLFOX6 and 4% FOLFIRI) and the survival rates of patients that received the second-line chemotherapy were also quite poor. These findings show chemotherapeutic agents should be chosen carefully because they may have critical effects on prognosis. Furthermore, since it has been well established that histologically identical tumors often differ in terms of response to treatment, many attempts have been made to design in vitro assays that predict in vitro response to chemotherapy. The advantages of a successful assay are improved clinical response, fewer and reduced side effects, and lower toxicity and cost.
From the early 1980s, many different types of in vivo and in vitro CSTs have been developed. Although some of these assay-guided chemotherapies seem near ideal, in general clinical practice these methods are not widely accepted because of various technical problems, including the requirement of a high technical skill, a large number of tumor cells, a long turnaround time for testing, low evaluability rates, primary culture difficulties, fibroblast contamination, the different action mechanism of anticancer drugs, and the use of extremely high concentrations of anticancer agents [3252627]. On the other hand, the ATP-CRA has demonstrated many advantages and can be simply adapted for clinical trials. Of the developed in vitro chemosensitivity assays, the histoculture drug response assay (HDRA), ATP-based CRA, and extreme drug response assay (EDRA) have been recently used in clinical trials of CRC using cell culture-based in vitro assays. Yoon et al. [28] compared chemosensitivity assessed using the HDRA with clinical response to different treatment regimens in patients with advanced CRS. The results obtained showed that HDRA showed a correlation rate with clinical response to chemotherapy of 66.3%, with a sensitivity and specificity of 72.7% and 54.7%, respectively. Mechetner et al. [29] analyzed the EDRA results of CRC specimens and found that primary and metastatic tumors showing EDR to 5-FU with leucovorin exhibited up to 58% cross-resistance to a variety of chemotherapy agents, and the lowest percentages for oxaliplatin (11% and 8%) and irinotecan (16% and 14%). They concluded that the HDRA and EDRA results might be a useful technique to predict chemosensitivity for the selection of therapeutic regimens for advanced or metastatic CRC. But ATP-CRA and methylthiazole tetrazolium assays are commonly used as simple sensitivity tests. Nevertheless, ATP-CRA is now probably the best documented and validated commercially available technology, and provides a highly reproducible, easy-to-handle kit technique with low technical failure rates and a high methodological efficacy as it requires only 1 × 10⁶ tumor cells to test four to 6 different drugs or drug combinations. This assay has not been performed in clinical studies of resectable CRC for survival rates.
In the present study, we evaluate DFS and OS in primary advanced stage III CRC treated by curative resection and with either of 2 adjuvant chemotherapies selected by ATP-CRA. Previous studies in CRC that have involved the use of an in vitro chemosensitive assay produced positive results for treatment response and resectability in unresectable colorectal liver metastasis [1719]. In this previous study, sensitive and resistant patient groups, as defined by ATP-CRA, were found to show different survival (DFS and OS) and clinical response rates after ATP-CRA guided chemotherapy. Furthermore, these clinical outcomes were more favorable in the sensitive-group. Although our study did not produce significantly positive results, as the number of patients tested using the ATP-CRA assay was small and only 2 chemotherapies were administered, the clinical outcomes were more favorable in the chemosensitive group than in the chemoresistant group in terms of DFS and OS for both regimens. Clinical characteristics including chemotherapy were analyzed to evaluate the associated response predictors with DFS and OS. Age did show a statistical significance to be associated with DFS, and age, tumor location, and tumor size were significantly associated with OS in our subgroup analysis. According to our multivariate analysis findings, age was significantly associated with good DFS. Age, sex, tumor size, and tumor location were also prognostic indicators of good OS in the S-group. However, due to data on patients with S-group and R-group showing no significant difference in the univariate analysis for OS rate and DFS rate, we did not measure the multivariate analysis. It also seems difficult to prove the usefulness of ATP-CRA with the results of the subgroup analysis. However, for OS rates, patients in S-group did marginally improve compare with patients in R-group in univariate analysis. Hence, I believe there are indirect grounds supporting the usefulness of ATP-CRA presented herein.
Hence, our results suggest the possibility that higher response rates in the chemotherapy sensitivity assay are associated with higher clinical survival rates in select patients. Thus, the optimization of postoperative regimens to achieve a high probability of a good clinical outcome is critical for increasing survival rates. Patients in our S- and R-groups had similar pretreatment parameters in age, sex, CEA level, combined operative resection, tumor size, and invasion patterns, but significant intergroup differences were observed for tumor location and tumor stage. These results suggest that if selected individually-tailored chemotherapeutic agents using the ATP-CRA assay, even with forms of 5-FU standard chemotherapy, might be as effective as an oxaliplatin combination therapy in regards to efficacy and in predicting the prognosis and survival benefits. In addition, this analysis will facilitate those assays being tested widely in CRC in clinical trials and will provide the optimal treatment opportunity for potential resection candidates of CRC. In order to determine the validity of a diagnostic test in the clinical setting, it is important to determine the predictive value of in vitro testing. In the present study, ATP-CRA showed a positive predictive value (PPV) of 80% and a negative predictive value (NPV) of 33%. The fact that the PPV was higher than the NPV indicates that the assay can detect drug sensitivity better than drug resistance, which is contrary to that found in previous studies that have reported higher NPV than PPV values for other cancers [30]. Although individual drug sensitivity heterogeneity may vary when tumor specimens are tested, complete tumor removal might provide comprehensive chemosensitivity of the malignant tissue. The low NPV of the APT-CRA assay may allow clinicians to avoid resistant drugs as determined by sensitivity testing. Therefore, providing that an in vitro chemosensitivity assay can accurately predict in vivo chemo-responsiveness, it may be suitable for identifying the most effective patient-specific chemotherapy agents.
The limitations of this study are that we did not consider interactions between drugs and individual pharmacokinetic variations, and did not compare the outcomes of survival benefits of ATP-CRA assisted chemotherapy to empirical chemotherapy for CRC. Although it is not possible to make definitive conclusions, we believe there is a good possibility that this chemosensitivity assay may predict the clinical response of chemotherapeutic agents. Our study provides rational results that encourage the development of chemosensitivity assays. First, this is particularly applicable for those advanced stage III CRC patients with poor expected treatment outcomes. Second, the endpoints in this trial include survival and TTP as clinical measures of outcome.
Although it is not statistically significant, the ATP-CRA results and clinical responses were found to be correlated for assay-guided FOLFOX and Mayo chemotherapy in advanced stage III CRC. Our initial experience suggests a possible approach for improving treatment response and survival in patients with stage III CRC using tailored-chemotherapy selected by ATP-CRA. To obtain evidence that the use of ATP-CRA improves outcomes, more accumulated data and interpretable results in a high proportion of patients, comparison to empirical chemotherapy, and results in treatment recommendations that differ from standard clinical algorithms are needed.


 XML Download