

 PDF
PDF ePub
ePub Citation
 Print
Print


INTRODUCTION
Postoperative complications (PCs) after gastrectomy may augment the rates of additional treatment and readmission and lengthen the hospital stay, leading to increased hospital costs, decreased quality of life of patients after surgery, and life-threatening or serious problems [12]. Although enhanced surgical techniques such as laparoscopic or robotic gastrectomy and the improved quality of perioperative nutritional support have led to a decline in the prevalence of PCs, the incidence of PCs has been 46% in recent randomized controlled trials [3456].
Early identification and intensive treatment of PCs are key to improving clinical outcomes. Enhanced recovery after surgery (ERAS) protocols have been applied to increase the quality of life of patients after surgery [7]. Therefore, establishing reliable discharge criteria for early diagnosis of complications during hospitalization, safe discharge, and prevention of rehospitalization is necessary. Recent attempts to predict PCs after gastric cancer surgery using postoperative systemic inflammatory markers suggest that serum CRP levels on postoperative day (POD) 3 or 4 were an early predictor of PCs [289101112]. However, it is unreliable to consider the CRP levels of the specific POD as an early predictor of PCs because changes in serum CRP levels after inflammation may vary individually due to differences in immune response associated with age, sex, race, and nutrient status [13141516]. Furthermore, if the change in postoperative serum CRP levels can be useful as an indicator of the degree of recovery after surgery, which is a planned trauma, the reduction rate from the highest concentration to the normal value over time can be utilized to more effectively reflect the patient's condition, rather than the highest concentration of the specific POD.
To our knowledge, no previous studies have investigated the influence of the reduction in CRP concentration over time on the prediction of PCs. Therefore, this study aimed to investigate the role of the reduction rate of serially measured serum CRP levels, rather than the highest CRP concentration on a given POD, as an early predictor of PCs and a reliable discharge indicator after gastrectomy for gastric cancer.
METHODS
Patient data
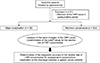
Data on 634 patients with gastric cancer treated by gastrectomy between January 2015 and December 2016 were retrospectively collected. Twenty-one patients were excluded due to the absence of CRP values during the postoperative period. Thus, 613 patients were enrolled (Fig. 1). The following data were collected: age, sex, body mass index (BMI), American Society of Anesthesiologists physical status (ASA PS) classification, comorbidity, surgical variables (surgical approach, type of resection, combined resection, operation time, estimated blood loss), tumor stage according to the third edition of the Japanese Classification of Gastric Carcinoma [17], duration of hospitalization, readmission, PCs according to the Clavien-Dindo classification [1819], and preoperative and postoperative serial CRP concentrations. Patients with PCs of grade II or more were included in the major PCs group (n = 89), and patients with PCs of grade I or without PCs were assigned in the minor/no PCs group (n = 524).
This study was approved by the Institutional Review Board of Pusan National University Yangsan Hospital (IRB No. 05-2017-113).
Perioperative management
All patients were permitted to ingest a normal meal until the day before surgery and received preoperative single antibiotic prophylaxis (1,000-mg cefmetazole intravenously) before skin incision.
The patients began to walk on POD 1 and drank water on POD 2. A clear liquid diet was started on POD 3, and the diet schedule was adjusted to a full liquid and a soft diet daily in three steps (clear liquid-full liquid-soft diet). If the surgeon determined that the amount of oral intake was sufficient and the patient did not feel uncomfortable after the meal, the diet was stepped up. Patients who consumed more than half of the given soft diet for 2 days were recommended for discharge between POD 6 and 7.
In the postoperative period, all patients were examined for the presence of any complication; clinical symptoms, body temperature (≥38℃; fever), herat rate (≥100; tachycardia) were recorded.
Analysis of CRP concentration
Consecutive blood samples for CRP were obtained preoperatively, at the operative day, and on POD 1, 2, 3, 5, and 7. Based on individual measurements, the reduction rate of CRP concentration over time was calculated. For example, R4 was defined as follows (Fig. 2):
The cutoff value for the CRP concentration reduction rate over time was calculated from the occurrence of PCs. The CRP concentrations were measured by the automated AU5800 Chemistry Analyzer using a latex particle immunoturbidimetric method and AU CRP reagents (Beckman Coulter, Inc., Brea, CA, USA). The normal CRP range was defined as <0.5 mg/dL.
Classification of PCs
The following PCs were analyzed: intra-abdominal abscess/fluid collection, anastomotic leakage, pancreatic fistula (defined as amylase content of the excreted body fluid exceeding three times the serum amylase activity) [20], lung complications, duodenal stump leakage, intra-abdominal bleeding, adhesive ileus or intestinal obstruction, urinary tract infection, afferent loop syndrome, and intraluminal bleeding. Data were gathered from medical records such as radiological findings, operative records, and medical files. The severity of PCs was assessed according to the Clavien-Dindo classification system [19]. Complications of grade II or higher were considered as major complications.
Statistical analysis
Student t-test and the chi-square test or Fisher exact test were performed to evaluate differences in continuous and categorical variables, respectively. The change in postoperative serum CRP levels over time was analyzed using a repeated-measures analysis of variance. The significance level of 3 pairwise comparisons at each time point was adjusted by the Bonferroni procedure to account for multiple testing. Diagnostic accuracy was determined by the area under the receiver operating characteristic curve (AUC) [21]. The AUC with Youden's index was used to identify optimal cutoff values. Independent risk factors associated with the prediction of major complications were analyzed using logistic regression analysis. Accordingly, odds ratios (ORs) and 95% confidence intervals (CIs) were estimated. A P-value <0.05 was considered significant in all statistical analyses. All statistical analyses were performed using IBM SPSS Statistics ver. 21.0 (IBM Co., Armonk, NY, USA).
RESULTS
Frequency and analysis of PCs
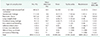
PCs of grade II or higher occurred in 89 of 613 patients (14.5%), with no PCs in excluded patients (0%, 0 of 21); thus, the total incidence of PCs was 14% (89 of 634). Thirty patients developed PCs of grade III requiring surgical, endoscopic, or radiological intervention (4.9%). The frequency and analysis are presented in Table 1. An intra-abdominal abscess/fluid collection was the most frequent complication in 40 patients (6.5%), followed by anastomotic leakage in 11 (1.8%) and pancreatic fistula in 10 (1.6%). The mean detection day of all PCs was 8.56 days after gastrectomy. Among 89 patients with PCs, 41 (sensitivity, 46.1%; mean detection day, 6.16 days) had fever, 31 (sensitivity, 34.8%; mean detection day, 5.71 days) had tachycardia, and 18 (20.2%) were hospitalized again.
Clinicopathologic relationship between the major PCs group and minor/no PCs group
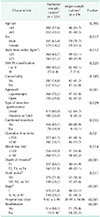
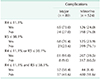
The clinicopathological features of the 2 groups are compared in Table 2. There were no significant differences in clinical characteristics such as age (<65 years vs. ≥65 years), ASA PS classification (I, II vs. III) and comorbidity of patients between both groups, but the major PCs group had a significantly higher proportion of males (P = 0.017), higher BMI (<25 kg/m2 vs. ≥25 kg/m2) (P = 0.012), higher stage (I vs. II, III, IV) (P < 0.001), longer hospital stay (P < 0.001), and higher rate of readmission (P < 0.001). Regarding operative results, an open approach (P = 0.001), proximal or total gastrectomy (P = 0.029), longer operative time (<200 minutes vs. ≥200 minutes) (P = 0.02), and greater blood loss (<100 mL vs. ≥100 mL) (P = 0.014) were associated with major PCs, while combined resection was unrelated (P = 0.233).
Postoperative changes in CRP concentrations
Postoperative changes in CRP concentrations over time are demonstrated in Fig. 2. There were no statistical differences between the 2 goups in the preoperative CRP concentration (P = 0.173; 95% CI, −0.37 to 0.67).
The major PCs group had higher CRP concentrations than the minor/no PCs group during all postoperative periods. A peak CRP concentration was observed on POD 2 in both groups, but a clearly blunted reduction in CRP concentration was later prominent in the major PCs group (P < 0.001).
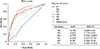
Diagnostic accuracy and cutoffs
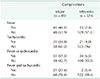
As shown in Fig. 3, the diagnostic accuracy of the CRP concentration reduction rate over time for the occurrence of PCs was determined by the AUC. The reduction rate between POD 3 and 5 (R5) had superior diagnostic accuracy (AUC, 0.822; 95% CI, 0.774–0.87), with an optimal cutoff value of 38.1%. This was followed by the reduction rate between POD 2 and 3 (R4) (AUC, 0.75; 95% CI, 0.721–0.835), with an optimal cutoff value of 11.1%. Table 3 shows the sensitivity and specificity of the cutoff value for the CRP concentration reduction rates (R4, R5). Based on the cutoff value for R5 ≤ 38.1%, the sensitivity was 76.4% (68 of 89 patients with PCs had a reduction rate below the cutoff) and the specificity was 76.1% (399 of 524 patients without PCs had a reduction rate above the cutoff) (Table 3). Using the cutoff value for R4 ≤ 11.1%, the sensitivity was 73% (65 of 89 patients with PCs had a reduction rate below the cutoff) and the specificity was 76% (398 of 524 patients without PCs had a reduction rate above the cutoff) (Table 3).
The relationships between R4 and R5, and fever and tachycardia
Table 4 shows the sensitivity and specificity of fever and tachycardia. Based on the presence of fever, the sensitivity was 46.1% (41 of 89 patients with PCs had fever) and the specificity was 97.1% (509 of 524 patients without PCs had no fever) (Table 4). In the aspects of tachycardia, the sensitivity was 34.8% (31 of 89 patients with PCs had tachycardia) and the specificity was 96% (503 of 524 patients without PCs had no tachycardia) (Table 4).
When both factors were applied simultaneously (fever and tachycardia), the sensitivity was 23.6% (21 of 89 patients with PCs had fever and tachycardia) (Table 4). The sensitivity was 57.3% (51 of 89 patients with PCs) when only one condition was satisfied (fever or tachycardia) (Table 4).
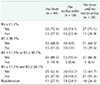
The relationships between R4 and R5, and fever and tachycardia in patients with complications were presented in Table 5. Forty-eight patients (53.9%), 58 (65.2%), and 38 patients (42.7%) out of 89 patients who had major PCs did not have any fever, tachycardia, or fever and tachycardia respectively. Based on the cutoff value for R4 ≤ 11.1%, they showed sensitivity in patients who had no fever, tachycardia, or fever and tachycardia respectively in 35 of 48 (72.9%), 43 of 58 (74.1%), 27 of 38 (71.1%). Using the cutoff value for R5 ≤ 38.1%, the sensitivity was 33 of 48 (68.8%), 40 of 58 (69%), and 23 of 38 (60.5%) in patients who had no fever, tachycardia, or fever and tachycardia respectively. The sensitivity was 43 of 48 (89.6%), 53 of 58 (91.4%), 33 of 38 (86.8%) in patients who had no fever, tachycardia, or fever and tachycardia respectively when only one condition was satisfied (R4 ≤ 11.1% or R5 ≤ 38.1%) (Table 5).
Univariate and multivariate analyses of factors for predicting major complications
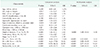
On univariate analysis, the following factors were associated with major complications: male sex, BMI of ≥25 kg/m2, open gastrectomy, proximal or total gastrectomy, operative time of ≥200 min, blood loss of ≥100 mL, deeper depth of invasion (T2 or higher), lymph node metastasis, higher stage (stage II or higher), CRP concentration reduction rate between POD 2 and 3 (R4), CRP concentration reduction rate between POD 3 and 5 (R5), presence of fever, and presence of tachycardia. Among these variables, a deeper depth of invasion (T2 or higher) (OR, 4.58; 95% CI, 1.49–14.12), the CRP concentration reduction rate between POD 2 and 3 (R4) (OR, 4.53; 95% CI, 2.33–8.81), the CRP concentration reduction rate between POD 3 and 5 (R5) (OR, 5.64; 95% CI, 2.89–10.99), presence of fever (OR, 14.64; 95% CI, 6.27–34.22), and presence of tachycardia (OR, 6.59; 95% CI, 2.69–16.12) were independent factors for predicting major complications on multivariate analysis (Table 6).
DISCUSSION
Early detection and intensive treatment of complications after gastrectomy are crucial for improving clinical outcomes. Particularly, complications diagnosed late after discharge may degrade the quality of life and can be life-threatening to patients, a very important concern from the surgeon's point of view [12]. Recently, there has been growing interest in improving the patient's quality of life after surgery, and ERAS protocols are being applied in various fields. These protocols have been actively performed in colon surgery and are currently being used generally [2223]. Even in surgery for gastric cancer, as the incidence of early gastric cancer increases and laparoscopic surgery is widespread, several studies have investigated the applicability of the ERAS protocols [724]. Accordingly, it is necessary to establish reliable discharge criteria for early diagnosis of complications during hospitalization, safe discharge, and prevention of rehospitalization. To date, the discharge criteria for the early recovery program are normal body temperature, no discomfort after meals, normal passage of gas and stool, and acceptance of discharge [724]. However, since these criteria include the subjective aspects of the physician and the patient, a possibility of rehospitalization arises due to overlooked complications. Therefore, having objective monitoring data that can predict complications and evaluate the degree of recovery of patients before discharge is necessary.
Using postoperative systemic inflammatory markers, several studies suggest that serum CRP levels on POD 3 or 4 were an early predictor of PCs [289101112]. Produced in the liver, CRP is a type of acute-phase protein that acts as an inflammatory mediator. Plasma CRP concentrations suddenly increase with increased concentrations of serum amyloid A after an increase in interleukin-6, accompanied by the production of various acute-phase proteins in the liver following trauma or infection. Since CRP is regenerated on a daily basis with a relatively constant half-life and is known as an economic test method that is easily measured and standardized, it can be an appropriate marker of inflammatory response in the body. As surgery is a planned trauma, in clinical practice CRP measurements can reflect the presence and intensity of inflammation in the body; therefore, CRP levels can be used to assess response to treatment and to determine the need for additional therapeutic intervention [2122]. However, since changes in CRP concentrations vary individually according to different immune responses associated with sex, age, race, and nutritional status, it would be inaccurate to use the CRP concentration on a specific day (or its highest level after surgery) to predict PCs and as a discharge criterion [13141516]. Therefore, the reduction rate from the highest value to the normal value of the CRP concentration with respect to time can more effectively reflect the patient's condition than the highest value itself at a specific day after the operation.
Indeed, this study showed a difference in CRP concentration reduction rate between the major PCs group and the minor/no PCs group (Fig. 2). A peak CRP concentration was observed on POD 2 in both groups. These results are reasonable given that the half-life of CRP is 19 hours [25]. After the highest CRP concentration was reached, the major PCs group had a clearly blunted reduction rate. Fig. 3 shows that the CRP concentration reduction rate between POD 3 and 5 (R5) had superior diagnostic accuracy, followed by the reduction rate between POD 2 and 3 (R4). Moreover, as shown in Tables 3, 4, 5, the specificity was 91.6% when both factors were applied (R4 ≤ 11.1% and R5 ≤ 38.1%), and the sensitivity was 91% when only one condition was satisfied (R4 ≤ 11.1% or R5 ≤ 38.1%). These suggest that surgeons can predict up to 91% of the PCs and judge the health recovery of patients without PCs up to 91.6% within 5 PODs. For example, a CRP concentration reduction rate ≤ 11.1% between POD 2 and 3 cautions the surgeons about the occurrence of complications. Such findings should be considered when clinical signs such as fever and tachycardia are observed. If necessary, the surgeons can perform subsequent clinical searches and therapeutic trials, including additional blood tests and early use of preemptive antibiotics. Meanwhile, if the CRP concentration reduction rate between POD 3 and 5 is ≤38.1%, intensive diagnostic tools such as endoscopy, upper gastrointestinal series, or computed tomography scans should be checked. Thus, potential PCs can be predicted up to 91% within 5 PODs if the tests are positively conducted. Conversely, patients would recover normally without PCs and early safe discharge is possible after POD 5 if the CRP concentration reduction rate between POD 2 and 3 is >11.1% and that between POD 3 and 5 is >38.1%. These results are clinically important for early additional treatment and better surgical outcomes, especially when considering the mean detection day of all PCs (8.56 days), presence of fever (41 of 89; sensitivity, 46%; mean detection day, 6.16 days), presence of tachycardia (31 of 89; sensitivity, 34.8%; mean detection day, 5.71 days), and readmission rate (18 of 89 [20.2%]) found in this study (Table 1). Although fever and tachycardia are markers of inflammatory response, surgery induces a high systemic inflammatory response, so these markers can be less related to the presence or absence of complications until early postoperative period [212627]. In this study, Tables 3, 4, 5 present the relationships between R4 and R5, and fever and tachycardia in patients with PCs. Forty-eight patients (53.9%), 58 (65.2%), and 38 patients out of 89 patients (42.7%) who had major PCs did not have any fever, tachycardia, or fever and tachycardia respectively. Tables 1 and 3, 4, 5 show that the diagnosis of complications may be delayed or missed if surgeons depends only on these markers. Moreover, in recent studies about ERAS protocols, with target day of discharge between POD 5 and 6, the prediction of PCs within 5 PODs can have a more significant value [72224], as emphasized in Table 1.
These results imply that the reduction rate from the highest concentration to the normal value over time can be useful not only as an early predictor of PCs but also as a reliable discharge indicator during the early postoperative recovery phase, before PCs lead to adverse effects such as additional therapeutic intervention, readmission, and long-term hospitalization.
In conclusion, we investigated the role of the reduction rate of serially measured serum CRP concentrations after gastrectomy, as an early predictor of PCs and a reliable discharge indicator. The CRP concentration reduction rates between POD 3 and 5 and between POD 2 and 3 were the best combination factors to predict PCs and to indicate a safe discharge from hospital after gastrectomy for gastric cancer.

 XML Download