

 PDF
PDF ePub
ePub Citation
 Print
Print


INTRODUCTION
Kawasaki disease (KD) is an acute febrile illness of unknown etiology characterized by systemic inflammation involving small- and medium-sized arteries.1)2) Cardiac sequelae are more frequent and morbidity is higher in infants who present with KD in the first year of life (particularly those <6 months of age) than non-infants with KD.3) Incomplete KD (iKD) is more frequently diagnosed in very young children, and the duration of hospitalization is significantly longer in iKD.4)
Incidence and immunological variability differ according to age and may contribute to the differential pathophysiology of KD.5) However, the specific differences in laboratory values in infants (aged 0–12 months) with KD have not been compared with those in non-infants (age>12 months) with KD.
It is important to promptly distinguish infants with iKD features from those with other febrile illnesses, as they require early treatment to prevent coronary artery complications of KD. It is also important to differentiate the unique characteristics of infants with KD from those in non-infants with KD, as immunologic variability differs between infants and non-infants. Therefore, the objective of this study was to assess age-adjusted Z-values (Z) of white and red blood cells (WBCs and RBCs) in patients with KD and to compare Z in infants with KD with those in febrile controls (FCs) and non-infants with KD. The results of this study may serve as a basis for better understanding of the pathogenesis of iKD in infants.
METHODS
We retrospectively investigated children diagnosed with KD by reviewing medical records and echocardiographic and laboratory data between 2003 and 2015 at the Korea University Hospital. This study enrolled 192 infants with KD and 667 non-infants with KD. Infants were defined as aged 0–12 months and non-infants were defined as aged>12 months. Of 192 infants with KD, 131 and 61 had complete and iKD, respectively. Of 667 non-infants with KD, 518 and 149, respectively, had complete and iKD.
The acute phase is characterized by fever and the other acute signs of illness, and the subacute phase is associated with desquamation, thrombocytosis generally lasts 3 weeks. The convalescent phase begins when all clinical signs of illness have disappeared and continues until the erythrocyte sedimentation rate (ESR) returns to normal, typically about 6–8 weeks after onset of illness.6) Our study re-defined the 3 clinical phase on the basis of the previous definition in order to blood collection and follow-up. The acute phase of KD is defined as the febrile period before intravenous immunoglobulin (IVIG) administration (pre-IVIG phase), the subacute phase as the afebrile period 2 days after IVIG administration (post-IVIG phase), and the chronic phase as 3 to 4 weeks after the KD event. IVIG resistance was defined as a temperature of 38.0°C or higher between 36 hours and 7 days after completion of the IVIG infusion without another likely source.7)
Complete KD and iKD patients were selected and inclusion criteria were supported by symptoms and increased inflammatory indices.8) In this study, the authors did not include C-reactive protein (CRP) in the diagnostic critieria. If the patient had 1out of 5 KD symptoms and the fever duration more than 5 days, this group was classified as FC group. In addition, if the patient had 2 or 3 out of 5 KD symptoms and the fever duration more than 5 days, this group was classified as iKD group. The diagnosis of complete KD is based on the presence of 5 days of fever and 4 or 5 of the 5 principal clinical features. We enrolled both infants and non-infants with complete and iKD because the statistical differences in laboratory findings between complete and iKD were not significant for all variables (data not shown). The laboratory findings in infants with KD were compared with those in a FC group and non-infants with KD.
We analyzed WBC and RBC counts in infants and non-infants with KD to obtain both age-unadjusted raw values (R) and age-adjusted Z. Simple and age-adjusted comparisons between infants and non-infants were represented as R and Z, respectively. The neutrophil:lymphocyte ratio (NLR) and the neutrophil:eosinophil ratio (NER) were calculated from normal neutrophil, lymphocyte, and eosinophil counts for each age group.
 Equation (1)
Z can correct for age-related biases according to chronological age. SD is needed to calculate the Z and the SD is simply derived from the range rule formula.
 Equation (2)
Previous reports showed mean, maximum, and minimum values for normal WBCs and RBCs according to age.9)10)11)12) We calculated new mean and SD values for each age based on equation 2, with Z calculated from equation 1.
R and Z between infants and non-infants with KD during the pre-IVIG, post-IVIG, and chronic phases were compared.
We measured coronary artery size using echocardiography and classified size according to the Z-score guidelines for coronary artery abnormalities as described by the American Heart Association and the equations of coronary artery Z-score.7)13)
Patients were classified into a group with a normal coronary artery (NCA) Z-score<2.0 and a group with an NCA Z-score≥2.5, with the presence of dilatation and/or aneurysms. The Z-scores between 2 and 2.5 were reclassified according to changes in Z-scores in the follow-up ultrasonography. We did not differentiate a coronary aneurysm from coronary dilatation; these were combined into a single group of coronary artery lesions (CAL) because the number of aneurysms was very low. Coronary Z-scores are shown as maximum values for all KD phases.
The FC group in this study was defined as patients with at least 5 days of fever, rash, and cervical lymphadenopathy, similar to those with true KD. The FC group had more than 5 days of fever and a nonspecific macular-papular erythematous rash which is similar to KD, or at least one impaired lymph node regardless of the LN size (cervical lymphadenopathy in KD≥15 mm in diameter should be involved). Therefore, The FC group has 1 symptom (rash or cervical lymphadenopathy) among 5 symptoms of KD and at least 5 days of fever. If the patients had more than 2 symptoms simultaneously among 5 symptoms of KD, they were classified as atypical KD. The FC group included diseases such as palatine tonsillitis, pharyngoconjunctival fever, erythema multiforme, pneumonia, scarlet fever, and infectious monocytosis. This retrospective study was approved by the Institutional Review Board (IRB) of Korea University Guro Hospital (IRB No. KUGH10229) with waiver of informed consent.
Statistical analysis
Statistical analyses were performed using SPSS v.20 software (SPSS Inc., Chicago, IL, USA). Data were expressed as the median Q2 value (25th percentile Q1 and 75th percentile Q3). Continuous variables were compared using the Mann-Whitney U-test to estimate the significance of incidence. Categorical variables were compared using Pearson's χ2 test. The values in infants and non-infants or among acute, subacute, and convalescent phases were compared using a nonparametric test (Mann-Whitney U-test). The p<0.05 was considered statistically significant.
RESULTS
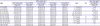
The new mean and SD values for each age were calculated using equation 2 and the Z were calculated using equation 1 (Table 1).
Table 1
Means and SDs of white cell counts with differential and red cell counts according to ages
![]()
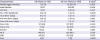
The incidence of iKD in KD infants was higher than that in KD non-infants (318/1,000 infants had iKD and 223/1,000 non-infants had iKD, p<0.001). There were no statistical differences between infants and non-infants in the number of IVIG treatments, sex, coronary artery abnormalities, and fever duration (total, pre-IVIG, and post-IVIG; Tables 2 and 3).
Table 2
Demographic characteristics of KD compared with FC in infants and non-infants

All data are expressed as medians with interquartile ranges.
FC = febrile control; KD = Kawasaki disease.
*Mann-Whitney U or Pearson's χ2 test was used.
![]()
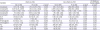
Table 3
Demographic and clinical characteristics of KD infants compared with KD non-infants
All data are expressed as medians with interquartile ranges or number (%).
CAA = coronary artery aneurysm; CAD = coronary artery dilatation; cKD = complete Kawasaki disease; FC = febrile control; iKD = incomplete Kawasaki disease; IVIG = intravenous immunoglobulin; KD = Kawasaki diseaseNCA = normal coronary artery.
*Mann-Whitney U or Pearson's χ2 test was used.
![]()
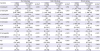
The relationships between total fever duration and conditions of coronary artery in KD infants and KD non-infants represented (Tables 4 and 5).
Table 4
The differences of total fever between KD infants and KD non-infants according to conditions of coronary artery

All data are expressed as medians with interquartile ranges.
CAA = coronary artery aneurysm; CAD = coronary artery dilatation; KD = Kawasaki disease; NCA = normal coronary artery.
*Mann-Whitney U test was used.
![]()
Table 5
The differences of total fever among conditions of coronary artery according to KD infants and KD non-infants

All data are expressed as medians with interquartile ranges.
CAA = coronary artery aneurysm; CAD = coronary artery dilatation; KD = Kawasaki disease; NCA = normal coronary artery.
*Mann-Whitney U test was used.
![]()
R- and Z-leukocyte, R- and Z-neutrophil, Z-eosinophil, NLR, Z-hemoglobin, and platelet counts showed significant differences between infants in the KD and FC groups (p<0.05). R- and Z-leukocyte, R- and Z-neutrophil, R- and Z-eosinophil, NLR, NLR, R- and Z-hemoglobin, and platelet counts showed significant differences between non-infants in the KD and FC groups (p<0.05) Comparison of the FC groups revealed that unadjusted R-lymphocyte, R-eosinophil, and R-hemoglobin values showed significant differences between infants and non-infants (p<0.001, p=0.002, and p=0.021 respectively). However, no age-adjusted WBC and RBC Z showed significant differences between infants and non-infants in the FC groups. Only NLR and NER showed significant differences between infants and non-infants in the FC groups (p=0.002 and 0.004; Table 6).
Table 6
Usefulness and comparison of Z in infants and non-infants with KD compared with FC groups in pre-IVIG phase
All data are expressed as medians with interquartile ranges.
CRP = C-reactive protein; ESR = erythrocyte sedimentation rate; FC = febrile control; IVIG = intravenous immunoglobulin; KD = Kawasaki disease; NER = neutrophil:eosinophil ratio; NLR = neutrophil:lymphocyte ratio; PLT = platelets; R = raw value; Z = Z-values.
*Mann-Whitney U test was used; †The fact that there is no Z-score difference between FC infants and FC non-infants as control groups reflects that the age-based bias were corrected, and the Z can be a standard parameter which can compare between difference age groups.
![]()
During the pre-IVIG phase as the febrile period before IVIG administration, Z-leukocyte, R- and Z-neutrophil, R- and Z-lymphocyte, R- and Z-eosinophil, R-monocyte, NLR, NER, R- and Z-hemoglobin, and platelet counts showed significant differences between infants and non-infants with KD (p<0.05). During the post-IVIG phase as the afebrile period 2 days after IVIG administration, R-leukocyte, R- and Z-neutrophil, R-lymphocyte, R- and Z-eosinophil, R-monocyte, NLR, NER, R- and Z-hemoglobin, and platelet counts showed significant differences between infants and non-infants with KD (p<0.05). During the chronic phase as 3 to 4 weeks after the KD event, R- and Z-leukocyte, R- and Z-neutrophil, R-lymphocyte, R- and Z-eosinophil, NLR, NER, R-monocyte, R- and Z-hemoglobin, and platelet counts were significantly different between infants and non-infants with KD (p<0.05; Table 7).
Table 7
Laboratory characteristics of KD infants compared with KD non-infants in pre-IVIG, post-IVIG, and chronic phases
All data are expressed as medians with interquartile ranges.
CRP = C-reactive protein; ESR = erythrocyte sedimentation rate; FC = febrile control; KD = Kawasaki disease; NER = neutrophil:eosinophil ratio; NLR = neutrophil:lymphocyte ratio; PLT = platelets; R = raw value; Z = Z-value.
*Mann-Whitney U test was used.
![]()
Receiver operating characteristic curve analysis was performed to predict the probability of diagnosis of true KD by calculating the optimal cut-off values for all complete KD. The optimal cut-off value of pre-IVIG Z-hemoglobin for differentiating complete KD patients (infants plus non-infants) from the FC patients was -0.01 (area under the curve [AUC], 0.914; sensitivity/specificity, 0.999/0.886; p=0.043). The optimal cut-off value of pre-IVIG CRP for differentiating complete KD infants from FC infants was 40 mg/L (AUC, 0.811; sensitivity/specificity, 0.712/0.700; p=0.045; Table 8).
Table 8
Optimal cutoff of laboratory values for predicting the probability of KD

AUC = area under the curve; CI = confidence interval; CRP = C-reactive protein; FC = febrile control; KD = Kawasaki disease; IVIG = intravenous immunoglobulin; Z = Z-values.
![]()
DISCUSSION
It is well known that KD in infants leads to a an increased likelihood of coronary artery dilation due to a higher incidence of atypical or incomplete presentations.4) However, a previous study revealed that younger children who were treated appropriately did not have a higher CAL.14) Our results showed that the incidence of iKD was significantly higher in infants than in non-infants (32% vs. 22%, p<0.001), but the rate of coronary artery complications was not significantly different between infants and non-infants with KD. Start of treatment in infants was not delayed compared to that in non-infants; there were no significant differences in the pre-IVIG fever duration between infant and non-infant KD groups. Therefore, early or non-delayed treatment in infants with KD did not increase the risk of coronary artery complications, although the clinical characteristics of infants with KD were incomplete or atypical.
The normal RBC and WBC differential counts according to chronological age are well known and have been reported as mean, maximum, and minimum values.9)10)11)12) If the cell counts in infants and non-infants are simply compared, age biases will be included in the statistical comparison. Therefore, we adopted the age-adjusted Z for all WBC and RBC counts to eliminate age bias. Laboratory cell counts were analyzed in infants and non-infants with KD using not only age-unadjusted R but also age-adjusted Z. These values are important to determine according to chronological age although they do not translate across all ethnicities and different lab machines. We did not adopt Z for platelets or other inflammatory markers such as CRP or the ESR because they did not show any significant age-specific differences.
The true increase and decrease in blood cells can be confirmed with Z. The comparisons of unadjusted R in the FC group showed significant differences in the R-lymphocyte, R-eosinophil, and R-hemoglobin levels between infants and non-infants, with a significant difference between the 2 FC groups. However, these did not show any differences in Z. The fact that there is no Z-score difference between FC infants and FC non-infants in simple febrile disease group other than KD reflects the fact that the age-based bias corrected in the simple febrile group. The Z-scores between KD non-infants and FC non-infants also showed significant differences and the difference of Z-score is not the characteristic of the KD infants alone but the characteristic of the whole KD patients compared with the FC groups. Moreover, most R-values might be misinterpreted as increase in cell counts, particularly during the post-IVIG phase of KD, but actual Z showed decreases in cell counts. Therefore, the Z may be considered a standard parameter for understanding changes in cell counts specific to chronological age.
Laboratory abnormalities in KD include leukocytosis, anemia, thrombocytosis, high alanine aminotransferase, and hypoalbuminemia.15) Our findings are in line with the results of previous studies, as R and Z in both infants and non-infants with KD showed leukocytosis, neutrophilia, eosinophilia, anemia, thrombocytosis, and increased CRP and ESR compared with those in infants and non-infants in FC groups.
Laboratory features of infants with KD based on Z during pre-IVIG, post-IVIG, and chronic phases include greater eosinophilia, lower NLR, lower NER, worse anemia, greater thrombocytosis, and lower ESR compared with those in non-infants with KD. The laboratory features of infants with KD during the pre-IVIG phase show less leukocytosis and neutrophilia, and greater monocytosis; features during the post-IVIG phase include less neutropenia, and those during the chronic phase include greater leukopenia and less monocytosis compared to those in non-infants with KD.
The underlying pathogenic features of KD consist of the generalized immune activation of T and B lymphocytes and monocytes/macrophages.2) The peripheral B and T lymphocytes are activated in KD during the acute phase compared with those in control subjects,16) but differential changes in lymphocyte counts among infants and non-infants have not been described. We speculate that the immunologic reactions of lymphocytes in infants are less active than in non-infants, although more detailed investigations are necessary.
Tumor necrosis factor-α and interleukin-6 activities are more evident in KD patients with CAL and a decrease in the number of monocytes/macrophages after IVIG therapy has been reported.16) We showed more pronounced monocytosis during the pre-IVIG phase and a lower degree of monocytosis during the chronic phase after IVIG therapy. Therefore, the immunological effects of monocytes in infants with KD may differ in CAL and IVIG responsiveness compared to those in non-infants.
Eosinophil accumulation in the blood is a hallmark of several important disorders, including allergic reactions and various forms of systemic vasculitis.17) Unexplained eosinophilia may be a helpful indicator in the presence of clinical findings suggestive of KD, as eosinophil levels in the acute stage were reportedly higher than in a control group before IVIG treatment.18) The mechanisms involved in peripheral blood eosinophilia in KD patients remain unclear, but eosinophilia may be associated with the host immune response.19) Our results show that R- and Z-eosinophils in infants with KD were significantly increased compared with those in non-infants with KD in all phases. It remains clear whether eosinophilia in infants and non-infants with KD has a beneficial or harmful effect on pathogenesis.
Anemia is one of the most common clinical features of KD, and hepcidin-induced iron deficiency and transient hyposideremia have been associated with anemia.20) A decrease in age-adjusted Z-hemoglobin is an independent predictor of IVIG resistance and the development of coronary artery aneurysms.21) Our results showed that Z-hemoglobin in infants with KD across all chronological phases was significantly lower than in non-infants with KD but the actual incidence between infants and non-infants was not different (Tables 2 and 3). Therefore, the risks of CAL in infants with KD should investigate further based on age-adjusted Z-hemoglobin.
Thrombocytosis in KD is a risk factor for coronary artery complications.22) Our results demonstrated that thrombocytosis values in the post-IVIG phase in infants with KD were significantly higher than in non-infants with KD. Therefore, the risk of CAL in infants with KD may be higher than in non-infants with KD during the post-IVIG phase with regard to thrombocytosis.
A high ESR is associated with non-resolution of CAL.23) Our results suggested that the ESR values in infants with KD were lower in all chronologic phases compared with those in non-infants with KD. Therefore, the risks of CAL in infants with KD may be lower than those in non-infants with KD with regard to ESR.
It is well known that enhanced neutrophil count and function in KD can induce CAL via neutrophil overproduction.24)25) Our results indicated that neutrophil counts in infants with KD during the pre-IVIG phase were moderately increased compared with those in non-infants with KD. Therefore, the risks of CAL in infants with KD may be lower than those in non-infants with KD during the pre-IVIG phase with regard to neutrophils levels.
Age-adjusted Z in infants and non-infants were compared across pre-IVIG, post-IVIG and chronic phases of KD. A previous study revealed that platelet counts and ESR were highest during the post-IVIG phase and the age-adjusted Z-hemoglobin level was at its lowest over the 2–10 days of the episode.26) These findings are in accordance with our results, as post-IVIG ESR and post-IVIG platelet counts were highest, while post-IVIG Z-hemoglobin was lowest, in both infants and non-infants with KD. Previous reports indicated that low Z-hemoglobin, thrombocytosis, and higher ESR in KD can be risk factors for CAL, not only during the acute phase of KD, in which inflammation is in progress, but also during the subacute phase, resulting in a higher risk of CAL in both infants and non-infants with KD.19)20)21) Thus, thrombocytosis, higher ESR, and reduced Z-hemoglobin should be carefully monitored for a considerable period of time.
Another characteristic of Z in the differentiation between infants and non-infants with KD is the chronological change in Z-eosinophil levels. Z-eosinophils in infants with KD showed significantly greater increases than in non-infants with KD during each chronological phase, and levels peaked in the post-IVIG phases in both infants and non-infants. However, Z-eosinophils in infants with KD indicated persistent eosinophilia while in non-infants with KD, either eosinopenia or eosinophilia were observed. Whether the eosinophilia in infants with KD has a beneficial or harmful effect on pathogenesis should be investigated further.
Early diagnosis is important in infants as KD is frequently associated with an atypical clinical presentation and an increased risk of CAL.4) Laboratory values able to predict KD in this study were pre-IVIG Z-hemoglobin in the overall KD group and pre-IVIG CRP in infants with KD. The probability of KD is greater in the presence of a febrile illness with atypical presentation, with pre-IVIG Z-hemoglobin ≤0, or a pre-IVIG CRP level ≥40 mg/L if the patient is an infant.
A limitation of this study is the imprecise definition of Z, since these laboratory parameters vary with age, especially during the first year of life. Therefore, we maximally subdivided the means and SDs according to chronological ages in Korean and other ethnic populations because the normal ranges of WBCs and RBCs in the Korean population are known. Nevertheless, Z are important to compare between infants and non-infants with KD.
In conclusion, non-delayed treatment in infants with KD may not increase the risk of coronary artery complications. The age-adjusted Z may represent a standard parameter for use in better understanding of changes in blood cell counts according to chronological age. Common characteristics of infants with KD during pre-IVIG, post-IVIG, and chronic phases include greater lymphopenia and eosinophilia, lower NLR and NER, worse anemia, greater thrombocytosis, and reduced ESR, compared to those in non-infants with KD. The risks of CAL in infants with KD compared to those in non-infants with KD may be higher throughout all phases with regard to Z-hemoglobin and may be higher during the post-IVIG phase in terms of thrombocytosis. Conversely, the risk of CAL in infants with KD may be lower than in non-infants with KD due to reduced neutrophil counts and ESR. Thrombocytosis, high ESR, and reduced Z-hemoglobin should be monitored carefully to determine the risk of CAL. Infants with iKD may be more easily differentiated from those with simple febrile illness through the evaluation of Z-hemoglobin and CRP.
 XML Download