

 PDF
PDF Citation
 Print
Print


INTRODUCTION
Pulmonary hypertension (PH) is defined as increased pulmonary blood pressure [1]. The gold standard for pulmonary artery pressure measurement is right heart catheterization. However, this technique is invasive and requires general anesthesia, which is unacceptable for most owners and compromised patients [2]. Therefore, the diagnosis of PH in a veterinary clinic relies mainly on Doppler echocardiographic estimated pulmonary arterial systolic and diastolic pressure derived from the tricuspid regurgitation (TR) pressure gradient (TRPG) and pulmonary regurgitation (PR) pressure gradient, respectively [3]. A TRPG ≥ 36 mmHg is indicative of PH. In dogs with myxomatous mitral valve degeneration (MMVD), a TRPG ≥ 50 mmHg predicts a poor outcome [4]. When TR and PR are absent or unavailable, diagnosis of PH relies on echocardiographic findings, thoracic radiography, and clinical signs [5].
Other PH-related echocardiographic indices include pulsed-wave Doppler-derived acceleration time to peak pulmonary artery (PA) flow velocity (AT) indexed to the ejection time (ET) of PA flow (AT/ET) and the anterior “dicrotic notch” displayed in the M-mode right pulmonary artery (RPA) tracing (RPAnotch). The right ventricular Tei index and tricuspid annular plane systolic excursion, which are indices of right ventricular function, have also been used to evaluate the severity of PH in humans and animals [26]. Unfortunately, these indices are limited by alignment and technical difficulties, and are difficult to obtain in dogs with respiratory conditions [7].
The characteristics of the PA are related to PH severity, and serve as noninvasive indices of PH in humans because they are quantifiable by echocardiography, computed tomography angiography, and magnetic resonance imaging [89]. These indices are reliable early indicators of PH and predict mortality and response to medication in humans [10111213].
The right pulmonary artery distensibility (RPAD) index correlates strongly with non-invasive and invasive PA pressure measurements in dogs with PH secondary to heartworm infection [5]; its predictive ability has also been demonstrated in PH caused by other diseases, such as MMVD and right-to-left or left-to-right patent ductus arteriosus [7]. The advantage of the RPAD index is that it is easily acquired, not technically difficult to derive, and measurable in the absence of TR or PR [27]. However, there is no radiographic evidence of its correlation with clinical signs.
This study aimed to investigate the clinical value of the RPAD index in dogs with varying degrees of PH, including its correlation with clinical assessments, diagnostic power, and prognostic value.
MATERIALS AND METHODS
Study population
The study was approved by the Institutional Animal Care and Use Committee of National Chung Hsing University, Taiwan. The medical records of client-owned dogs presented to the veterinary cardiology service at National Chung Hsing University between December 2014 and May 2016 were retrospectively reviewed. Dogs with a diagnosis of PH attributable to MMVD, heartworm disease (HWD), or chronic respiratory disease (CRD) were included. Dogs without clinical signs and insignificant findings on echocardiography performed during an annual health check or for cardiac evaluation before teeth scaling or sterilization were included as controls. The dogs were divided in four groups according to the TRPG value (<36 mmHg, 36–50 mmHg, 51–75 mmHg, or >75 mmHg) [13]. The dogs were also divided according to their diagnoses into a control group, MMVD group, CRD group, and HWD group. Dogs with arrhythmia other than respiratory sinus arrhythmia and those with cardiomyopathy, infective endocarditis, congenital cardiac disease, pericardial effusion, non-cardiogenic pleural effusion, severe systemic disease, unclear history or medical records, a combination of severe cardiac diseases (e.g., HWD and severe MMVD), dehydration, or no RPA measurements were excluded.
Clinical findings
The medical records of eligible dogs were reviewed, and their characteristics, medical history, and clinical findings were recorded. A clinical score (CS) was calculated as in a previous study [2] with adjustment by adding points as follows: presence of signs commonly associated with PH (syncope, dyspnea, ascites, signs of right heart failure), three points each; presence of clinical signs not strictly associated with PH (lethargy, weakness, weight loss, coughing), 2 points; and abnormalities on clinical examination (e.g., murmur) or other clinical signs unrelated to PH (e.g., polyuria), one point. Heartworm disease was diagnosed by positive antigen testing (SNAP 4Dx Plus test, IDEXX Laboratories, USA), positive microfilaria, and/or visible filaria (linear parallel echo) in the PA, right atrium, or right ventricle on echocardiography.
Thoracic radiography
A radiography score (RS) was also calculated by adding one point for each radiographic sign (bronchial pattern, alveolar pattern, interstitial pattern, cardiomegaly, enlarged right ventricle, enlarged left atrium, enlarged main PA, enlarged distal PA, tracheal collapse, pleural effusion, and pulmonary venous congestion) in dogs that underwent thoracic radiography.
Clinical outcomes
The survival outcome was documented by telephoning the owners in June 2016 and classified as survival, PH-related death, non-PH-related death, or lost to follow-up. A PH-related death was defined as progressive right heart failure (ascites/pleural effusion) before death, dyspnea before death, or sudden death [1415]. Survival status at 3 months and 1 year after the first visit was recorded. Survival time was calculated as the interval between the first visit to death or end of the study. Dogs that were lost to follow-up, died from a non-PH-related cause, or survived until the end of the study were excluded from the survival analysis.
Echocardiographic measurements
All echocardiographic studies were performed between December 2014 and May 2016 by the same experienced veterinary cardiologist (IPC) using an Aplio ARTIDA machine (Toshiba, Japan) equipped with 7.0-MHz phased-array transducers. No dogs were sedated or anesthetized when examined. The average measurement of three consecutive cardiac cycles was calculated to avoid any influence of the respiratory and cardiac cycles. The M-mode-derived left ventricular internal diameter in diastole (LVIDd), left ventricular posterior wall in end diastole (LVPWd), interventricular septum in end diastole (IVSd), left ventricular internal diameter in systole (LVIDs), left ventricular posterior wall in end systole (LVPWs), and interventricular septum in end systole (IVSs) were normalized by body weight using a previously reported method (presented as LVIDdn, LVPWdn, IVSdn, LVIDsn, LVPWsn, and IVSsn, respectively) [16]. The fractional shortening (FS) and ejection fraction (EF) were also calculated [1718]. TR was recorded on left apical four-chamber and left parasternal long-axis right atrium and auricle views, and PA flow was recorded on the right parasternal short-axis view of the heart base. Care was taken to align the TR jet or PA flow with the plane of the ultrasound interrogation cursor. The TRPG was derived from the modified Bernoulli equation as described in both human and veterinary medicine [19]. If no TR was detected, the TRPG was recorded as zero. The PA flow profile was also recorded to measure the AT and ET. The AT was measured from the onset of the flow profile to the peak velocity and the ET was measured from the onset to the end of the flow profile. The AT/ET was calculated.
RPA measurements
M-mode echocardiography of the RPA was performed with the fastest sweep possible but was sufficiently slow to display three cycles in a frame, as in a previous study [5]. The right parasternal four-chamber long-axis view was interrogated by the two-dimensional image system (Fig. 1A) and the M-mode interrogation line was set in the middle of the RPA and perpendicular to the leading edge of the RPA. The end-systolic dimension of the RPA was measured at the maximum diameter (usually at the T wave) and the end-diastolic diameter was measured at its smallest dimension (at the Q wave; Fig. 1B). The diameters of the PA were measured using the “leading edge-to-leading edge” technique and were normalized by the aortic dimension designated as RPAsn and RPAdn. The aortic dimension was calculated using the leading edge-to-leading edge method from the right basilar short-axis M-mode measurement at early diastole (after the T wave). The RPAD index was calculated from the difference in systolic and diastolic diameters of the RPA divided by the systolic dimension of the RPA [57]. The anterior “dicrotic notch” displayed in the M-mode RPA tracing (RPAnotch) due to the Windkessel effect in the elastic great arteries was recorded and expressed as positive (Fig. 1B and C) or negative depending on whether the notch was present or absent, respectively [5].
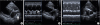 | Fig. 1M-mode echocardiographic images of the right pulmonary artery.(A) The right parasternal four-chamber long-axis view was interrogated by the 2-dimensional image system. The right pulmonary artery is indicated by a white arrow. The systolic (S) and diastolic (D) diameters (generally at the T wave and Q wave, respectively) were measured using the “leading edge-to-leading edge” technique. The RPAD index was calculated from the difference between S and D divided by S. The dicrotic notch of the right pulmonary artery (arrow) in a normal dog (B) and in a dog with severe pulmonary hypertension caused by heartworm disease (C).
RPAD, right pulmonary artery distensibility
|
Inter-observer and intra-observer measurements
Ten echocardiographic datasets were randomly selected to assess the variability of the inter-observer and intra-observer measurements. For each study, 2 operators (IPC, MCW) measured and analyzed the dimensions of the RPA in systole and diastole obtained by the M-mode technique. The RPAD index was calculated separately on a different day. The variability in each variable was then quantified as the coefficient of variation (CV) using the following equation:
CV = (mean difference between measurements/mean of measurements) × 100, expressed as a percentage. The degree of variability was arbitrarily defined as follows: <5%, very low; 5%–15%, low; 16%–25%, moderate; or >25%, high.
Statistical analysis
The statistical analyses were performed using SPSS version 20 (IBM Corp., USA) and SAS version 9.4 (SAS Institute Inc., USA) by the investigator (TH). A p-value < 0.05 was considered statistically significant.
The continuous data were tested for normality, and the normally distributed variables are expressed as the mean ± standard deviation. Between-group differences based on the TRPG were compared by analysis of variance.
The relationship between the echocardiographic variables and clinical findings was assessed using a 2-tailed Pearson correlation. A regression line and the R2 value were obtained for pairs that were considered significant (p < 0.05, R > 0.3).
Receiver-operating characteristic (ROC) curve analysis was used to estimate the abilities of the RPAD index, RPAsn, RPAdn, and AT/ET to predict TRPGs ≥36 mmHg and ≥50 mmHg, and the area under the curve (AUC) was calculated. The χ2 test was used to test the diagnostic power of the categorical data (RPAnotch).
The cut-off point derived from the ROC curve (using the Youden index) was used to evaluate the abilities of the RPAD index, TRPG, RPAsn, RPAdn, and AT/ET to predict survival at 3 months and 1 year. The difference in survival (days) below and above the cut-off point was tested using the log-rank statistic and illustrated by Kaplan-Meier survival curves. For the categorical data (RPAnotch), the dogs were divided into present and absent groups and underwent the same analysis as mentioned above for measuring the prognostic power of RPAnotch.
Univariate binary logistic regression was performed for each selected variable to test its predictive ability at 3 months and 1 year. Variables were included in the multivariate logistic regression model (backward elimination method) if the p-value was < 0.2 in the univariate binary logistic regression.
RESULTS
Study population and clinical findings
The records of 470 dogs were reviewed and 270 were excluded. One hundred of the 200 eligible dogs were male. The mean age was 9.7 ± 3.1 years and the mean body weight was 7.0 ± 6.5 kg (Fig. 2).
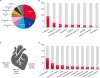 | Fig. 2The characteristics of study population (n = 200). (A) Breed included in our study; the Maltese, mix and Chihuahua were top 3. (B) Clinical signs distribution, 1 dog could have more than one sign; the most common clinical sign was coughing. (C) The point of maximal intensity of heart murmur, which was not detected in 29% of cases. (D) The thoracic radiography was available in 190 dogs; the most common finding was cardiomegaly.LAE, left atrial enlargement; MPA, main pulmonary artery; PA, pulmonary artery; RVE, right ventricular enlargement.
|
TRPG group
All 200 dogs underwent echocardiography which detected TR in 118 (59%). The RPAsn and RPAdn values were significantly higher and the RPAD index and AT/ET values significantly lower in the group with a TRPG > 75 mmHg when compared with the other groups. The proportion of dogs with a positive RPAnotch decreased significantly from the control group to the group with TRPG > 75 mmHg. Further details are shown in Table 1.
Table 1
Differences in variables between dogs based on TRPG and diagnosis
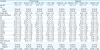
All values are expressed as mean ± standard deviation or number (%).
AT/ET, ratio of acceleration time to ejection time of pulmonary artery; CS, clinical score; EF, ejection fraction; FS, fractional shortening; IVSdn, normalized interventricular septal wall in end diastole; IVSsn, normalized interventricular septal wall in end systole; LVIDdn, normalized left ventricular internal diameter in diastole; LVIDsn, normalized left ventricular internal diameter in systole; LVPWdn, normalized left ventricular posterior wall in end diastole; LVPWsn, normalized left ventricular posterior wall in end systole; RPAD, right pulmonary artery distensibility; RPAdn, normalized end-diastolic right pulmonary artery dimension; RPAnotch, anterior dicrotic notch displayed in the M-mode tracing of the right pulmonary artery; RPAsn, normalized end-systolic right pulmonary artery dimension; RS, radiology score; TRPG, peak tricuspid regurgitation systolic pressure gradient.
*,†,‡,§The values are significantly different (p < 0.05).
![]()
Findings according to diagnosis
There were 40 dogs in the control group, 101 in the MMVD group, 26 in the CRD group, and 33 in the HWD group. The RPAsn and RPAdn were significantly higher in the HWD group than in the other groups, and the RPAD index and AT/ET were significantly lower in the CRD and HWD groups than in the other groups. There was a significant between-group difference in the proportions positive for RPAnotch. Further detailed information is provided in Table 1.
Correlation analysis
There was a significant positive correlation between the RPAD index and AT/ET and significant negative correlations between the RPAD index and the TRPG, RPAsn, RPAdn, and RPAnotch (Table 2). All variables were correlated with one another to some extent. The regression analyses for the correlation between the RPAD index and TRPG (R2 = 0.362, p < 0.001), the RPAD index and AT/ET (R2 = 0.106, p < 0.001), the TRPG and RPAsn (R2 = 0.264, p < 0.001), and the TRPG and RPAdn (R2 = 0.357, p < 0.001; Fig. 3).
Table 2
Correlations between clinical assessments and echocardiographic variables

AT/ET, ratio of acceleration time to ejection time of pulmonary artery; CS, clinical score; RPAD, right pulmonary artery distensibility; RPAdn, normalized end-diastolic right pulmonary artery dimension; RPAnotch, anterior dicrotic notch displayed in the M-mode tracing of the right pulmonary artery; RPAsn, normalized end-systolic right pulmonary artery dimension; RS, radiology score; TRPG, peak tricuspid regurgitation systolic pressure gradient.
*Correlation is significant at the 0.05 level (2-tailed). †Correlation is significant at the 0.01 level (2-tailed).
![]()
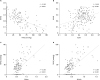 | Fig. 3Scatter plots for the indices. Scatter plot and regression line for RPAD and TRPG (A) and AT/ET and TRPG (B). The TRPG and RPAsn (C) and RPAdn (D).AUC, area under the curve; RPAD, right pulmonary artery distensibility; TRPG, peak tricuspid regurgitation systolic pressure gradient; AT/ET, ratio of acceleration time to ejection time of pulmonary artery; RPAsn, normalized end-systolic right pulmonary artery dimension; RPAdn, normalized end-diastolic right pulmonary artery dimension.
|
Diagnostic accuracy and optimal cut-off values for predicting PH
The RPAD index, RPAsn, RPAdn and AT/ET were predictors of TRPGs ≥ 36 mmHg and ≥ 50 mmHg (Table 3). The RPAnotch was also a significant indicator of TRPG values ≥ 36 mmHg (p < 0.001, with 71.4% sensitivity and 67.2% specificity) and ≥ 50 mmHg (p < 0.001; 78.6% sensitivity, 62.6% specificity) as indicated by the χ2 test.
Table 3
Statistical analysis of ROC curves for variables that predict TRPG ≥36 mmHg and TRPG ≥50 mmHg

AT/ET, ratio of acceleration time to ejection time of pulmonary artery; AUC, area under the curve; CI, confidence interval; ROC, receiver-operating characteristic; RPAD, right pulmonary artery distensibility; RPAdn, normalized end-diastolic right pulmonary artery dimension; RPAsn, normalized end-systolic right pulmonary artery dimension; TRPG, peak tricuspid regurgitation systolic pressure gradient.
![]()
Survival analysis
Overall, 173 of the 200 dogs were followed-up for 3 months and 89 for 1 year. Of those followed up for 3 months, 131 survived, 29 succumbed to PH, and 13 were excluded from the analysis because of non-PH-related death (n = 4) or loss to follow-up (n = 9). Of those followed up for 1 year, 46 survived, 40 died from a PH-related cause, and three were not included in the analysis because of non-PH-related death (n = 1) or loss to follow-up (n = 2).
The ROC curves showing the ability of the TRPG, RPAD index, RPAsn, and RPAdn to predict survival for more than 3 months and for more than 1 year are shown in Fig. 4. The AT/ET failed to predict either short-term (p = 0.24) or long-term (p = 0.063) survival, so no further analysis of this parameter was undertaken. Kaplan-Meier survival curves showed that dogs in the 3-month group with an RPAD index ≤ 21%, a TRPG ≥ 48.4 mmHg, an RPAsn > 0.59 and an RPAdn > 0.46 had shorter survival times and that those in the 1-year group (Fig. 5) with an RPAD index ≤ 24%, a TRPG ≥ 38.9 mmHg, an RPAsn > 0.59 and an RPAdn > 0.46 also had shorter survival times. The survival time was also shorter for dogs without an RPAnotch in both follow-up groups (Table 4).
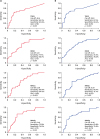 | Fig. 4Receiver-operating characteristic curves for the indices. Receiver-operating characteristic curves for TRPG, RPAD, and RPAsn, and RPAdn that predict the 3-month (A) and 1-year (B) survival in dogs.TRPG, peak tricuspid regurgitation systolic pressure gradient; RPAD, right pulmonary artery distensibility; AT/ET, ratio of acceleration time to ejection time of pulmonary artery; RPAsn, normalized end-systolic right pulmonary artery dimension; RPAdn, normalized end-diastolic right pulmonary artery dimension.
|
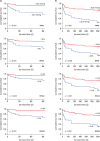 | Fig. 5Kaplan-Meier survival curves for the indices. Kaplan-Meier survival curves for TRPG, RPAD, RPAsn, and RPAdn at 3 months (A) and 1 year (B).RPAD, right pulmonary artery distensibility; TRPG, peak tricuspid regurgitation systolic pressure gradient; RPAsn, normalized end-systolic right pulmonary artery dimension; RPAdn, normalized end-diastolic right pulmonary artery dimension.
|
Table 4
Survival time in the groups with 3 months and 1 year of follow-up
CI, confidence interval; RPAD, right pulmonary artery distensibility; RPAdn, normalized end-diastolic right pulmonary artery dimension; RPAnotch, anterior dicrotic notch displayed in the M-mode tracing of the right pulmonary artery; RPAsn, normalized end-systolic right pulmonary artery dimension; TRPG, peak tricuspid regurgitation systolic pressure gradient.
![]()
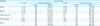
Univariate binary logistic regression analysis showed that the RPAD index, RPAsn, RPAdn, RPAnotch, and TRPG were associated with PH-related death at both 3 months and 1 year (Table 5). Subsequent multivariate logistic regression identified TRPG as an independent correlate of PH-related death within 3 months and within 1 year.
Table 5
Binary logistic regression analysis of pulmonary hypertension-related deaths during 3 months of follow-up and 1 year of follow-up

CI, confidence interval; OR, odds ratio; RPAD, right pulmonary artery distensibility; RPAdn, normalized end-diastolic right pulmonary artery dimension; RPAnotch, anterior dicrotic notch displayed in the M-mode tracing of the right pulmonary artery; RPAsn, normalized end-systolic right pulmonary artery dimension; TRPG, peak tricuspid regurgitation systolic pressure gradient.
![]()
Inter-observer and intra-observer variability
The CV for the inter-observer and intra-observer measurements of the RPAD index showed very low to low coefficient intervals (4.81% and 8.53%, respectively). The coefficient values for the inter-observer and intra-observer CV in measurements of RPAs and RPAd were also very low (1.20% and 2.13% for RPAs and 1.14% and 2.80% for the RPAD index, respectively).
DISCUSSION
The results of this study confirm the correlation between the RPAD index and severity of PH as assessed by the TRPG. The RPAD index and TRPG were both good predictors of survival at 3 months and 1 year but only the TRPG was an independent predictor. Our results support use of the echocardiography-derived RPAD index, especially in dogs suspected to have PH but TR is absent or difficult to obtain.
PA distensibility is associated with vessel elasticity and may be lost in dogs with damaged or abnormal endothelial cells [512]. PH is often associated with impairment of factors that regulate the endothelium, such as endothelin-1, whereas HWD directly damages the endothelium and the inflammatory response affects regulation of PA distensibility [512]. Severe and prolonged PH can also cause dysregulation of PA distensibility and progressive PH that worsens the outcome of left heart disease, e.g., MMVD, in dogs [37]. The RPAD index is a simple and reliable parameter for evaluation of severity of PH in dogs [57]. M-mode images of the RPA obtained in a right parasternal four-chamber long-axis view were interrogated in our study instead of 2-dimensional images obtained by a left parasternal apical four-chamber view because the former is less technically difficult to implement [57]. M-mode imaging of the RPA also allows evaluation of the RPAnotch, which is absent in dogs with advanced PH [5] and more apparent in M-mode [57]. A 2-dimensional RPA image also has the advantage of allowing calculation of the change in fractional area, which is widely used in humans with PH [91220]. Our results indicate a correlation (R = −0.601 and R2 = 0.362) between the RPAD index and TRPG; this correlation is lower than that in the studies by Venco et al. [5] (R = −0.9) and Visser et al. [7] (R2 = 0.81). This difference may reflect differences in the study populations and methods used to interrogate the RPA. In the study by Venco et al. [5], M-mode was used in healthy dogs and dogs with HWD. In the study of Visser et al. [7], 2-dimensional imaging was used and the study population included control dogs and dogs with TR secondary to various causes. Furthermore, the breeds and sizes of the dogs differed between the studies: Venco et al. did not provide information on breed or body weight; differences between the groups ranged from 13 kg to 16.7 kg, indicating medium-sized dogs, whereas the study by Visser et al. included various breeds with a body weight ranging from 5.6 kg to 8.9 kg. Although the method used to measure RPA dimensions in our study was similar to that in the study by Venco et al. [5], our study population was more similar to that in the study by Visser et al. [7]. Moreover, our linear regression equation is similar used by Visser et al. [7].
The dimensions of the RPA during systole and diastole are also theoretically distended in dogs with PH because of loss of PA distensibility and pressure/volume overload. In our study, there were significant correlations between TRPG, RPAsn, and RPAdn, and higher RPAsn and RPAdn values in dogs with more severe PH. Significantly higher RPAsn and RPAdn values and a lower RPAD index were found in the HWD and CRD groups than in the control and MMVD groups. Furthermore, the RPAD index and RPAnotch were worse in the MMVD group than in the control group, consistent with the phenomenon of severe and prolonged pulmonary venous hypertension caused by left heart disease leading to dysregulation of the endothelium and eventual loss of elasticity resulting from proliferation of the pulmonary vascular wall [9].
In previous research, dogs with MMVD had a poorer outcome if the TRPG was ≥ 50 mmHg, and severe PH was associated with higher mortality [1321]. Some studies have evaluated the association of other echocardiographic indices with chronic heart failure and survival [621]. Our ROC curve analysis indicates that the RPAD index and TRPG are moderate predictors of survival at 3 months and 1 year. The cut-off values for these indices were selected using the Youden index, and the dogs were grouped according to each cut-off value. Our Kaplan-Meier curve analysis also revealed a significant difference in survival between dogs with a TRPG above the cut-off and an RPAD index below the cut-off in the 3-month and 1-year follow-up groups. The Kaplan-Meier curve analysis also indicated that dogs without an RPAnotch had significantly shorter survival than those with an RPAnotch regardless of the follow-up duration. Univariate binary logistic regression revealed that all of the indices selected were associated with PH-related death within 3 months or 1 year. The subsequent multivariate logistic regression identified TRPG as an independent correlate of PH-related death within 3 months and 1 year. Further study of the prognostic value of these indices is needed.
The intra-observer and inter-observer variability in the RPAD index and in the systolic and diastolic dimensions of the RPA had very low to low CVs. Unfortunately, the reproducibility and repeatability analyses were limited by the retrospective nature of the study, in that there was variability in the images acquired in the same dog. These variations should be evaluated in a prospective study.
To our knowledge, this is the first study to investigate the prognostic value of the RPAD index in dogs with PH regardless of cause. This study has several limitations, primarily its retrospective design and the fact that the TRPG is an echocardiography-derived parameter with high variability that often overestimates the pressure gradient when compared with that measured by right heart catheterization [322]. However, echocardiography is the most convenient method available for diagnosing PH in veterinary medicine, and these indices are directly associated with survival. Next, there may have been some bias in the survival analysis because the cause of death was communicated by the owner if the dog did not die in hospital; furthermore, some dogs were lost to follow-up, which may have interfered with our findings. Finally, the medical treatment received by some dogs may have been a confounding factor because the cause of PH was likely to be complicated in these cases and the treatment would depend on the underlying cause.
In conclusion, we found that the value of the RPAD index was correlated with the TRPG and clinical findings. The RPAD index and TRPG both predicted 3-month and 1-year survival; however, the TRPG was the only independent predictor. Our study demonstrates the importance of PA elasticity in dogs with PH secondary to various causes. PH can be evaluated using these indices in the absence of measurable TR or PR and helps to predict the prognosis.
 XML Download