

 PDF
PDF ePub
ePub Citation
 Print
Print


INTRODUCTION
Regulation of skeletal muscle perfusion is vital to overall cardiometabolic health. At rest, skeletal muscle blood flow accounts for 20% of cardiac output. During physical exertion, 80% of cardiac output can be directed to contracting muscles making the regulation of microvascular blood flow (MBF) to skeletal muscles the primary determinant of systemic vascular resistance during exercise.1)2) Moreover, in going from rest to maximal exercise, blood flow to skeletal muscle has been shown to increase as much as 100-fold. This enormous range implies highly coordinated mechanisms of regulation. In addition to supplying oxygen and nutrition, blood flow to skeletal muscle is pivotal to metabolic energy regulation via insulin mediated glucose transport for storage as glycogen. Furthermore, compromise of microvascular perfusion is fundamental in the pathophysiology that determines end-organ damage in many chronic cardiovascular and systemic diseases. Thus, the ability to accurately evaluate, and even augment, skeletal muscle MBF clearly has broad clinical applications in both health and disease states.3)
Contrast-enhanced ultrasound (CEU) perfusion imaging, a technique originally developed to evaluate myocardial perfusion, has been applied to evaluate skeletal muscle perfusion.4) CEU not only addresses the practical requirements of cost, safety, portability, and rapid acquisition but can also be performed with equipment already present in most vascular medicine laboratories. CEU is uniquely suited for evaluating skeletal perfusion because it directly assesses nutritive microvascular flow in muscle that can originate from multiple sources, including major conduit artery inflow, collateral vessel networks, or redistribution from other limb tissues and nonnutritive pathways. CEU can be applied to assess microvascular perfusion in different physiologic states (e.g. rest, exercise, hyperinsulinemia) and disease states (e.g., rheologic and cardiovascular diseases). In this review, the application of CEU perfusion imaging in skeletal muscle will be discussed including details of the imaging technique and both clinical and pre-clinical studies.
CONTRAST ENHANCED ULTRASOUND
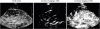
CEU relies on the detection of gas-filled encapsulated microbubbles that produce a unique scatter signature in an acoustic field and have a microvascular rheology similar to erythrocytes.5) The origins of microbubble contrast ultrasound imaging trace back to the 1960s, when ultrasound signals were seen in the right heart after bolus administration of an indicator-dilution tracer produced small bubbles during rapid injection.6) Since then, there have been many advances in the production of microbubbles and contrast-specific ultrasound protocols used to detect them.7)8) For perfusion imaging, it is necessary to detect contrast microbubbles within the microcirculation of tissue. Contrast specific imaging techniques take advantage of the ability of contrast agents to produce unique signal, which differentiates bubbles from tissue during non-linear oscillation. While harmonic imaging is sufficient to detect microbubbles when the concentration of microbubbles is high (i.e. left ventricular cavity), contrast specific techniques are required to detect contrast agents in skeletal muscle due to the relatively low blood volume and low microbubble concentration at rest. In order to isolate microbubbles in muscle at non-destructive powers, it is necessary to increase microbubble signal relative to tissue using algorithms that completely eliminate the tissue signal (“noise”). This goal can be achieved with multi-pulse techniques that eliminate linear backscatter, which originates from tissue at low power, but detects non-linear signal from microbubble oscillation (Figure 1).7) These approaches produce sufficient microbubble signal relative to tissue to allow robust tissue perfusion quantification in seconds with real-time imaging.9)10) Indeed, the low signal-to-noise of contrast signal within skeletal muscle has been a challenge addressed in several published studies regarding the development of this technique.11)12)
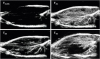
Figure 1
Contrast specific imaging of skeletal muscle. (A) 2D-B mode harmonic imaging of calf muscle (soleus and gastrocnemius). (B) Contrast specific imaging of calf muscle prior to contrast microbubble administration. (C) Contrast specific imaging of calf muscle during contrast microbubble infusion. Note the near complete loss of tissue signal compared to 2D using contrast specific imaging. The residual ultrasound signal is from interfaces of tissue planes within skeletal muscle that can produce strong non-linear acoustic signal. Accordingly, background subtraction using imaging frames obtained immediately after a destructive pulse sequence is recommended to permit analysis of signal produced by microbubbles alone.
CEU PERFUSION IMAGING
The basis for any perfusion imaging technique is that MBF is essentially a volume of blood moving through tissue over a period of time. To assess microvascular blood volume (MBV), CEU imaging takes advantage of the relationship between contrast signal intensity and MBV. The degree of ultrasound contrast intensity in any tissue is directly proportional to the microbubble concentration in circulating blood and the relative MBV within the region of interest, defined as the mass fraction that is attributable to actively perfused vasculature within the tissue. When the concentration of microbubbles within the circulation is made constant via continuous intravenous infusion, absolute MBV can be quantified in terms of mL/g of tissue by comparing the MB signal intensity of tissue to that of the blood pool.10) In either bolus or continuous infusions of microbubbles, care must be taken to ensure that signal intensity is within the portion of the ultrasound dynamic range where the relationship between microbubble concentration and intensity is predictable (Figure 2A).10)13)14)15) In addition, phasic variation of skeletal muscle tissue signal intensity over the cardiac cycle should be noted (Figure 2B). During systole, video intensity in large and medium size arteries tends to increase due to blooming artifacts caused by microbubble motion. Gating image acquisition to end-diastole minimizes this issue as one frame per cardiac cycle is sufficient to construct time intensity curves (TICs) either after bolus injection or with destruction-replenishment kinetics. The importance of cardiac gating during imaging was demonstrated in a study of lower extremity perfusion imaging where significant variation in systolic and diastolic video intensity was noted.16) For this reason, many protocols use imaging frames that are triggered to the diastolic component of the cardiac cycle.
Figure 2
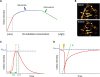
Microvascular blood volume: (A) Relationship between microbubble concentration and ultrasound video intensity. At lower concentrations, signal intensity is within the portion of the ultrasound dynamic range where the relationship between microbubble concentration and intensity is nearly linear (red portion). Intermediate concentrations result in ultrasound signal saturation (blue portion) whereby signal intensity is maximal. High microbubble concentrations attenuate the ultrasound pulses causing a decrease in the video intensity (green portion). (B) Post-destruction color coded CEU images of skeletal muscle in systole and diastole. Kinetic models of microvascular flux rate: (C) Time-intensity curve (TIC) analysis of contrast tissue transit rate kinetics after bolus injection. Parameters such as time to peak (TTP) and peak intensity (VI peak) are measured directly while maximum slope (m) and mean transit time (MTT) are calculated. (D) Time-intensity curve for contrast destruction-replenishment kinetics during continuous infusion of microbubbles. After transiently destroying microbubbles within the imaging sector (yellow bolt), video intensity recovery over time is fit to the function y = A (1 - eβt). The product of microvascular blood volume (A-value which is the plateau of the curve) and the blood flux rate (β or rate constant of replenishment) is calculated to determine tissue blood flow.
In order to assess tissue perfusion in terms of MBV over time with CEU, kinetic information is necessary. In that microbubbles are pure intravascular tracers displaying nearly identical rheologic behavior in the microcirculation as erythrocytes,5) they are ideally suited to provide information on the velocity of RBCs, referred to as flux. Tissue red cell flux can be measured by two different approaches. One is the bolus technique, which measures tissue transit rate kinetics after a bolus injection. This approach is advantageous in its simplicity. First, video data from a region of interest is displayed graphically as contrast signal intensity over time following intravenous injection of contrast. This TIC after bolus injection of the contrast agent represents the average intensity in a region of interest as a function of time. Using dedicated quantification software, specific time-intensity curve parameters that reflect local perfusion can be calculated, such as time to peak, peak intensity, wash-in- and wash-out-time, maximum slope, and mean transit time (Figure 2C).17)18)19) These transit rate kinetics however are also influenced by the input function from the main arterial inflow, and hence are vulnerable to variation in the injection rate and total flow (i.e. cardiac output) between subjects. In fact, it has been shown that microbubble injection rates significantly influence temporal data such as rate-of-rise of enhancement and time-to-peak, but have little impact on maximum enhancement of the curve (representing relative blood volume).20)
Another well-established approach is the continuous infusion technique, which uses contrast destruction-replenishment kinetics to quantify blood flow. Microbubbles are first continuously infused through a peripheral vein to achieve a steady state microbubble concentration in circulation. Once the contrast concentration is at a steady state, microbubbles within the imaging sector are destroyed with a brief (e.g. 3-5 frame) high-power ultrasound pulse sequence. The rate and intensity of contrast re-appearance in the tissue of interest after microbubble destruction is then recorded by low-power imaging. TICs are constructed from the data and fit to the function y = A (1 - eβt), where A is MBV or the plateau of the curve and β is the blood flux rate or curve rate constant of replenishment (Figure 2D).9) The product of MBV (A) and microvascular blood flux rate (β) can then be calculated to provide a measurement of MBF (A × β). An advantage of this method is that the data used to quantify blood flow can be obtained in a matter of seconds.13)14)15) Finally, absolute quantification of MBF is possible by normalizing contrast signal from tissue to that in the blood pool to derive absolute MBV.10)21)
Compared to the bolus technique, the main challenge with continuous infusion CEU imaging of limb perfusion at rest is the relatively low signal-to-noise produced during conventional low-power real-time CEU imaging, which is attributable to low skeletal muscle blood flow (0.05–0.3 mL/min/g) at rest.22) High acoustic power CEU imaging results in greater signal, but it also results in microbubble destruction through inertial cavitation, which requires more time-consuming and technically difficult image acquisition protocols.23)24)25) During low-power CEU imaging, the signal produced by microbubbles often can be enhanced by increases in the acoustic power used to image. However, with increasing acoustic power there is an upper limit where stable cavitation converts to inertial cavitation and microbubbles are destroyed. Thus, there is a limit to signal enhancement whereby improved contrast signal-to-noise through higher acoustic powers will not improve signal due to the offsetting effects of microbubble destruction.26) Experimental microbubble agents capable of being imaged at intermediate acoustic intensities without destruction from inertial cavitation are now being applied in order to combine the advantages of higher acoustic powers which amplifies signal-to-noise and ability to perform real-time rapid data acquisition in < 20 seconds.11)
STRESS PERFUSION IMAGING
An important aspect of CEU perfusion imaging of skeletal muscle is the ability to perform stress-rest perfusion imaging protocols similar to those used in the heart. Interest in stress protocols is based on the observation that measurement of skeletal muscle blood flow at rest alone cannot differentiate healthy subjects from patients with clinically evident disorders of skeletal muscle hypoperfusion, such as peripheral artery disease (PAD).23)27) Hyperemic skeletal muscle blood flow during CEU perfusion imaging has been achieved by several different stressors including reactive hyperemia induced by transient arterial occlusion, pharmacologic stress using adenosine or adenosine receptor agonists, and various forms of isometric and non-isometric exercises. When comparing arterial occlusion to isometric exercise, both methods differentiated healthy controls from patients with PAD, but there was less variation in measurements made with occlusion-reperfusion.28) In these studies, perfusion imaging could not be performed during active isometric exercise because of the long period of image acquisition inherent in the bolus injection technique, and also the significant decrease in muscle blood volume during contraction.29)
Pharmacologic vasodilator stress, which is frequently used to evaluate myocardial MBF in people who cannot exercise, has also been proposed as a method to assess limb hyperemic blood flow in people who cannot exercise. However, preclinical pharmacology studies suggested that peripheral vascular response to vasodilators that act through adenosine receptor signaling or phosphodiesterase inhibition may be small relative to that which occurs in the coronary vascular bed.30) In a study comparing vasodilator stress to exercise in patients with moderate to severe PAD, dipyridamole was markedly inferior to modest contractile exercise in terms of producing hyperemic flow and differentiating the degree of flow impairment and the degree of improvement with revascularization.23)
Although the work required within muscle groups can vary for the same amount of exercise in two individuals, the ability to measure perfusion during repetitive muscle contraction represents the most physiologic provocative test for evaluating exercise ischemia. In preclinical studies, the experimentally manipulated stenotic pressure gradient correlated well with skeletal muscle flow during contractile exercise produced by electrostimulation.31) In humans, exercise studies evaluating flow reserve with CEU have generally employed contractile exercise with modest plantar flexion exercise, which produces an 8- to 12-fold increase in calf muscle perfusion in normal subjects.24) In older studies using intermittent high-power imaging protocols that require approximately 90 seconds for acquisition, CEU imaging data has been obtained by acquiring ultrasound frames between periodic contractions at a frequency of every 5 or 10 seconds. With the advent of real-time low- or intermediate-power imaging, exercise stress images can be acquired in as little as 15-20 seconds, enabling data acquisition immediately after exercise cessation (Figure 3).
Figure 3
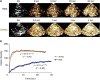
Contrast enhanced ultrasound perfusion imaging of skeletal muscle at rest and during exercise in a healthy control. (A) Color coded background-subtracted contrast enhanced ultrasound (CEU) images at various time intervals after high-power destruction in calf muscle of a normal control subject at rest and immediately after cessation of contractile exercise. Note the differences in both time to peak intensity and absolute peak video intensity between rest and stress. (B) Time-intensity data for CEU destruction-replenishment perfusion imaging at rest and immediately following exercise. BG: background.
CLINICAL STUDIES
The application of CEU perfusion imaging of skeletal muscle in clinical research studies has spanned a multitude of disease states. The breadth of clinical investigations using CEU imaging to date speaks to the unique capabilities of this technique to provide insight into not only MBF but also its parametric components, microvascular flux rate and capillary blood volume. As will be briefly reviewed, the diversity of research studies using CEU imaging of skeletal muscle is broad and promises to increase further as the development of ultrasound technology devoted to optimizing this application evolves.
Peripheral arterial disease
Conventional techniques to evaluate patients with PAD rely either on measurement of regional pressures, [e.g., ankle-brachial index (ABI) or toe-brachial index] or on non-invasive imaging applications to assess the degree of obstruction in conduit arteries (e.g., spectral Doppler together with 2-D imaging, magnetic resonance angiography, computed tomography angiography). All of these approaches however are limited in their ability to evaluate diffuse or small vessel disease, microvascular dysfunction, or the influence of collateral perfusion on nutritive microvascular flow, which are fundamental aspects of the pathophysiology that determines end-organ damage in PAD. Clinical studies have now shown that CEU perfusion imaging provides valuable information on PAD severity beyond that provided by standard-of-care evaluation using ABI.18)24)32)
Early studies using the bolus technique in PAD patients with intermittent claudication, i.e., Rutherford class I-III, compared to controls revealed that PAD patients had a significantly longer time to peak intensity (TTP) under resting conditions despite the lack of resting symptoms.17)18) Moreover, TTP did not correlate with ABI, indicating a dissociation between the hemodynamic significance of conduit artery stenosis and tissue perfusion, a finding that has been consistent in many subsequent studies. In a study of PAD patients with either claudication or critical limb ischemia, Fontaine Class IIa to IV, TTP contrast intensity tended to increase with the symptomatic severity of disease and was particularly prolonged in patients with a lack of collateral circuits.19) Comparison of TTP 4 days after revascularization to pre-revascularization showed that TTP shortened following revascularization. PAD patients with the greatest change in TTP following revascularization were more likely to have symptomatic improvement at six months.33) Other parameters of the bolus kinetic model curve in PAD patients however did not correlate well with symptoms.32) Finally, the test-retest reliability of post-occlusive transit kinetic parameters has been investigated.34) Reliability within individuals was modest (coefficient of variation range: 15%-87%) with the most reliable parameter being TTP.
CEU using the continuous infusion technique and destruction-replenishment kinetics has also been extensively studied in PAD patients and has the advantage of providing absolute quantitation of tissue perfusion at rest and during stress (Figure 4). An early study using this method showed that PAD patients with intermittent claudication had lower peak exercise perfusion and lower limb perfusion reserve compared with controls.24) CEU perfusion during exercise and flow reserve (ratio of exercise to resting flow) were better predictors of symptom severity, assessed by time to symptoms on upright treadmill exercise test, than traditional measures such as ABI, exercise ABI, and pulse-volume recordings. Even in PAD patients with an ABI > 0.9, CEU could detect reduced exercise blood flow compared to controls. Moreover, PAD patients with diabetes mellitus, who are recognized to have additional flow impairment from microvascular dysfunction, were found to have particularly poor tissue perfusion. CEU with destruction-replenishment kinetics imaged at intermediate powers has been shown to have excellent test-retest reproducibility and low variability for both MBF (Aβ) and the rate of blood volume transfer (flux rate, β)12) despite known day-to-day variability in limb muscle perfusion.35) A current study of CEU perfusion imaging in PAD patients with intermediate ABIs (0.4-0.6) in at least one limb and a wide range of symptoms as described by Rutherford symptom classification is being performed. This study aims to determine if CEU perfusion imaging can detect differences in limb blood flow in PAD patients that are likely responsible for differences in symptoms irrespective of the ABI [NCT02398266].
Figure 4
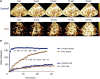
Contrast enhanced ultrasound perfusion imaging in patient with peripheral artery disease (PAD) versus healthy control. (A) Color coded background-subtracted contrast enhanced ultrasound (CEU) images at time intervals following a destructive pulse in control and PAD patient during exercise. (B) Time-intensity data for CEU destruction-replenishment perfusion imaging at rest and immediately following exercise in a patient with moderate PAD versus a healthy control. At rest, perfusion imaging does not differentiate between the PAD patient with effort induced claudication and a healthy control. During exercise, microvascular blood flow (A × B) is significantly reduced in the PAD patient compared to the control. By parametric analysis, the reduction in blood flow in the PAD patient is mediated by a markedly reduced β function, describing the microvascular flux rate.
Sickle cell disease
CEU perfusion imaging has also been used as a tool to evaluate skeletal muscle perfusion in patients with hematologic diseases such as sickle cell disease (SCD). SCD is a genetic condition caused by a point mutation in the beta-globin gene (HBB), producing hemoglobin S (HbS). HbS polymerizes upon deoxygenation, altering the rheology of sickled erythrocytes.
The pathophysiology of tissue ischemia in SCD is multifactorial and involves (i) microvascular loss, (ii) abnormal rheology in the distal microcirculation, and (iii) hemolysis mediated loss of nitric oxide bioavailability resulting in dysfunctional microcirculatory vasoreactivity.36) CEU perfusion imaging studies have investigated whether these mechanisms lead to overt hypoperfusion of key tissues, such as the myocardium or skeletal muscle. In one study, forearm muscle and myocardial perfusion in SCD patients, some of whom were treated with hydroxycarbamide (HC), was compared with that of control subjects.37) When corrected for the degree of anemia in SCD patients, skeletal muscle blood flow in HC-treated SCD patients was similar to that of control subjects and significantly higher than that of untreated SCD patients. Parametric analysis of CEU data indicated a trend toward improvement in both functional MBV and microvascular flux rate in SCD patients treated with HC. This finding suggests improvement in both regulation of functional capillary units and rheology of red blood cells (RBCs).38) Another contrast perfusion study sought to determine if CEU can detect differences in the MBF of skeletal muscle in adult SCD patients: i) before and after infusion with the adenosine A2A receptor (A2AR) agonist regadenoson, and ii) between baseline and vaso-occlusive crisis (VOC) in SCD patients.39) CEU imaging during regadenoson infusion showed an increase in skeletal muscle MBF of 29% at 6 hours and 9% at 24 hours. The increase in MBF with regadenoson was noted to be largely due to higher RBC velocity. In comparison, MBF decreased by 40% in skeletal muscle during VOC compared to baseline and was also primarily due to a decrease in RBC velocity. Both studies concluded that the ability of CEU perfusion imaging to detect differences in skeletal muscle blood flow make it a potential objective outcome measure for therapeutic studies in SCD.
Lipoprotein apharesis in hypercholesterolemia
The ability of CEU perfusion imaging to evaluate multiple microvascular beds is a particular advantage of the technique given regulation of microvascular flow in different vasculature territories is not identical. This fact was demonstrated in a CEU study of patients with familial hypercholesterolemia who were treated with lipoprotein apheresis as a therapy for familial hypercholesterolemia patients in whom adequate LDL-C reduction could be achieved with maximally tolerated pharmacotherapy.40) CEU of the myocardium at rest and skeletal muscle at rest and during calibrated contractile exercise was performed before and immediately after lipoprotein apheresis. Apheresis acutely decreased low-density lipoprotein cholesterol (pre: 234.9 ± 103.2 mg/dL versus post: 67.1 ± 49.5 mg/dL), which resulted in increased resting myocardial perfusion without changes in myocardial work. In contrast, skeletal muscle perfusion at rest and during contractile exercise was unchanged by apheresis. To better understand the mechanisms involved in the seemingly disparate response of coronary and skeletal muscle vascular territories to apheresis, ex-vivo ovine coronary and femoral artery ring tension assays were performed. The assays showed that acetylcholine-mediated dilation of coronary but not femoral arteries was impaired in the presence of pre-apheresis plasma and was completely reversed in post-apheresis plasma.
Diabetes
Based on its unique capacity to measure not only MBF but also the parametric components, capillary blood volume and microvascular flux rate, CEU perfusion imaging has been instrumental in studying how skeletal muscle blood flow and capillary responsiveness contribute to impaired glucose metabolism in insulin-resistant diabetes.41)42)43) An early CEU study evaluated capillary recruitment in patients with type 2 diabetes both with and without microvascular complications.25) Bulk flow in the brachial artery measured by Doppler ultrasound was similar between all groups both before and after low- and high-intensity periodic handgrip exercises. CEU performed on forearm skeletal muscle was also similar between controls and diabetics without microvascular complications. In comparison, diabetic patients with microvascular complications had a 50% reduction in capillary volume recruitment and a 60%-70% reduction in MBF during both low- and high-intensity exercises compared with the control group and diabetics without microvascular complications. These flow abnormalities were independent of disease duration and suggested that recruitment of capillary volume is impaired in diabetics with microvascular complications even if bulk flow in the brachial artery remains unchanged. The metabolic and vascular action of insulin on skeletal muscle has also been studied with CEU imaging.43) Healthy lean volunteers underwent CEU perfusion imaging of forearm muscles before and during a 2-hour hyperinsulinemic-euglycemic clamp. By CEU imaging, microvascular volume increased within 20 minutes of insulin infusion whereas increased total forearm flow was not observed until 100 minutes. The author's conclusion supported the use of CEU imaging in that, “The increases in microvascular (capillary) volume (despite unchanged total blood flow) indicate that the relation between insulin's vascular and metabolic actions cannot be fully understood using measurements of bulk blood flow alone.”
CEU perfusion imaging has also been used to study the microvascular effects of exercise on glucose uptake. Perfusion imaging of healthy controls during a euglycemic-hyperinsulinemic clamp 4 hours after single-legged exercise showed that microvascular perfusion increased by 65% in the exercised leg compared to 25% in the rested leg. In addition, glucose uptake increased 50% more in the exercised leg than in the rested leg. Importantly, infusion of nitric oxide synthase inhibitor L-NG-monomethyl-L-arginine acetate into both femoral arteries reversed the insulin-stimulated increase in microvascular perfusion in both legs and abrogated a greater glucose uptake in the exercised leg compared with the rested leg.44) A recent CEU study investigated whether increased blood flow-associated shear stress on endothelial cells is an underlying mechanism by which physical activity enhances insulin-stimulated vasodilatation and glucose uptake. CEU was performed before and following 1 hour of unilateral limb heating. The authors observed that increased leg blood flow induced by unilateral limb heating for 1 hour subsequently augmented insulin-stimulated muscle perfusion by CEU imaging. Combined with in-vitro studies, the authors concluded that enhanced shear stress on the vascular endothelium results in greater insulin-responsiveness and may be a principal mechanism by which physical activity enhances insulin-stimulated vasodilatation.45)
Heart failure
Patients with heart failure are commonly limited by symptoms of dyspnea and fatigue. Impaired cardiac function has often been invoked as the causative mechanism of these limitations; however, there is now evidence that cardiac dysfunction alone does not fully explain the degree of exercise intolerance and exertional symptoms.46)47)48) These observations have increased focus on disease-related changes in the regulation of skeletal muscle blood flow. Early studies using near infrared spectroscopy showed that patients with heart failure exhibited an exaggerated decrease in limb hemoglobin oxygenation with progressive increases in exercise workload, resulting in maximal deoxygenation at a workload less than half that seen in normal subjects.49) Small muscle mass exercises, which do not provoke significant cardiopulmonary stress, were also used to isolate peripheral perfusion from central cardiac limitations and showed a marked reduction in limb blood flow during both handgrip and knee-extensor exercises in patients with systolic heart failure.50)
CEU perfusion imaging is now also being used to study skeletal muscle perfusion in patients with heart failure. A recent study investigated whether skeletal muscle perfusion and exercise capacity improved following left ventricular assist device (LVAD) implantation. CEU perfusion imaging of the quadriceps muscle was performed prior to and after LVAD implantation and then at several time points after. Perfusion imaging at each time point was performed during rest and after knee extensor exercises. Skeletal muscle perfusion across the study time points was unchanged. However, time to initial contrast visualization and time to peak contrast intensity decreased after exercise compared to pre-LVAD measurements.51) The same investigators then looked at whether CEU perfusion imaging could differentiate patients whose symptoms improved significantly from those that did not following LVAD implantation. They found that compared to pre-operative measures, responders exhibited increased resting muscle perfusion at 3 months compared to non-responders.52) Further studies using CEU imaging of skeletal muscle perfusion following LVAD implantation are ongoing [NCT02105831].
FUTURE PERSPECTIVES/THERAPEUTIC APPLICATIONS
The utility of contrast enhanced ultrasound imaging of skeletal muscle lies not only in its diagnostic capability but has recently been shown to have a wide variety of therapeutic applications. The ability to acutely augment tissue perfusion with ultrasound has led to interest in its use to treat tissue ischemia in cardiovascular disease. This increases in muscle blood flow during high-power ultrasound has been shown to be markedly amplified by the intravascular presence of microbubbles and can reverse tissue ischemia.53) The presence of encapsulated microbubble contrast agents within the microcirculation results in acoustic cavitation that can produce high focal shear and markedly augment the effects of ultrasound on blood flow. Part of the mechanism behind this effect has recently been elucidated. Flow augmentation using therapeutic ultrasound microbubble cavitation relies on shear-dependent increases in ATP, which can act through a diverse portfolio of purinergic signaling pathways.54) This effect was shown to reverse hindlimb ischemia in mice for > 24 hours and to increase muscle blood flow in patients with SCD. Further studies validating these findings in humans are ongoing [NCT03195556].
Another therapeutic application of CEU imaging currently being studied is in site-directed gene and drug delivery.55)56)57) Targeting the delivery of therapeutic drugs or genes using microbubbles would theoretically be possible in all sonographically accessible tissues. Development of this non-invasive and localized delivery of gene and drug molecules to pathologic tissues by employing microbubble cavitation will require further understanding of sonoporation mechanism(s) and ultrasound parameters as well as refinement of contrast microbubbles as drug delivery agents.
SUMMARY
The future of contrast enhanced ultrasound perfusion imaging of skeletal muscle will depend on the continued development of technology for applications in both clinical and preclinical arenas. Importantly, all the clinical studies reviewed used conventional clinical ultrasound systems that are optimized for 2D imaging and contrast opacification of cardiac and other solid organ structures. Development of ultrasound equipment and technologies specifically for skeletal muscle imaging is critical for optimizing the technique. For example, the development of customizable wrap around transducers will provide greater imaging coverage of limb muscle. Microbubble development directed towards the unique challenges of imaging skeletal muscle tissue with the capacity for both the lowest and highest flow microvascular perfusion anywhere in the body is also needed to enhance the robustness of the perfusion data. Advances in 3D contrast imaging could potentially provide not only more robust perfusion data but also afford the opportunity to image the functional vasculature of limbs through maximal intensity projection (Figure 5). Finally, image processing and analytic support through software innovation would advance both research and clinical applications as a means to better identify and treat disorders of impaired microvascular flow. The promises of CEU perfusion imaging to understand physiology, enhance diagnostic capabilities, accelerate drug development, monitor therapies, and provide therapeutic treatments is now being realized. CEU will continue to evolve as the engineers, basic scientists, and clinicians engaged in this field collaborate to advance the capabilities of CEU skeletal muscle imaging.
Figure 5
Maximal intensity projection (MIP) imaging in a murine model of hindlimb ischemia. Contrast perfusion imaging on day 5 following unilateral femoral artery ligation in a mouse hindlimb. MIP image 4 seconds after microbubble destruction demonstrating homogeneous (A) and heterogeneous (B) spatial distribution of vessels during angiogenic remodeling. MIP long axis image immediately after microbubble destruction (C) and 2 seconds after microbubble destruction (D) demonstrating the architecture of the inflow vessels.
 XML Download