

 PDF
PDF ePub
ePub Citation
 Print
Print


INTRODUCTION
Spontaneous intracerebral hemorrhage (ICH) accounts for 10 to 15% of all strokes and has a mortality rate of approximately 20 to 70%.12 The 30-day mortality rate is as high as 50%,34 and 75% of survivors are left functionally dependent.15 Cerebral small vessel disease (SVD) has been thought of as chronic ischemia in an aging brain. However, SVD has been recently considered a major risk factor for cerebrovascular diseases, including ICH and cognitive impairment.67 On neuroimaging, SVD is characterized by cerebral microbleeds (CMBs), white matter hyperintensity (WMH), enlarged perivascular space (EPVS), and lacunae.6 CMBs have been considered as predictors of spontaneous ICH development8 and are associated with Alzheimer's disease9 and vascular dementia,10 along with higher incidences of stroke recurrence,8 new disabilities,11 and poststroke depression.12 WMH is thought of as a preexisting condition of cognitive decline.13 Lacunae are considered to be asymptomatic ischemic strokes.
Despite recent advancement in this field, there is very little consolidated research on SVD markers as factors potentially related with ICH, and there are no reports on how these markers correlate with ICH. Although there have been some recent reports regarding the spatial locations of WMH,14 EPVS,15 and lacunae16 in relation to ICH location, no study has examined the associations between ICH and all SVD markers in a single cohort. Therefore, the purpose of this study was to explore whether individual SVD markers are a common finding in ICH patients, compared to control cases, and to examine the pattern of all SVD markers with aging in both groups, focusing on CMBs and their relationship with ICH.
Go to : 
MATERIALS AND METHODS
Materials
The ICH group consisted of 150 consecutive patients who experienced a first primary parenchymal ICH from 2011 to 2017. Ninety patients were male; 60 patients were female. Patient ages ranged from 30 to 89 years (mean 62.0 years). This study was approved by the Institutional Review Board of Chung-Ang University Hospital as a retrospective observational study (IRB number 1707-010-16801).
Patients who had appropriate MRI sequences were included in the study. The MRI images (3.0 T MRI scanners, Philips Achieva 3.0T, Amsterdam, the Netherlands) were composed of T2-weighted imaging (T2WI, repetition time/echo time 2831.2/80 ms, 5 mm thickness), fluid attenuated inversion recovery (FLAIR: repetition time/echo time 11000/140 ms, inversion time 2500 ms, 5 mm thickness), susceptibility weighted imaging (SWI, repetition time/echo time 22.9/32.7 ms, 3 mm thickness), or gradient echo. ICH due to brain tumor, vascular malformation, hemorrhagic transformation from ischemic stroke, moyamoya disease, or aneurysm rupture was excluded. Patients treated with anticoagulants were excluded. Patients less than 30 years old were also excluded. Two experienced physicians (MS.C and YS.P) independently reviewed each MRI sequence, defined the ICH characteristics, and graded the degree of SVD. The control group consisted of 271 age- and sex-matched individuals who had undergone brain MRI in a health care center from 2015 to 2017. Individuals with a past medical history of overt cerebral ischemic attack or hemorrhage stroke were excluded. The ages of the controls ranged from 32 to 87 years (mean 60.4), and there were 156 males and 115 females.
Methods
The clinical variables collected were age, sex, presence of hypertension, diabetes, and levels of high density lipoprotein (HDL) and low density lipoprotein (LDL) cholesterol. ICH location was designated at one of four locations: 1) “deep nuclei,” when in the thalamus or basal ganglia, 2) “lobar,” when in the cortex or subcortex, 3) “brainstem,” or 4) “cerebellum.” ICH volume was calculated with ABC/2 on CT.
Four types of SVD imaging markers were assessed on MRI. CMBs were defined as a black or hypointense round signal loss with a diameter up to 5 mm on SWI or gradient echo images. The number of CMBs was counted. CMBs were localized in a similar fashion to ICH location. CMBs that resulted from cavernomatosis and diffuse axonal injuries were excluded. WMH was defined on FLAIR MRI,6 appearing as multiple high signal spots or diffuse patches. The location and grade of WMH were defined according to the Fazekas scale classification as “periventricular” and “deep white matter,” and were scored from being absent (0) to a large extension or confluent formation (3) at each location. EPVS was defined as round CSF intensity lesions with a diameter up to 3 mm on T2WI and was assessed on the contralateral side of the ICH at the basal ganglia and centrum semiovale. The absolute numbers were graded as absent (0), mild (1) for 1 to 20, moderate (2) for 21 to 40, and severe (3) for over 41. Lacunae were defined as high signals on T2WI and low signals with surrounding hyperintensity on FLAIR imaging between 3 mm and 15 mm in diameter. The number of lacunae was counted.
Statistical methods
We compared the clinical profiles and individual SVD markers between the two groups. Continuous variables were compared using the independent t-test, and categorical variables were compared using the Chi-square test (IBM SPSS statistics 23.0; IBM Corp., Armonk, NY, USA). Logistic regression analysis was performed to examine associations between imaging markers and ICH after adjusting for age, sex, presence of hypertension and diabetes, levels of cholesterol, and SVD imaging markers. ROC curves were constructed by computing the sensitivity and specificity of significant variables. According to age groups, each SVD marker was compared between the ICH and control groups with two-way ANOVA test. The Pearson correlation test was performed to study the correlation between ICH volume and CMB count. To determine the relationship between ICH and CMB location, the Chi-square test was used. p values <0.05 were considered statistically significant.
Go to :
RESULTS
General characteristics
Age and sex were not significantly different between the two study groups. Hypertension was more frequent in the ICH group (81/150, 54% vs. 93/271, 34%), and the frequency of diabetes was the same in the two groups (21/150, 14% vs. 49/271, 18%). The level of HDL cholesterol was the same in the two groups (49.8±12.8 mg/dL in the ICH group vs. 52.1±12.2 mg/dL in the control group), while the level of LDL cholesterol was significantly lower in the ICH group (106.9±32.7 mg/dL vs. 117.7±34.1 mg/dL) (Table 1).
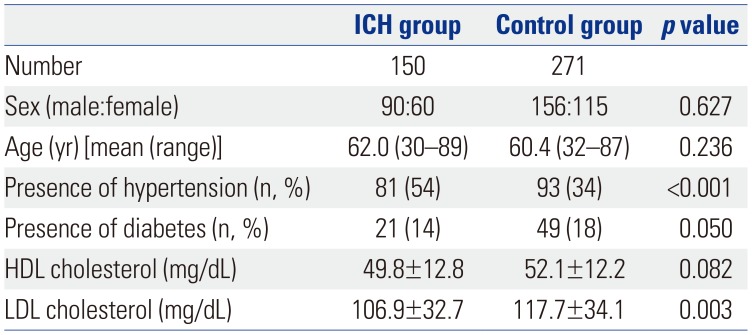
Table 1
Demographic Data of the Intracerebral Hemorrhage and Control Groups
![]()
Comparison of SVD markers
We noted a total of 1278 CMB lesions in 121 of 150 ICH patients (80.6%). In the control group, a total of 77 CMB lesions were found in 32 of 271 individuals (11.8%). The difference in CMBs between the ICH and control groups was statistically significant (p<0.001). In the ICH group, the most frequent location of CMBs was the deep nuclei, while that in the control group was the lobar region (Table 2).
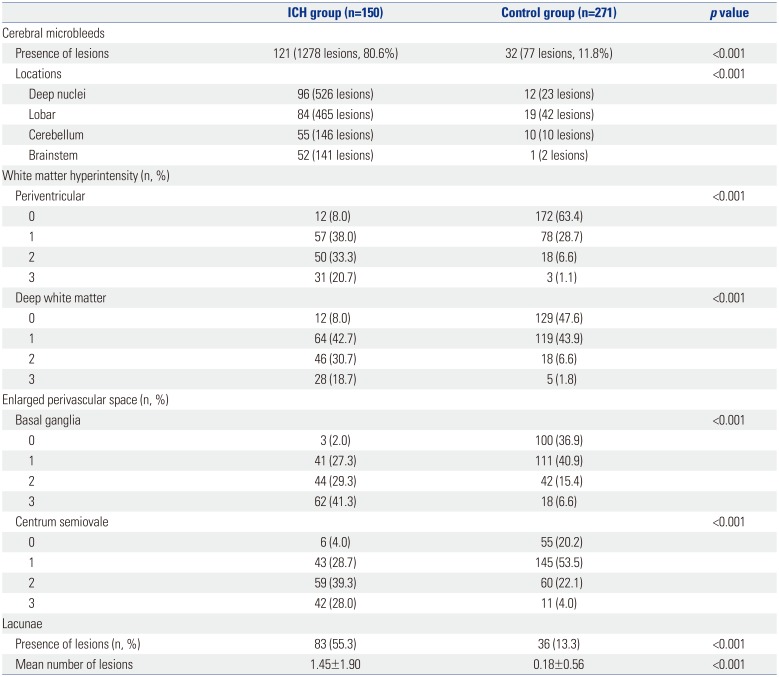
Table 2
Distributions of Small Vessel Disease in the Intracerebral Hemorrhage and Control Groups
![]()
Higher grade WMH was recorded in the ICH group than in the control group in both periventricular and deep white matter areas (p<0.001) (Table 2). EPVS also showed a higher grade in the ICH group, compared to the control group, in both the basal ganglia and centrum semiovale areas (p<0.001) (Table 2). Lacunae were detected in 83 patients in the ICH group (55.3%) and in 36 individuals in the control group (13.3%, p<0.001). The mean numbers of lacunae were 1.45±1.90 and 0.18±0.56 in the ICH group and control group, respectively (p<0.001).
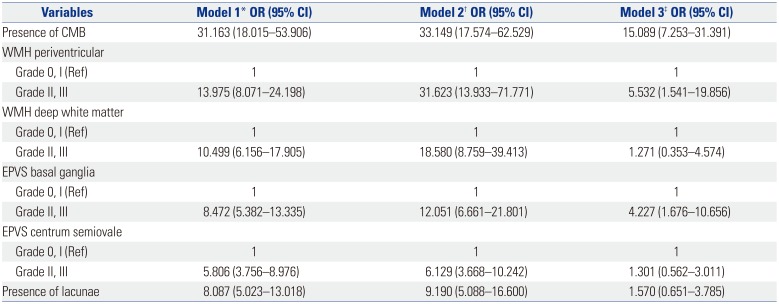
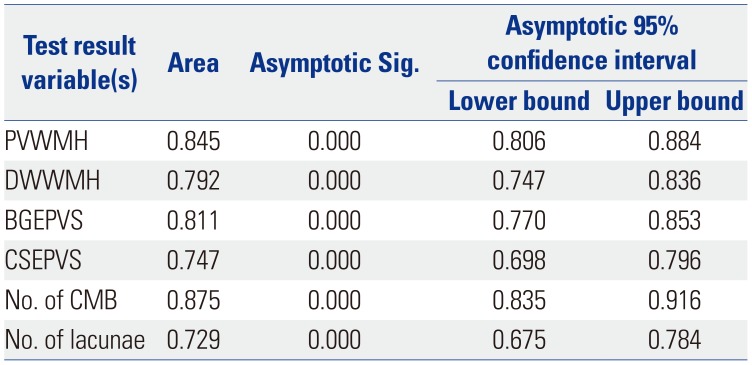
In unadjusted analysis, all SVD markers were significantly more severe in the ICH group. After adjusting for age, sex, cholesterol level, and presence of hypertension and diabetes, all SVD markers were still significantly more severe in the ICH group. When the clinical variables and all imaging markers were analyzed with multivariate analysis, the presence of CMB (odds ratio 15.089, 95% confidence interval 7.253–31.391), periventricular WMH (5.532, 1.541–19.856), and basal ganglia EPVS (4.227, 1.676–10.656) were significant markers in the ICH group (Table 3). When the area under the ROC curve was computed, the number of CMBs, the number of lacunae, periventricular and deep white matter WMH, and basal ganglia and centrum semiovale EPVS were significant (Table 4). The number of CMBs most significantly predicted ICH (Fig. 1).
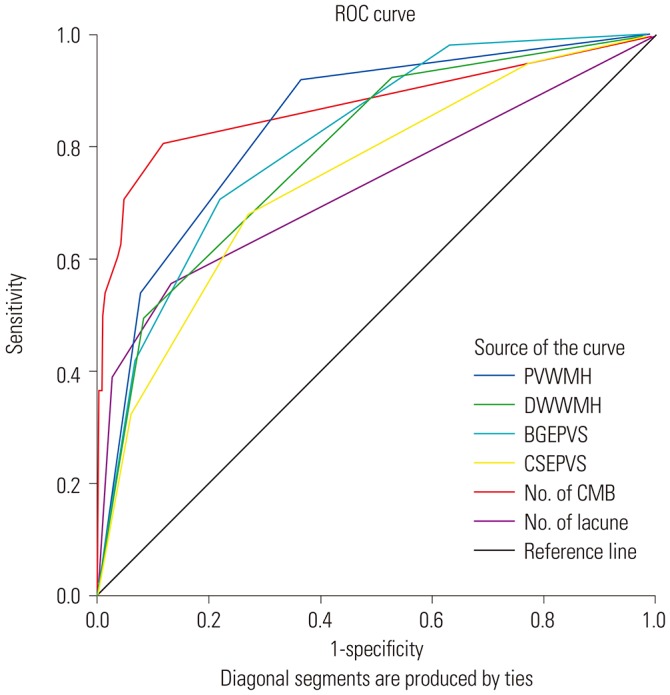 | Fig. 1Area under the receiver operating characteristic (ROC) curves were plotted with the number of cerebral microbleeds (CMB), the number of lacunae, periventricular (PVWMH) and deep white matter hyperintensity (DWWMH), and basal ganglia (BGEPVS) and centrum semiovale enlarged perivascular space (CSEPVS). The number of CMBs most significantly predicts intracerebral hemorrhage. No. of CMB, number of CMB; No. of lacune, number of lacunae.
|
Table 3
The Odds Ratio of Hemorrhage according to Small Vessel Disease Imaging Markers by Multiple Logistic Regression Analysis
OR, odds ratio; CI, confidence interval; CMB, cerebral microbleeds; WMH, white matter hyperintensity; Ref, reference; EPVS, enlarged perivascular space.
*Unadjusted analysis; †Adjusted for clinical variables: age, sex, hypertension, diabetes, high density lipoprotein cholesterol and low density lipoprotein cholesterol; ‡Adjusted for clinical variables and all imaging markers.
![]()
Table 4
Area Under the ROC Curves and the Significance of Each Imaging Marker
![]()
CMB, WMH, EPVS, and lacunae with aging
The patterns of SVD markers with aging are displayed in Fig. 2. CMB, WMH, EPVS, and lacunae were more severe in all age groups of the ICH group than of the control group. CMBs were prominent starting in the 30s and remained consistently high with aging in the ICH group. WMH at the periventricular area and at the deep white matter, EPVS in the basal ganglia and centrum semiovale, and lacunae increased gradually with aging in both groups. However, WMH and EPVS showed a consistently worse grade in the ICH group, even in young patients.
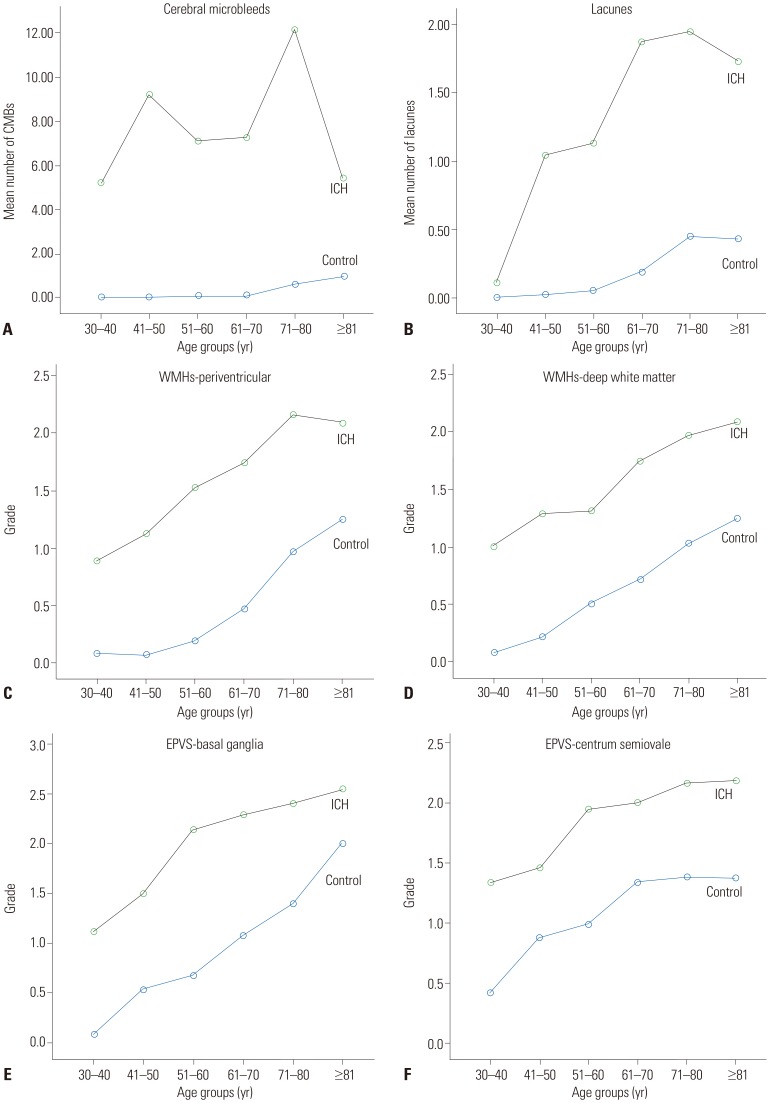 | Fig. 2The distribution of small vessel disease imaging markers by age group. Cerebral microbleeds (CMB) (A), lacunae (B), white matter hyperintensity (WMH) (C and D), and enlarged perivascular space (EPVS) (E and F) in the intracerebral hemorrhage (ICH) group and the control group. In all age groups, CMB, lacunae, WMH, and EPVS were more severe in the ICH group than in the control group. CMBs were prominent starting in the 30s and remained consistently high with aging in the ICH group. WMH in the periventricular area and deep white matter, EPVS in the basal ganglia and centrum semiovale, and lacunae all increased gradually with aging in both groups. These MRI markers had a consistently worse grade in the ICH group, even in young patients.
|
CMB and ICH
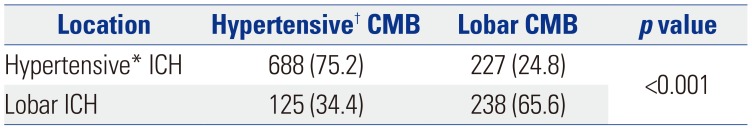
The most frequent ICH location was the deep nuclei (77 cases), followed by lobar (46 cases), cerebellum (15 cases), and brainstem (12 cases). When the spatial CMB distribution was grouped according to hypertensive ICH location, which included the deep nuclei, cerebellum, and brainstem, vs. lobar ICH location, the coincidence between CMB and ICH location was statistically significant (p<0.001). Probable hypertensive ICH patients had 688 hypertensive CMBs (75.2%) vs. 227 lobar CMBs (24.8%). Lobar ICH patients had 125 hypertensive CMBs (34.4%) vs. 238 lobar CMBs (65.6%). In patients with ICH in the deep nuclei, cerebellum, or brainstem, CMBs were most frequently found in the deep nuclei. For patients with lobar hemorrhage, lobar CMBs were most common (Table 5).
The mean ICH volume was 21.8 mL (±30.3, 2–147). The mean number of CMBs was 8.5 (±12.0, 0–76) in the ICH group. ICH volume was correlated with the number of CMBs (r=0.2, p=0.014). ICH volume in the deep nuclei was correlated with the number of CMBs in the deep nuclei (r=0.331, p=0.003), but was not correlated with the number of lobar CMBs. Lobar ICH volume was correlated with the number of lobar CMBs (r=0.415, p=0.004), but was not correlated with the number of deep nuclei CMBs.
Go to :
DISCUSSION
In this study, all SVD markers were more severe in the ICH group than in the control group. After adjusting for age, sex, hypertension, diabetes, and cholesterol level, CMBs, periventricular WMH, and basal ganglia EPVS were significant.
In terms of CMBs, they were observed in 80.6% (121/150) of the ICH patients, compared to 11.8% (32/271) in the control group. The frequency of CMBs has been reported as low as 54% and as high as 80% in ICH patients.17 In the control group, CMBs were reported in 15% in the 45 years and older age groups,18 in 26.5% in the 53 to 68 year old age group,17 and in 11.8% in the 32 to 87 year old age group in our study. A previous report using an older adult community survey found that the frequency was higher in the older adult population (mean age of 84.5 years) with a CMB prevalence of 27%.19 We found that CMBs increased with aging in the control group. However, CMB prevalence was not related with aging in the ICH group, and a high percentage of CMBs affected young patients in the ICH group. Out of 9 patients in their 30s, eight had CMBs in a non-lobar location. Our result is similar to findings from a city cohort study in young (≤49 years) stroke patients, which reported that the presence of CMBs was related with male sex, hypertension, moderate-severe WMH, and ICH.20
Charidimou, et al.14 reported that peri-basal ganglia WMH correlated with hypertensive ICH, and subcortical white matter spots correlated with lobar hemorrhage. Recently, WMH has been considered to be an independent risk factor for CMB,21 stroke and its mortality,2223 and poor outcomes after ICH including hematoma expansion.2425 The presence of WMH has been reported as a risk factor for major intracranial bleeding during anticoagulation.26 WMH is thought to be closely related to cognitive decline and dementia in older adults.27 WMH becomes more common with advancing age28 and is more pronounced in patients aged ≥65 years.29 In this study, WMH in both the ICH and control groups increased with age. However, in the ICH group, the grade of WMH was approximately one grade more severe than in the control group, and the changes appeared in young ICH patients. Further study is required to determine whether WMH is an independent risk factor for ICH or a common phenomenon related to small arteriolopathy.
EPVS has been suggested as a marker of SVD30 and may be related to interstitial fluid drainage impairment.31 Charidimou, et al.1530 reported a higher degree of centrum semiovale EPVS in relation to lobar CMB and lobar ICH, similar to cases with WMH. Hypertensive arteriopathy corresponds to basal ganglia EPVS, while amyloid angiopathy correlates with centrum semiovale EPVS. In our study, the degrees of EPVS in the basal ganglia and centrum semiovale were more severe in the ICH group than in the control group. Basal ganglia EPVS was significant in multivariate analysis. This imaging marker seems to reflect hypertensive vascular change. The EPVS was also prominent from a young age in the ICH group, although it showed a gradual increasing pattern with aging in both groups.
Lacunae are cavitating infarcts and are most commonly found in the putamen, caudate nucleus, thalamus, pons, internal capsule, and cerebral white matter. Lacunae have been considered as a marker of SVD32 and reported to be related with WMH, CMB, EPVS,6733 and ICH.7 One report found that lobar lacunae are associated with amyloid angiopathy, and deep lacunae are more frequent in hypertensive SVD and have a close relationship with WMH.16 In our study, lacunae were more frequent in the ICH group than in the control group. However, when the clinical variables were adjusted, the frequency of lacunae was not significantly different, and the aging patterns of lacunae were similar to those of other SVD markers (Fig. 2). The Framingham study showed that lacunar stroke and ICH shared hypertension as a common risk factor.34 WMH and EPVS in the ICH group showed similar slope with them in control group with aging. While these imaging markers should be considered as phenomena of the aging process, they definitely appeared earlier and to be more severe in the ICH group.
In terms of CMBs and ICH, there has been a consistent tendency of identical locations.1735 Our study also showed significant correlation with the corresponding location when we compared the ICH locations to the CMB locations (p<0.001). ICH volume was correlated with the number of CMBs. In particular, the ICH volume in the deep nuclei was correlated with the number of CMBs in the deep nuclei, and lobar ICH volume was correlated with the number of lobar CMBs. Some ICH patients had numerous CMBs that were crowded around the ICH area, especially in cases of deep nuclei ICH. Fisher referred to this phenomenon as an “avalanche or domino style.”36 Simultaneous spontaneous ICHs at different sites could be another example of this domino phenomenon. Intuitively, a large number of CMBs seems to suggest advanced multiple arterial vasculopathies. Larger CMB counts seem to develop along with a larger hemorrhage, and CMBs predict a future risk of symptomatic ICH.3738 However, the Boston group reviewed the relationship of microbleeds in patients with and without ICH.39 They reported that microbleed counts were greater in the non-ICH group, even though the groups had the same profiles regarding demographics, radiologic features, presence of apolipoprotein E, and vascular risks. These different results may be due to their study frame, as their study examined patients with high microbleed counts and included anticoagulation-treated ICH patients. Other reports suggest that CMBs may predict lesions for macrobleeding.1740 The total number of (micro) hemorrhages predicted the risk of future ICH. Higher numbers of (micro) hemorrhages increased the risk of cognitive impairment, loss of independence or death, along with the risk of subsequent ICH.37
A limitation of this study is that it did not include ICH patients without appropriate MRI sequences. Patients with large volume hemorrhage were not included due to early death or a poor general state for MRI acquisition. However, we included a large number of patients consecutively. Also, it is not known if WMH, EPSV, lacunae, CMB, and spontaneous ICH result from common risk factors or whether they have causal relationships with each other. Further study is necessary to investigate these relationships.
SVD markers have been commonly considered as neurodegenerative findings in the aging brain. Many studies on SVD have focused on ischemic stroke, cognitive decline, or physical disabilities. In our study, MRI markers for SVD were all worse in the ICH group than in the control group and were prominent in young ICH patients. All SVD markers should be considered due to their potential relationship with spontaneous ICH. Further studies are required to validate these results and to identify modifiable factors for the prevention of disastrous ICH development.
Go to :
 XML Download